Go: runtime: mallocgc leaks memory due to profilealloc when MemProfileRate is > 0 which is true by default
What version of Go are you using (go version)?
$ go version
go version go1.15.3 linux/amd64
Does this issue reproduce with the latest release?
yes
What operating system and processor architecture are you using (go env)?
go env Output
$ go env

GO111MODULE="auto"

GOARCH="amd64"

GOBIN=""

GOCACHE="/root/.cache/go-build"

GOENV="/root/.config/go/env"

GOEXE=""

GOFLAGS=""

GOHOSTARCH="amd64"

GOHOSTOS="linux"

GOINSECURE=""

GOMODCACHE="/go/pkg/mod"

GONOPROXY="gitlab.corp.wabtec.com"

GONOSUMDB="gitlab.corp.wabtec.com"

GOOS="linux"

GOPATH="/go"

GOPRIVATE="gitlab.corp.wabtec.com"

GOPROXY="https://proxy.golang.org,direct"

GOROOT="/usr/local/go"

GOSUMDB="sum.golang.org"

GOTMPDIR=""

GOTOOLDIR="/usr/local/go/pkg/tool/linux_amd64"

GCCGO="gccgo"

AR="ar"

CC="gcc"

CXX="g++"

CGO_ENABLED="1"

GOMOD="/workspaces/rm-edge-hst/go.mod"

CGO_CFLAGS="-g -O2"

CGO_CPPFLAGS=""

CGO_CXXFLAGS="-g -O2"

CGO_FFLAGS="-g -O2"

CGO_LDFLAGS="-g -O2"

PKG_CONFIG="pkg-config"

GOGCCFLAGS="-fPIC -m64 -pthread -fmessage-length=0 -fdebug-prefix-map=/tmp/go-build132198306=/tmp/go-build -gno-record-gcc-switches"
What did you do?
I reviewed the runtime source as I was looking for a stubborn memory leak in a long running process and discovered a code path that I think leaks memory. @josharian Encouraged me to raise an issue here after discussion on gophers slack #performance channel.
What did you expect to see?
No indefinite repeated calls to runtime.persistentalloc in a long running process.
What did you see instead?
runtime.MemProfileRate int = 512 * 1024by default i.e. > 0 (https://golang.org/src/runtime/mprof.go?h=MemProfileRate#L493)mallocgcwill therefore callprofileallocperiodically due toMemProfileRate > 0(https://golang.org/src/runtime/malloc.go?h=profilealloc#L1140)profileallocwill callmProf_Malloc(https://golang.org/src/runtime/malloc.go?h=mProf_Malloc#L1236)mProf_Mallocwill callstkbucket(https://golang.org/src/runtime/mprof.go?h=stkbucket#L344)stkbucketwill callnewBucket(https://golang.org/src/runtime/mprof.go?h=newBucket#L240)newBucketwill callpersistentallocwithsizeequal tounsafe.Sizeof(bucket{}) + uintptr(nstk)*unsafe.Sizeof(uintptr(0)) + unsafe.Sizeof(memRecord{})(https://golang.org/src/runtime/mprof.go?h=persistentalloc#L173)
So, even if nstk == 0 the minimum persistent allocation would be unsafe.Sizeof(bucket{}) + unsafe.Sizeof(memRecord{}) which is 144 bytes (https://play.golang.org/p/5JCqMHh_2aO). If I have understood this correctly, this means that we are guaranteed to leak at least 144 bytes every MemProfileRate by default.
 leighhopcroft
All 9 comments
I believe that this manifests as an ever increasing MemStats.BuckHashSys value. 
leighhopcroft
on 2 Nov 2020
stkbucket only calls newBucket if there isn't a bucket of that type already. So there's only an allocation once for every call stack that allocates. Once that happens, there will be no more allocation.
Could be a lot of allocation, sure. But we need an allocation for every entry in the map.
 randall77
on 2 Nov 2020
randall77
on 2 Nov 2020
cc @mknyszek @prattmic @aclements
 josharian
on 2 Nov 2020
josharian
on 2 Nov 2020
As @randall77 said I'm pretty sure this is working as in intended. There are a number of places in the runtime where we intentionally leak a bounded amount of memory to simplify the implementation. In this case, the bound is proportional to the number of unique allocation points (including callers). In practice there aren't _too_ many of them, and the rare ones virtually never show up at all. Has the additional memory use been a problem for you specifically @leighhopcroft?
 mknyszek
on 2 Nov 2020
mknyszek
on 2 Nov 2020
@randall77 I see, you are right. I must have missed that early return on line 231. I noticed that after adding some println logs to the persistentalloc I was seeing it consistently called over a 5 hour test session for an app I'm developing. I'm not sure whether it actually made a noticeable difference to RSS though as it was masked by a leak caused in a bug in my own code (incidentally the leak I was looking for when I found this). I think I may have this fixed now though so can run some further tests tomorrow to see at what point persistentalloc stops being called.
leighhopcroft
on 2 Nov 2020
If you're getting a lot of buckets allocated it might be interesting to see what the stacks are and why they are not identical. There may be some trivial difference that could be ignored.
randall77
on 2 Nov 2020
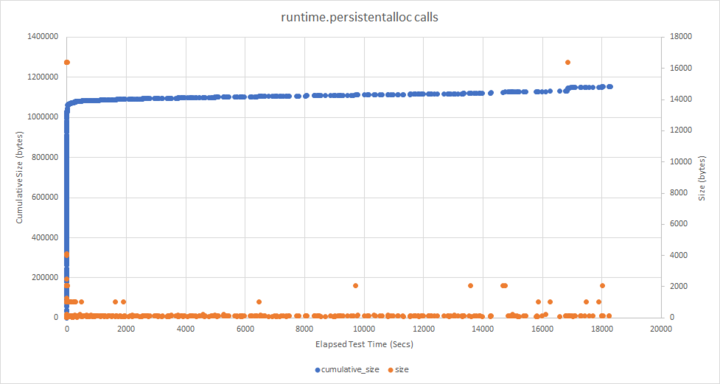
This was an analysis of persistentalloc calls I did regarding size. Not all are due to this specific code path but later testing showed the majority after around 50s in to the test are.
leighhopcroft
on 2 Nov 2020
@randall77 does the bucket hash function map similar stacks closer together in hash space? I have added some logging to stkbucket but the output is a bit unwieldy. I was thinking if similar stacks have similar hashes it will be enough just to plot the hash value distribution and see where there might be clumps of similar values.
leighhopcroft
on 3 Nov 2020
does the bucket hash function map similar stacks closer together in hash space?
No, the hash function is intended to distribute as randomly as possible.
randall77
on 3 Nov 2020
Related issues
 ajstarks
·
3Comments
ajstarks
·
3Comments
 gopherbot
·
3Comments
gopherbot
·
3Comments
 longzhizhi
·
3Comments
longzhizhi
·
3Comments
 OneOfOne
·
3Comments
OneOfOne
·
3Comments
 rakyll
·
3Comments
rakyll
·
3Comments