Go: sync: Mutex performance collapses with high concurrency
Some of the Go services I work with run on large machines, often with runtime.NumCPU reporting around 20–40 logical CPUs. They typically leave GOMAXPROCS at its default (high) value, so a single server process can use the entire machine.
The services handle inbound HTTP requests. For each inbound request, the services make some number outbound calls, wait for the responses, do calculations, and possibly make additional outbound calls. In these services, GOMAXPROCS is constant, the arrival rate of requests is subject to external forces, and the resulting concurrency—how many requests is the process handling at this moment—is controlled by how quickly the process responds to each request. (This sets them apart from worker-style programs that might poll a queue for new jobs.)
Starting with the Go 1.9 release, I've seen this type of service occasionally encounter sudden and severe lock contention.
I suspect this is related to the "starvation" mode added in Go 1.9, described in the release notes as "Mutex is now more fair". Just as Go 1.9's "starvation mode" change traded raw performance for more consistent behavior (fixing cases of pathological tail latency), our services need more consistent performance here. The applications sometimes use third-party packages that use sync.Mutex to protect internal state, and our options for responding to sudden contention there are limited.
This looks a bit different from what's described in _Non-scalable locks are dangerous_ since sync.Mutex only briefly spins before registering with a runtime semaphore. Those semaphores appear to be sharded, and to be protected by MCS locks.
When the microbenchmark's performance collapses, the execution trace shows that handing off the lock (from when the call to Unlock starts through to when the next goroutine's call to Lock is about to return) takes about 60–70µs.
CC @aclements
What version of Go are you using (go version)?
I've run the benchmark with go1.8.7, go1.9.7, go1.12.7, and go1.13beta1 on linux/amd64.
Does this issue reproduce with the latest release?
Yes
What operating system and processor architecture are you using (go env)?
The benchmark data is from an amd64 / x86_64 machine running Linux 4.14.
What did you do?
I built a micro-benchmark that is parallelizable except for a specific critical section. The default parameters of this benchmark are for each task to take about 350µs and to hold the shared lock for 1% of that time, about 3.5µs.
I ran the benchmark on a machine with 96 logical cores. I left GOMAXPROCS at the default of 96, and I varied the number of worker goroutines from 1 to 96. This mirrors the behavior of our RPC services, where the program is allowed to use all available hardware but the effective concurrency varies as the program runs.
What did you expect to see?
Since the critical section is short (1% of task cost), I expect that two goroutines will be able to process work at nearly double the speed of a single worker, and that 10 goroutines will have nearly 10x performance. (A speedup of 9x or 8x would also be acceptable.) I expect that adding worker goroutines will have diminishing returns, particularly once there's a goroutine per physical core (48 in this case) or when the rate at which the whole process completes tasks gets close to the length of the critical section. I expect that adding a worker goroutine won't significantly decrease the aggregate processing speed.
What did you see instead?
The following chart shows the results of running the test with a few versions of Go, each normalized so the performance of the single-goroutine case is defined as 1.
Go 1.8 has nearly linear performance up to 41 workers, finishing work at about 35x the rate of a single goroutine. After that, performance ranges from 28x to 37x.
The behavior of Go 1.9 is very different. It has nearly linear performance up to 45 workers (38x baseline), but with 46 workers its performance plummets to 12x baseline. At 51 workers it's at about 6x baseline, and after that its performance is about 5x baseline.
For Go 1.12 and Go 1.13 (beta), the benchmark includes user annotations via the runtime/trace package. Their performance is nearly linear until 28 workers (24x baseline), and have a more gradual fall back to 5x baseline with 44 workers.
The behavior of Go 1.8 is what I expect. With Go 1.9 and later, this sort of performance collapse means that a temporary increase in concurrency to a server can lead to a significant decrease in its performance, which causes a more permanent increase in concurrency.
(The parameters I used for the benchmark demonstrated collapse around concurrency of 32 to 48, but they can be tuned to show collapse at other points.)

This next image shows additional results.
Using a channel as a lock and building a scalable / non-collapsing MCS lock both have poor but consistent performance. They show linear increase until concurrency and speedup are both at 5 or 6, and then continue to have speedup of 5 up through concurrency of 96.
However, adding an explicit call to runtime.Gosched when releasing the lock results in consistent and good performance (similar to Go 1.8's behavior described above) for all lock types: sync.Mutex, channel, and MCS.

$ cat ./lock_test.go
package repro

import (
    "flag"
    "fmt"
    "runtime"
    "strconv"
    "strings"
    "sync"
    "sync/atomic"
    "testing"
    "unsafe"
)

var (
    cost        = flag.Int("cost", 1000, "loop cost")
    ratio       = flag.Float64("ratio", 0.01, "fration of loops with lock held")
    concurrency = flag.String("concurrency", "", "number of concurrent workers")

    sink interface{}
)

func BenchmarkLock(b *testing.B) {

    const loopCount = 1000

    testcase := func(workers int, mu sync.Locker, loopCost, withLock int, sem semaphore) func(b *testing.B) {
        return func(b *testing.B) {
            var (
                wg sync.WaitGroup

                buf = make([]byte, loopCost)
                out byte

                start = make(chan struct{})
            )

            for i := 0; i < workers; i++ {
                work := b.N / workers
                if i < b.N-(b.N/workers)*workers {
                    // division rounded down, now's the time to round up
                    work++
                }

                wg.Add(1)
                go func() {
                    defer wg.Done()

                    <-start

                    sem.Acquire()
                    defer sem.Release()

                    for i := 0; i < work; i++ {
                        var v byte
                        for k := 0; k < loopCount-withLock; k++ {
                            for l := range buf {
                                v += buf[l]
                            }
                        }
                        mu.Lock()
                        for k := 0; k < withLock; k++ {
                            for k := range buf {
                                v += buf[k]
                            }
                        }
                        out = v
                        mu.Unlock()
                    }
                }()
            }

            b.ResetTimer()
            close(start)
            wg.Wait()

            sink = out
        }
    }

    suite := func(newLock func() sync.Locker) func(b *testing.B) {
        return func(b *testing.B) {
            workers := 4 * runtime.GOMAXPROCS(0)
            cost, ratio := *cost, *ratio
            var concurrencies []int
            for _, v := range strings.Split(*concurrency, ",") {
                n, err := strconv.Atoi(v)
                if err == nil && n > 0 {
                    concurrencies = append(concurrencies, n)
                }
            }
            if len(concurrencies) == 0 {
                concurrencies = []int{workers}
            }
            withLock := int(ratio * loopCount)
            for _, concurrency := range concurrencies {
                b.Run(fmt.Sprintf("cost=%d,ratio=%0.3f,concurrency=%d", cost, float64(withLock)/loopCount, concurrency),
                    func(b *testing.B) {
                        b.Run("basic", testcase(workers, func() sync.Locker {
                            mu := newLock()
                            mu = &lockTracer{Locker: mu}
                            return mu
                        }(), cost, withLock, make(semaphore, concurrency)))
                        b.Run("gosched", testcase(workers, func() sync.Locker {
                            mu := newLock()
                            mu = &lockTracer{Locker: mu}
                            mu = &lockYielder{Locker: mu}
                            return mu
                        }(), cost, withLock, make(semaphore, concurrency)))
                    })
            }
        }
    }

    b.Run("sync.Mutex", suite(func() sync.Locker { return new(sync.Mutex) }))
    b.Run("mcs", suite(func() sync.Locker { return new(mcs) }))
    b.Run("chan", suite(func() sync.Locker { return newChannelLock() }))
}

type semaphore chan struct{}

func (s semaphore) Acquire() {
    if s != nil {
        s <- struct{}{}
    }
}

func (s semaphore) Release() {
    if s != nil {
        <-s
    }
}

type lockYielder struct {
    sync.Locker
}

func (ly *lockYielder) Lock()   { ly.Locker.Lock() }
func (ly *lockYielder) Unlock() { ly.Locker.Unlock(); runtime.Gosched() }

type lockTracer struct {
    sync.Locker
    handoffEnd func()
}

type channelLock chan struct{}

func newChannelLock() channelLock { return make(chan struct{}, 1) }
func (mu channelLock) Lock()      { mu <- struct{}{} }
func (mu channelLock) Unlock()    { <-mu }

type mcs struct {
    tail *qnode

    holder *qnode // protected by the lock itself
}

type qnode struct {
    next *qnode

    wg sync.WaitGroup
}

func (mu *mcs) Lock() {
    node := mu.lock()
    mu.holder = node
}

func (mu *mcs) Unlock() {
    node := mu.holder
    mu.holder = nil
    mu.unlock(node)
}

func (mu *mcs) lock() *qnode {
    self := new(qnode)
    self.wg.Add(1)
    prev := (*qnode)(atomic.SwapPointer((*unsafe.Pointer)(unsafe.Pointer(&mu.tail)), unsafe.Pointer(self)))
    if prev != nil {
        atomic.StorePointer((*unsafe.Pointer)(unsafe.Pointer(&prev.next)), unsafe.Pointer(self)) // prev.next = self
        // wait for prev node to unlock us
        self.wg.Wait()
    }
    return self
}

func (mu *mcs) unlock(node *qnode) {
    for {
        next := (*qnode)(atomic.LoadPointer((*unsafe.Pointer)(unsafe.Pointer(&node.next))))
        if next != nil {
            // known successor, unblock their call to Lock
            next.wg.Done()
            return
        }

        if atomic.CompareAndSwapPointer((*unsafe.Pointer)(unsafe.Pointer(&mu.tail)), unsafe.Pointer(node), nil) {
            // no known successor, and in fact there's no successor at all
            return
        }

        // successor hasn't finished adding themselves to the queue
    }
}
$ cat ./lock_trace_go111_test.go
// +build go1.11

package repro

import (
    "context"
    "runtime/trace"
)

func (lt *lockTracer) Lock() {
    wait := trace.StartRegion(context.Background(), "wait-lock")
    lt.Locker.Lock()
    wait.End()
    if lt.handoffEnd != nil {
        lt.handoffEnd()
        lt.handoffEnd = nil
    }
}

func (lt *lockTracer) Unlock() {
    _, handoff := trace.NewTask(context.Background(), "handoff")
    lt.handoffEnd = handoff.End
    wait := trace.StartRegion(context.Background(), "wait-unlock")
    lt.Locker.Unlock()
    wait.End()
}
 rhysh
rhysh
All 19 comments
CC @dvyukov
 ianlancetaylor
on 21 Aug 2019
ianlancetaylor
on 21 Aug 2019
(Thanks for the fantastic bug report, as usual :)
Just a few quick points of clarification to make sure I'm interpreting the graphs right:
- When you say the machine has 96 logical cores, does that mean 48 physical cores times 2 hyper-threads each?
- How many NUMA nodes does it have?
- Since you didn't mention it, I assume you're not doing anything with explicit CPU affinity. If you run the experiment multiple times, does the drop always happen at exactly the same place or just roughly the same point (wondering if thread placement has any effect)?
The output of lstopo --no-io --of console would answer the first two questions.
 aclements
on 21 Aug 2019
aclements
on 21 Aug 2019
(Thanks for pointing me in the right direction!)
On (1), yes, that's my understanding of the hardware. On (2), it has two NUMA nodes. I've included the output of lstopo at the bottom.
If those are confounding factors, I can also try to reproduce the result on one NUMA node with hyper-threading disabled. This hardware reflects a typical deployment of our services, which often run on "the largest possible instance". Here it's a c5.24xlarge with Amazon Linux 2. I've seen the problem I'm trying to describe on c4.8xlarge and c5.9xlarge instances (36 vCPUs), and on dual-socket machines (with 2 NUMA nodes) on premises that have between 20 and 40 hyper-threads.
On (3), I'm not doing anything special with CPU affinity. The charts are based on the output of benchstat with 10 runs at each point with benchtime=1s. The dropoff is sharpest with Go 1.9: There's no sign of it with 43 workers, and by 51 workers the transition is complete. One of the runs with 48 workers shows great performance (8394 ns/op), most of them are terrible (57506 ns/op).
Go 1.9 raw data from 43–51 workers
BenchmarkLock/sync.Mutex/cost=1000,ratio=0.010,concurrency=43/basic-96 200000 9459 ns/op
BenchmarkLock/sync.Mutex/cost=1000,ratio=0.010,concurrency=43/basic-96 200000 9063 ns/op
BenchmarkLock/sync.Mutex/cost=1000,ratio=0.010,concurrency=43/basic-96 200000 9061 ns/op
BenchmarkLock/sync.Mutex/cost=1000,ratio=0.010,concurrency=43/basic-96 200000 9098 ns/op
BenchmarkLock/sync.Mutex/cost=1000,ratio=0.010,concurrency=43/basic-96 200000 9737 ns/op
BenchmarkLock/sync.Mutex/cost=1000,ratio=0.010,concurrency=43/basic-96 200000 9509 ns/op
BenchmarkLock/sync.Mutex/cost=1000,ratio=0.010,concurrency=43/basic-96 200000 9304 ns/op
BenchmarkLock/sync.Mutex/cost=1000,ratio=0.010,concurrency=43/basic-96 200000 9057 ns/op
BenchmarkLock/sync.Mutex/cost=1000,ratio=0.010,concurrency=43/basic-96 200000 9155 ns/op
BenchmarkLock/sync.Mutex/cost=1000,ratio=0.010,concurrency=43/basic-96 200000 9003 ns/op
BenchmarkLock/sync.Mutex/cost=1000,ratio=0.010,concurrency=44/basic-96 200000 9047 ns/op
BenchmarkLock/sync.Mutex/cost=1000,ratio=0.010,concurrency=44/basic-96 200000 9544 ns/op
BenchmarkLock/sync.Mutex/cost=1000,ratio=0.010,concurrency=44/basic-96 200000 15345 ns/op
BenchmarkLock/sync.Mutex/cost=1000,ratio=0.010,concurrency=44/basic-96 200000 9424 ns/op
BenchmarkLock/sync.Mutex/cost=1000,ratio=0.010,concurrency=44/basic-96 200000 9098 ns/op
BenchmarkLock/sync.Mutex/cost=1000,ratio=0.010,concurrency=44/basic-96 200000 9370 ns/op
BenchmarkLock/sync.Mutex/cost=1000,ratio=0.010,concurrency=44/basic-96 200000 8916 ns/op
BenchmarkLock/sync.Mutex/cost=1000,ratio=0.010,concurrency=44/basic-96 200000 8970 ns/op
BenchmarkLock/sync.Mutex/cost=1000,ratio=0.010,concurrency=44/basic-96 200000 9279 ns/op
BenchmarkLock/sync.Mutex/cost=1000,ratio=0.010,concurrency=44/basic-96 200000 8972 ns/op
BenchmarkLock/sync.Mutex/cost=1000,ratio=0.010,concurrency=45/basic-96 200000 9091 ns/op
BenchmarkLock/sync.Mutex/cost=1000,ratio=0.010,concurrency=45/basic-96 200000 9825 ns/op
BenchmarkLock/sync.Mutex/cost=1000,ratio=0.010,concurrency=45/basic-96 200000 9030 ns/op
BenchmarkLock/sync.Mutex/cost=1000,ratio=0.010,concurrency=45/basic-96 200000 8923 ns/op
BenchmarkLock/sync.Mutex/cost=1000,ratio=0.010,concurrency=45/basic-96 200000 9065 ns/op
BenchmarkLock/sync.Mutex/cost=1000,ratio=0.010,concurrency=45/basic-96 200000 9364 ns/op
BenchmarkLock/sync.Mutex/cost=1000,ratio=0.010,concurrency=45/basic-96 200000 8942 ns/op
BenchmarkLock/sync.Mutex/cost=1000,ratio=0.010,concurrency=45/basic-96 200000 9656 ns/op
BenchmarkLock/sync.Mutex/cost=1000,ratio=0.010,concurrency=45/basic-96 200000 10062 ns/op
BenchmarkLock/sync.Mutex/cost=1000,ratio=0.010,concurrency=45/basic-96 200000 24069 ns/op
BenchmarkLock/sync.Mutex/cost=1000,ratio=0.010,concurrency=46/basic-96 100000 30508 ns/op
BenchmarkLock/sync.Mutex/cost=1000,ratio=0.010,concurrency=46/basic-96 200000 9923 ns/op
BenchmarkLock/sync.Mutex/cost=1000,ratio=0.010,concurrency=46/basic-96 200000 39974 ns/op
BenchmarkLock/sync.Mutex/cost=1000,ratio=0.010,concurrency=46/basic-96 100000 45714 ns/op
BenchmarkLock/sync.Mutex/cost=1000,ratio=0.010,concurrency=46/basic-96 100000 40718 ns/op
BenchmarkLock/sync.Mutex/cost=1000,ratio=0.010,concurrency=46/basic-96 100000 22302 ns/op
BenchmarkLock/sync.Mutex/cost=1000,ratio=0.010,concurrency=46/basic-96 100000 63806 ns/op
BenchmarkLock/sync.Mutex/cost=1000,ratio=0.010,concurrency=46/basic-96 200000 27361 ns/op
BenchmarkLock/sync.Mutex/cost=1000,ratio=0.010,concurrency=46/basic-96 200000 9480 ns/op
BenchmarkLock/sync.Mutex/cost=1000,ratio=0.010,concurrency=46/basic-96 200000 9070 ns/op
BenchmarkLock/sync.Mutex/cost=1000,ratio=0.010,concurrency=47/basic-96 200000 8857 ns/op
BenchmarkLock/sync.Mutex/cost=1000,ratio=0.010,concurrency=47/basic-96 30000 62245 ns/op
BenchmarkLock/sync.Mutex/cost=1000,ratio=0.010,concurrency=47/basic-96 100000 19403 ns/op
BenchmarkLock/sync.Mutex/cost=1000,ratio=0.010,concurrency=47/basic-96 100000 48942 ns/op
BenchmarkLock/sync.Mutex/cost=1000,ratio=0.010,concurrency=47/basic-96 200000 15966 ns/op
BenchmarkLock/sync.Mutex/cost=1000,ratio=0.010,concurrency=47/basic-96 200000 24827 ns/op
BenchmarkLock/sync.Mutex/cost=1000,ratio=0.010,concurrency=47/basic-96 200000 49980 ns/op
BenchmarkLock/sync.Mutex/cost=1000,ratio=0.010,concurrency=47/basic-96 100000 35991 ns/op
BenchmarkLock/sync.Mutex/cost=1000,ratio=0.010,concurrency=47/basic-96 100000 59295 ns/op
BenchmarkLock/sync.Mutex/cost=1000,ratio=0.010,concurrency=47/basic-96 100000 26748 ns/op
BenchmarkLock/sync.Mutex/cost=1000,ratio=0.010,concurrency=48/basic-96 30000 52410 ns/op
BenchmarkLock/sync.Mutex/cost=1000,ratio=0.010,concurrency=48/basic-96 30000 57506 ns/op
BenchmarkLock/sync.Mutex/cost=1000,ratio=0.010,concurrency=48/basic-96 200000 23507 ns/op
BenchmarkLock/sync.Mutex/cost=1000,ratio=0.010,concurrency=48/basic-96 200000 35904 ns/op
BenchmarkLock/sync.Mutex/cost=1000,ratio=0.010,concurrency=48/basic-96 200000 8394 ns/op
BenchmarkLock/sync.Mutex/cost=1000,ratio=0.010,concurrency=48/basic-96 200000 64450 ns/op
BenchmarkLock/sync.Mutex/cost=1000,ratio=0.010,concurrency=48/basic-96 100000 60926 ns/op
BenchmarkLock/sync.Mutex/cost=1000,ratio=0.010,concurrency=48/basic-96 100000 62607 ns/op
BenchmarkLock/sync.Mutex/cost=1000,ratio=0.010,concurrency=48/basic-96 100000 36662 ns/op
BenchmarkLock/sync.Mutex/cost=1000,ratio=0.010,concurrency=48/basic-96 200000 59184 ns/op
BenchmarkLock/sync.Mutex/cost=1000,ratio=0.010,concurrency=49/basic-96 200000 47114 ns/op
BenchmarkLock/sync.Mutex/cost=1000,ratio=0.010,concurrency=49/basic-96 30000 36251 ns/op
BenchmarkLock/sync.Mutex/cost=1000,ratio=0.010,concurrency=49/basic-96 200000 51755 ns/op
BenchmarkLock/sync.Mutex/cost=1000,ratio=0.010,concurrency=49/basic-96 100000 35519 ns/op
BenchmarkLock/sync.Mutex/cost=1000,ratio=0.010,concurrency=49/basic-96 200000 42502 ns/op
BenchmarkLock/sync.Mutex/cost=1000,ratio=0.010,concurrency=49/basic-96 100000 57117 ns/op
BenchmarkLock/sync.Mutex/cost=1000,ratio=0.010,concurrency=49/basic-96 30000 48315 ns/op
BenchmarkLock/sync.Mutex/cost=1000,ratio=0.010,concurrency=49/basic-96 50000 59583 ns/op
BenchmarkLock/sync.Mutex/cost=1000,ratio=0.010,concurrency=49/basic-96 100000 52919 ns/op
BenchmarkLock/sync.Mutex/cost=1000,ratio=0.010,concurrency=49/basic-96 100000 52797 ns/op
BenchmarkLock/sync.Mutex/cost=1000,ratio=0.010,concurrency=50/basic-96 100000 59135 ns/op
BenchmarkLock/sync.Mutex/cost=1000,ratio=0.010,concurrency=50/basic-96 30000 57120 ns/op
BenchmarkLock/sync.Mutex/cost=1000,ratio=0.010,concurrency=50/basic-96 30000 44242 ns/op
BenchmarkLock/sync.Mutex/cost=1000,ratio=0.010,concurrency=50/basic-96 50000 45639 ns/op
BenchmarkLock/sync.Mutex/cost=1000,ratio=0.010,concurrency=50/basic-96 50000 36289 ns/op
BenchmarkLock/sync.Mutex/cost=1000,ratio=0.010,concurrency=50/basic-96 50000 60053 ns/op
BenchmarkLock/sync.Mutex/cost=1000,ratio=0.010,concurrency=50/basic-96 50000 62858 ns/op
BenchmarkLock/sync.Mutex/cost=1000,ratio=0.010,concurrency=50/basic-96 50000 60839 ns/op
BenchmarkLock/sync.Mutex/cost=1000,ratio=0.010,concurrency=50/basic-96 30000 49936 ns/op
BenchmarkLock/sync.Mutex/cost=1000,ratio=0.010,concurrency=50/basic-96 30000 41309 ns/op
BenchmarkLock/sync.Mutex/cost=1000,ratio=0.010,concurrency=51/basic-96 30000 51982 ns/op
BenchmarkLock/sync.Mutex/cost=1000,ratio=0.010,concurrency=51/basic-96 30000 63764 ns/op
BenchmarkLock/sync.Mutex/cost=1000,ratio=0.010,concurrency=51/basic-96 50000 44332 ns/op
BenchmarkLock/sync.Mutex/cost=1000,ratio=0.010,concurrency=51/basic-96 20000 64803 ns/op
BenchmarkLock/sync.Mutex/cost=1000,ratio=0.010,concurrency=51/basic-96 50000 63838 ns/op
BenchmarkLock/sync.Mutex/cost=1000,ratio=0.010,concurrency=51/basic-96 100000 64519 ns/op
BenchmarkLock/sync.Mutex/cost=1000,ratio=0.010,concurrency=51/basic-96 30000 57586 ns/op
BenchmarkLock/sync.Mutex/cost=1000,ratio=0.010,concurrency=51/basic-96 20000 61535 ns/op
BenchmarkLock/sync.Mutex/cost=1000,ratio=0.010,concurrency=51/basic-96 30000 50432 ns/op
BenchmarkLock/sync.Mutex/cost=1000,ratio=0.010,concurrency=51/basic-96 30000 61129 ns/op
$ lstopo-no-graphics --no-io --of console Output
$ lstopo-no-graphics --no-io --of console
Machine (185GB total)
NUMANode L#0 (P#0 92GB) + Package L#0 + L3 L#0 (36MB)
L2 L#0 (1024KB) + L1d L#0 (32KB) + L1i L#0 (32KB) + Core L#0
PU L#0 (P#0)
PU L#1 (P#48)
L2 L#1 (1024KB) + L1d L#1 (32KB) + L1i L#1 (32KB) + Core L#1
PU L#2 (P#1)
PU L#3 (P#49)
L2 L#2 (1024KB) + L1d L#2 (32KB) + L1i L#2 (32KB) + Core L#2
PU L#4 (P#2)
PU L#5 (P#50)
L2 L#3 (1024KB) + L1d L#3 (32KB) + L1i L#3 (32KB) + Core L#3
PU L#6 (P#3)
PU L#7 (P#51)
L2 L#4 (1024KB) + L1d L#4 (32KB) + L1i L#4 (32KB) + Core L#4
PU L#8 (P#4)
PU L#9 (P#52)
L2 L#5 (1024KB) + L1d L#5 (32KB) + L1i L#5 (32KB) + Core L#5
PU L#10 (P#5)
PU L#11 (P#53)
L2 L#6 (1024KB) + L1d L#6 (32KB) + L1i L#6 (32KB) + Core L#6
PU L#12 (P#6)
PU L#13 (P#54)
L2 L#7 (1024KB) + L1d L#7 (32KB) + L1i L#7 (32KB) + Core L#7
PU L#14 (P#7)
PU L#15 (P#55)
L2 L#8 (1024KB) + L1d L#8 (32KB) + L1i L#8 (32KB) + Core L#8
PU L#16 (P#8)
PU L#17 (P#56)
L2 L#9 (1024KB) + L1d L#9 (32KB) + L1i L#9 (32KB) + Core L#9
PU L#18 (P#9)
PU L#19 (P#57)
L2 L#10 (1024KB) + L1d L#10 (32KB) + L1i L#10 (32KB) + Core L#10
PU L#20 (P#10)
PU L#21 (P#58)
L2 L#11 (1024KB) + L1d L#11 (32KB) + L1i L#11 (32KB) + Core L#11
PU L#22 (P#11)
PU L#23 (P#59)
L2 L#12 (1024KB) + L1d L#12 (32KB) + L1i L#12 (32KB) + Core L#12
PU L#24 (P#12)
PU L#25 (P#60)
L2 L#13 (1024KB) + L1d L#13 (32KB) + L1i L#13 (32KB) + Core L#13
PU L#26 (P#13)
PU L#27 (P#61)
L2 L#14 (1024KB) + L1d L#14 (32KB) + L1i L#14 (32KB) + Core L#14
PU L#28 (P#14)
PU L#29 (P#62)
L2 L#15 (1024KB) + L1d L#15 (32KB) + L1i L#15 (32KB) + Core L#15
PU L#30 (P#15)
PU L#31 (P#63)
L2 L#16 (1024KB) + L1d L#16 (32KB) + L1i L#16 (32KB) + Core L#16
PU L#32 (P#16)
PU L#33 (P#64)
L2 L#17 (1024KB) + L1d L#17 (32KB) + L1i L#17 (32KB) + Core L#17
PU L#34 (P#17)
PU L#35 (P#65)
L2 L#18 (1024KB) + L1d L#18 (32KB) + L1i L#18 (32KB) + Core L#18
PU L#36 (P#18)
PU L#37 (P#66)
L2 L#19 (1024KB) + L1d L#19 (32KB) + L1i L#19 (32KB) + Core L#19
PU L#38 (P#19)
PU L#39 (P#67)
L2 L#20 (1024KB) + L1d L#20 (32KB) + L1i L#20 (32KB) + Core L#20
PU L#40 (P#20)
PU L#41 (P#68)
L2 L#21 (1024KB) + L1d L#21 (32KB) + L1i L#21 (32KB) + Core L#21
PU L#42 (P#21)
PU L#43 (P#69)
L2 L#22 (1024KB) + L1d L#22 (32KB) + L1i L#22 (32KB) + Core L#22
PU L#44 (P#22)
PU L#45 (P#70)
L2 L#23 (1024KB) + L1d L#23 (32KB) + L1i L#23 (32KB) + Core L#23
PU L#46 (P#23)
PU L#47 (P#71)
NUMANode L#1 (P#1 92GB) + Package L#1 + L3 L#1 (36MB)
L2 L#24 (1024KB) + L1d L#24 (32KB) + L1i L#24 (32KB) + Core L#24
PU L#48 (P#24)
PU L#49 (P#72)
L2 L#25 (1024KB) + L1d L#25 (32KB) + L1i L#25 (32KB) + Core L#25
PU L#50 (P#25)
PU L#51 (P#73)
L2 L#26 (1024KB) + L1d L#26 (32KB) + L1i L#26 (32KB) + Core L#26
PU L#52 (P#26)
PU L#53 (P#74)
L2 L#27 (1024KB) + L1d L#27 (32KB) + L1i L#27 (32KB) + Core L#27
PU L#54 (P#27)
PU L#55 (P#75)
L2 L#28 (1024KB) + L1d L#28 (32KB) + L1i L#28 (32KB) + Core L#28
PU L#56 (P#28)
PU L#57 (P#76)
L2 L#29 (1024KB) + L1d L#29 (32KB) + L1i L#29 (32KB) + Core L#29
PU L#58 (P#29)
PU L#59 (P#77)
L2 L#30 (1024KB) + L1d L#30 (32KB) + L1i L#30 (32KB) + Core L#30
PU L#60 (P#30)
PU L#61 (P#78)
L2 L#31 (1024KB) + L1d L#31 (32KB) + L1i L#31 (32KB) + Core L#31
PU L#62 (P#31)
PU L#63 (P#79)
L2 L#32 (1024KB) + L1d L#32 (32KB) + L1i L#32 (32KB) + Core L#32
PU L#64 (P#32)
PU L#65 (P#80)
L2 L#33 (1024KB) + L1d L#33 (32KB) + L1i L#33 (32KB) + Core L#33
PU L#66 (P#33)
PU L#67 (P#81)
L2 L#34 (1024KB) + L1d L#34 (32KB) + L1i L#34 (32KB) + Core L#34
PU L#68 (P#34)
PU L#69 (P#82)
L2 L#35 (1024KB) + L1d L#35 (32KB) + L1i L#35 (32KB) + Core L#35
PU L#70 (P#35)
PU L#71 (P#83)
L2 L#36 (1024KB) + L1d L#36 (32KB) + L1i L#36 (32KB) + Core L#36
PU L#72 (P#36)
PU L#73 (P#84)
L2 L#37 (1024KB) + L1d L#37 (32KB) + L1i L#37 (32KB) + Core L#37
PU L#74 (P#37)
PU L#75 (P#85)
L2 L#38 (1024KB) + L1d L#38 (32KB) + L1i L#38 (32KB) + Core L#38
PU L#76 (P#38)
PU L#77 (P#86)
L2 L#39 (1024KB) + L1d L#39 (32KB) + L1i L#39 (32KB) + Core L#39
PU L#78 (P#39)
PU L#79 (P#87)
L2 L#40 (1024KB) + L1d L#40 (32KB) + L1i L#40 (32KB) + Core L#40
PU L#80 (P#40)
PU L#81 (P#88)
L2 L#41 (1024KB) + L1d L#41 (32KB) + L1i L#41 (32KB) + Core L#41
PU L#82 (P#41)
PU L#83 (P#89)
L2 L#42 (1024KB) + L1d L#42 (32KB) + L1i L#42 (32KB) + Core L#42
PU L#84 (P#42)
PU L#85 (P#90)
L2 L#43 (1024KB) + L1d L#43 (32KB) + L1i L#43 (32KB) + Core L#43
PU L#86 (P#43)
PU L#87 (P#91)
L2 L#44 (1024KB) + L1d L#44 (32KB) + L1i L#44 (32KB) + Core L#44
PU L#88 (P#44)
PU L#89 (P#92)
L2 L#45 (1024KB) + L1d L#45 (32KB) + L1i L#45 (32KB) + Core L#45
PU L#90 (P#45)
PU L#91 (P#93)
L2 L#46 (1024KB) + L1d L#46 (32KB) + L1i L#46 (32KB) + Core L#46
PU L#92 (P#46)
PU L#93 (P#94)
L2 L#47 (1024KB) + L1d L#47 (32KB) + L1i L#47 (32KB) + Core L#47
PU L#94 (P#47)
PU L#95 (P#95)
I wonder: Is it a coincidence that the cutoff is right around the number of physical cores?
Do you have source handy for this benchmark? [... yes, it's in the post, i didn't know Github had those little expandy-arrow things.] It might be instructive to try it on different hardware.
For instance, if it started happening around 30ish goroutines on a 32-core platform... Although it seems really unlikely that a performance degradation that severe would happen around 8 concurrent workers on a typical laptop, without someone noticing it.
Update: On my laptop (Xeon of some sort, 4 physical cores, 8 "CPUs"): ~570us at concurrency=1, drops to about 144us at concurrency=5, does not degrade even at concurrency and GOMAXPROCS of 80+. So I think I actually don't hit whatever's causing this. Speculation: CPU hardware feature that changes behavior for some N.
 seebs
on 21 Aug 2019
seebs
on 21 Aug 2019
According to the change description for https://golang.org/cl/34310, “Unfair wait time is now limited to 1ms.”
Your collapse appears to begin at around 28 workers. At a quick calculation, 1ms / 28 workers ≈ 35.7 μs / worker.
You note that a collapsed lock takes “about 60–70μs” per handoff, which is well above that 35.7μs threshold: certainly enough to keep a lock that is already in “starvation mode” stuck there in the steady state. Moreover, driving such a lock back into the unfair regime would require dropping to only ~17 workers — which roughly corresponds to the start of the nonlinear part of your reported performance curve.
So here's my (untested) hypothesis: at 28 workers, you're close enough to the unfair-wait threshold that some interruption — perhaps an unusually long GC pause, or perhaps an OS scheduling event — drives the lock into starvation mode, and the increased cost is sufficient to keep it there until load decreases well below the initial breakdown threshold.
 bcmills
on 22 Aug 2019
bcmills
on 22 Aug 2019
Would it make sense to have the Unlock slow path directly yield its P to the G that was first in line waiting to acquire the mutex (or, as a first approximation, calling runtime.Gosched in the Unlock slow path)?
 CAFxX
on 22 Aug 2019
CAFxX
on 22 Aug 2019
In the benchmark there is the following line: "workers := 4 *
runtime.GOMAXPROCS(0)" line. Doesn't this end up putting 4 goroutines
on each proc which seems contradictory to the prose which indicates 1
per proc. Am I missing something or is it just a cut paste fumble
finger problem?
suite := func(newLock func() sync.Locker) func(b *testing.B) {
return func(b *testing.B) {
workers := 4 * runtime.GOMAXPROCS(0) <<<<<<<<<<<<
cost, ratio := *cost, *ratio
var concurrencies []int
On Thu, Aug 22, 2019 at 12:29 AM Carlo Alberto Ferraris <
[email protected]> wrote:
Would it make sense to have the Unlock slow path directly yield its P to
start running the next G that was waiting to acquire the mutex?—
You are receiving this because you are subscribed to this thread.
Reply to this email directly, view it on GitHub
https://github.com/golang/go/issues/33747?email_source=notifications&email_token=AAHNNH76XE7UHRLRJ6CDWRDQFYI3RA5CNFSM4IN67ZL2YY3PNVWWK3TUL52HS4DFVREXG43VMVBW63LNMVXHJKTDN5WW2ZLOORPWSZGOD4324QQ#issuecomment-523742786,
or mute the thread
https://github.com/notifications/unsubscribe-auth/AAHNNH5KX6PD3JDR5XERV3DQFYI3RANCNFSM4IN67ZLQ
.
 RLH
on 22 Aug 2019
RLH
on 22 Aug 2019
@RLH the work is split into 4xGOMAXPROCS pieces, but the number of goroutines that are allowed to concurrently execute that work is controlled by a semaphore (sem.Acquire()/defer sem.Release(), and the call to make(semaphore, concurrency) nestled in with the other test setup arguments). When GOMAXPROCS is "10" and concurrency is "7", the value of b.N will be split into 40 pieces of nearly even size, there will be one worker goroutine for each of those pieces, and for most of the benchmark 33 of them will be blocked waiting for a token from the semaphore (with up to 7 concurrently doing the work).
rhysh
on 22 Aug 2019
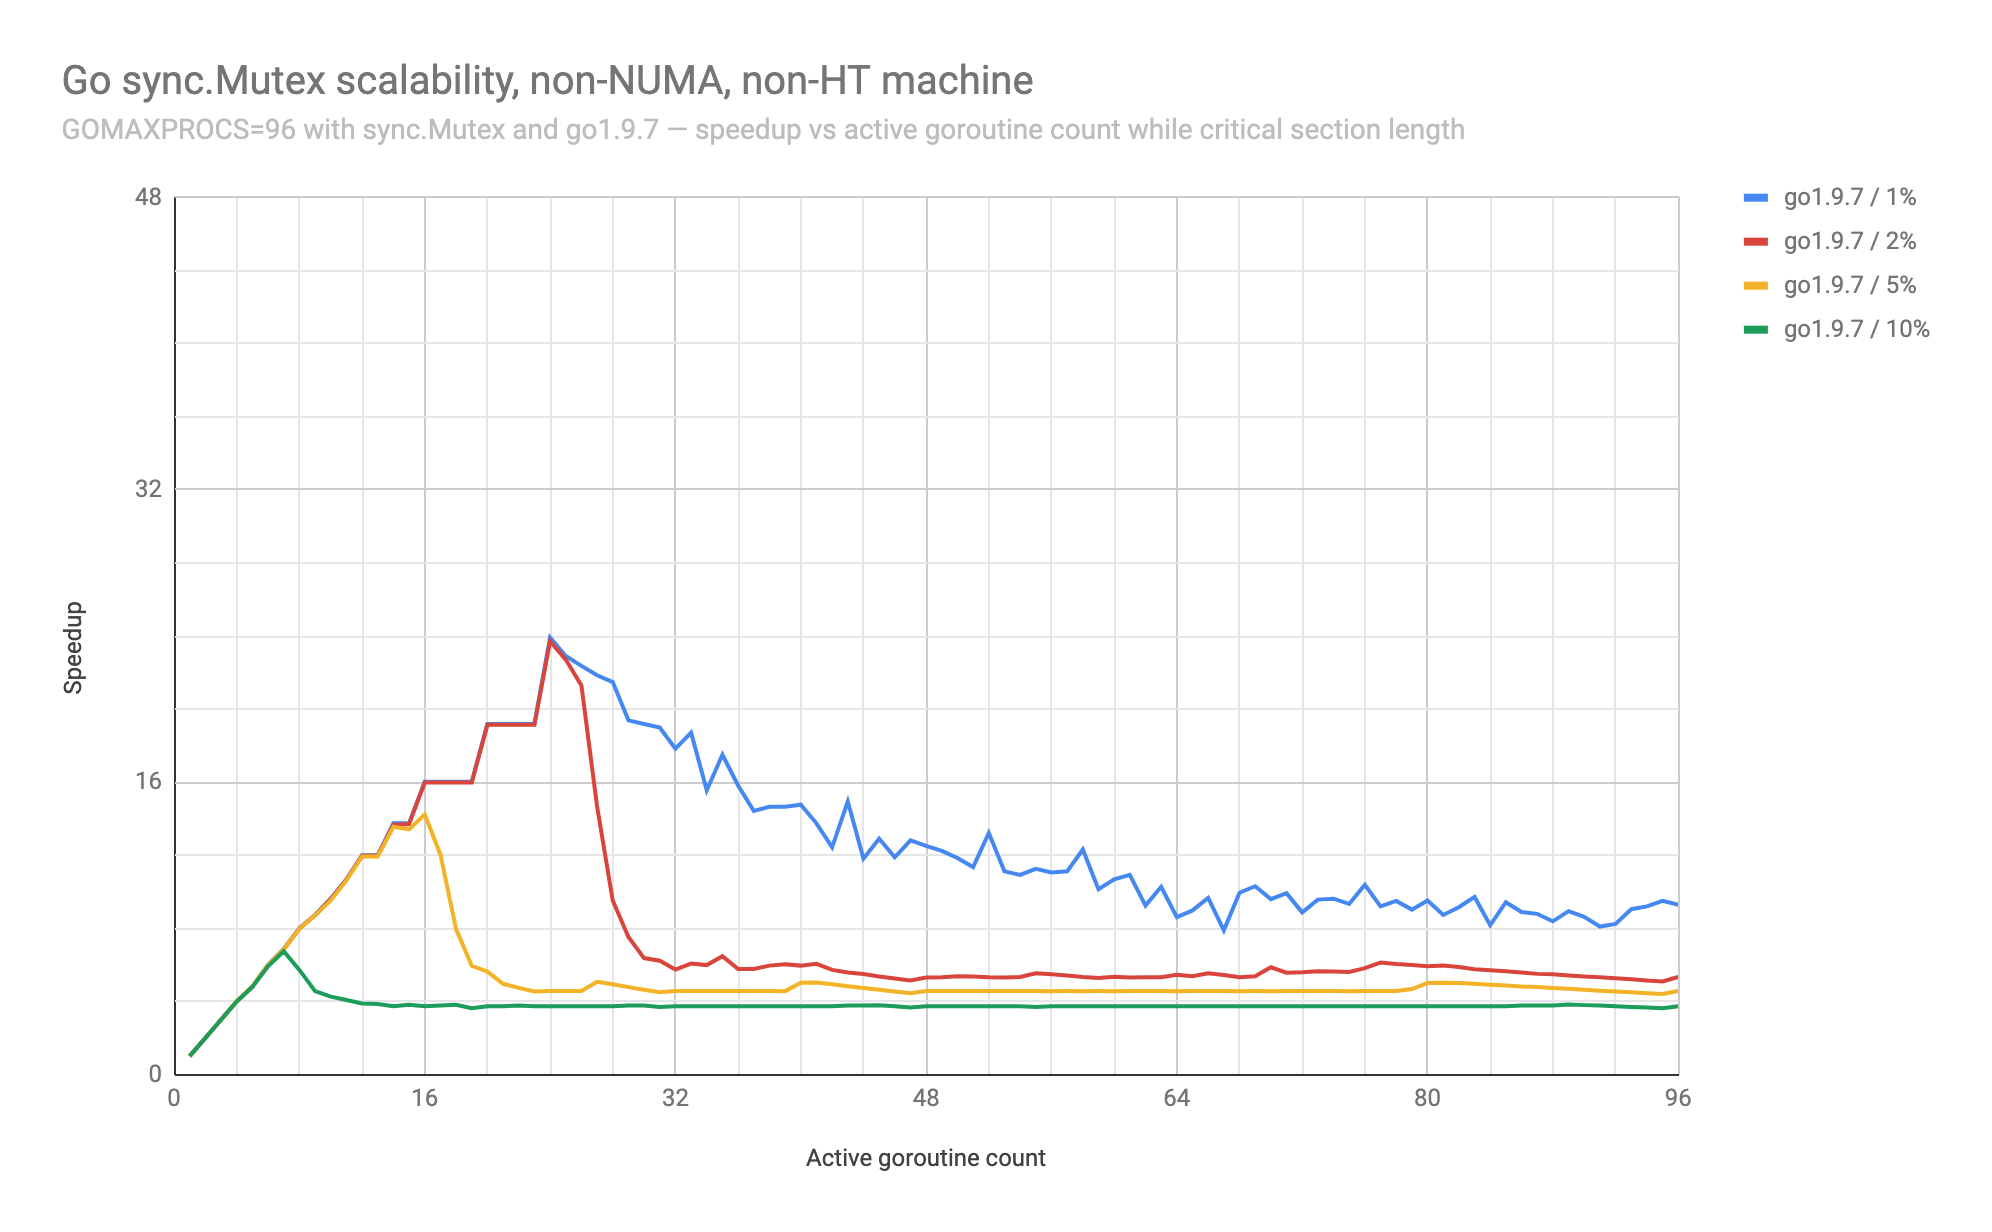
@seebs the point of collapse is based on the tuning of the benchmark (via the -ratio flag). Below is the result of varying that parameter (and the concurrency) while keeping the algorithm and Go version constant (at go1.9.7, before the addition of the execution trace custom annotations, where the collapse is most pronounced).
With 10% of execution taking place in the critical section, the performance gets to about 7x before falling back to 4x. There's no dramatic collapse if it's not preceded by good optimal performance. It's hard to see that with only 8 cores on a laptop.
On a machine with two NUMA nodes, each with 24 physical cores with two hyper-threads each, totaling 96 logical cores (c5.24xlarge):

lstopo output for 96 logical cores
Machine (185GB total)
NUMANode L#0 (P#0 92GB) + Package L#0 + L3 L#0 (36MB)
L2 L#0 (1024KB) + L1d L#0 (32KB) + L1i L#0 (32KB) + Core L#0
PU L#0 (P#0)
PU L#1 (P#48)
L2 L#1 (1024KB) + L1d L#1 (32KB) + L1i L#1 (32KB) + Core L#1
PU L#2 (P#1)
PU L#3 (P#49)
L2 L#2 (1024KB) + L1d L#2 (32KB) + L1i L#2 (32KB) + Core L#2
PU L#4 (P#2)
PU L#5 (P#50)
L2 L#3 (1024KB) + L1d L#3 (32KB) + L1i L#3 (32KB) + Core L#3
PU L#6 (P#3)
PU L#7 (P#51)
L2 L#4 (1024KB) + L1d L#4 (32KB) + L1i L#4 (32KB) + Core L#4
PU L#8 (P#4)
PU L#9 (P#52)
L2 L#5 (1024KB) + L1d L#5 (32KB) + L1i L#5 (32KB) + Core L#5
PU L#10 (P#5)
PU L#11 (P#53)
L2 L#6 (1024KB) + L1d L#6 (32KB) + L1i L#6 (32KB) + Core L#6
PU L#12 (P#6)
PU L#13 (P#54)
L2 L#7 (1024KB) + L1d L#7 (32KB) + L1i L#7 (32KB) + Core L#7
PU L#14 (P#7)
PU L#15 (P#55)
L2 L#8 (1024KB) + L1d L#8 (32KB) + L1i L#8 (32KB) + Core L#8
PU L#16 (P#8)
PU L#17 (P#56)
L2 L#9 (1024KB) + L1d L#9 (32KB) + L1i L#9 (32KB) + Core L#9
PU L#18 (P#9)
PU L#19 (P#57)
L2 L#10 (1024KB) + L1d L#10 (32KB) + L1i L#10 (32KB) + Core L#10
PU L#20 (P#10)
PU L#21 (P#58)
L2 L#11 (1024KB) + L1d L#11 (32KB) + L1i L#11 (32KB) + Core L#11
PU L#22 (P#11)
PU L#23 (P#59)
L2 L#12 (1024KB) + L1d L#12 (32KB) + L1i L#12 (32KB) + Core L#12
PU L#24 (P#12)
PU L#25 (P#60)
L2 L#13 (1024KB) + L1d L#13 (32KB) + L1i L#13 (32KB) + Core L#13
PU L#26 (P#13)
PU L#27 (P#61)
L2 L#14 (1024KB) + L1d L#14 (32KB) + L1i L#14 (32KB) + Core L#14
PU L#28 (P#14)
PU L#29 (P#62)
L2 L#15 (1024KB) + L1d L#15 (32KB) + L1i L#15 (32KB) + Core L#15
PU L#30 (P#15)
PU L#31 (P#63)
L2 L#16 (1024KB) + L1d L#16 (32KB) + L1i L#16 (32KB) + Core L#16
PU L#32 (P#16)
PU L#33 (P#64)
L2 L#17 (1024KB) + L1d L#17 (32KB) + L1i L#17 (32KB) + Core L#17
PU L#34 (P#17)
PU L#35 (P#65)
L2 L#18 (1024KB) + L1d L#18 (32KB) + L1i L#18 (32KB) + Core L#18
PU L#36 (P#18)
PU L#37 (P#66)
L2 L#19 (1024KB) + L1d L#19 (32KB) + L1i L#19 (32KB) + Core L#19
PU L#38 (P#19)
PU L#39 (P#67)
L2 L#20 (1024KB) + L1d L#20 (32KB) + L1i L#20 (32KB) + Core L#20
PU L#40 (P#20)
PU L#41 (P#68)
L2 L#21 (1024KB) + L1d L#21 (32KB) + L1i L#21 (32KB) + Core L#21
PU L#42 (P#21)
PU L#43 (P#69)
L2 L#22 (1024KB) + L1d L#22 (32KB) + L1i L#22 (32KB) + Core L#22
PU L#44 (P#22)
PU L#45 (P#70)
L2 L#23 (1024KB) + L1d L#23 (32KB) + L1i L#23 (32KB) + Core L#23
PU L#46 (P#23)
PU L#47 (P#71)
NUMANode L#1 (P#1 92GB) + Package L#1 + L3 L#1 (36MB)
L2 L#24 (1024KB) + L1d L#24 (32KB) + L1i L#24 (32KB) + Core L#24
PU L#48 (P#24)
PU L#49 (P#72)
L2 L#25 (1024KB) + L1d L#25 (32KB) + L1i L#25 (32KB) + Core L#25
PU L#50 (P#25)
PU L#51 (P#73)
L2 L#26 (1024KB) + L1d L#26 (32KB) + L1i L#26 (32KB) + Core L#26
PU L#52 (P#26)
PU L#53 (P#74)
L2 L#27 (1024KB) + L1d L#27 (32KB) + L1i L#27 (32KB) + Core L#27
PU L#54 (P#27)
PU L#55 (P#75)
L2 L#28 (1024KB) + L1d L#28 (32KB) + L1i L#28 (32KB) + Core L#28
PU L#56 (P#28)
PU L#57 (P#76)
L2 L#29 (1024KB) + L1d L#29 (32KB) + L1i L#29 (32KB) + Core L#29
PU L#58 (P#29)
PU L#59 (P#77)
L2 L#30 (1024KB) + L1d L#30 (32KB) + L1i L#30 (32KB) + Core L#30
PU L#60 (P#30)
PU L#61 (P#78)
L2 L#31 (1024KB) + L1d L#31 (32KB) + L1i L#31 (32KB) + Core L#31
PU L#62 (P#31)
PU L#63 (P#79)
L2 L#32 (1024KB) + L1d L#32 (32KB) + L1i L#32 (32KB) + Core L#32
PU L#64 (P#32)
PU L#65 (P#80)
L2 L#33 (1024KB) + L1d L#33 (32KB) + L1i L#33 (32KB) + Core L#33
PU L#66 (P#33)
PU L#67 (P#81)
L2 L#34 (1024KB) + L1d L#34 (32KB) + L1i L#34 (32KB) + Core L#34
PU L#68 (P#34)
PU L#69 (P#82)
L2 L#35 (1024KB) + L1d L#35 (32KB) + L1i L#35 (32KB) + Core L#35
PU L#70 (P#35)
PU L#71 (P#83)
L2 L#36 (1024KB) + L1d L#36 (32KB) + L1i L#36 (32KB) + Core L#36
PU L#72 (P#36)
PU L#73 (P#84)
L2 L#37 (1024KB) + L1d L#37 (32KB) + L1i L#37 (32KB) + Core L#37
PU L#74 (P#37)
PU L#75 (P#85)
L2 L#38 (1024KB) + L1d L#38 (32KB) + L1i L#38 (32KB) + Core L#38
PU L#76 (P#38)
PU L#77 (P#86)
L2 L#39 (1024KB) + L1d L#39 (32KB) + L1i L#39 (32KB) + Core L#39
PU L#78 (P#39)
PU L#79 (P#87)
L2 L#40 (1024KB) + L1d L#40 (32KB) + L1i L#40 (32KB) + Core L#40
PU L#80 (P#40)
PU L#81 (P#88)
L2 L#41 (1024KB) + L1d L#41 (32KB) + L1i L#41 (32KB) + Core L#41
PU L#82 (P#41)
PU L#83 (P#89)
L2 L#42 (1024KB) + L1d L#42 (32KB) + L1i L#42 (32KB) + Core L#42
PU L#84 (P#42)
PU L#85 (P#90)
L2 L#43 (1024KB) + L1d L#43 (32KB) + L1i L#43 (32KB) + Core L#43
PU L#86 (P#43)
PU L#87 (P#91)
L2 L#44 (1024KB) + L1d L#44 (32KB) + L1i L#44 (32KB) + Core L#44
PU L#88 (P#44)
PU L#89 (P#92)
L2 L#45 (1024KB) + L1d L#45 (32KB) + L1i L#45 (32KB) + Core L#45
PU L#90 (P#45)
PU L#91 (P#93)
L2 L#46 (1024KB) + L1d L#46 (32KB) + L1i L#46 (32KB) + Core L#46
PU L#92 (P#46)
PU L#93 (P#94)
L2 L#47 (1024KB) + L1d L#47 (32KB) + L1i L#47 (32KB) + Core L#47
PU L#94 (P#47)
PU L#95 (P#95)
On a machine with one NUMA node, with 24 physical cores with two hyper-threads each, totaling 48 logical cores (c5.12xlarge):

lstopo output for 48 logical cores
Machine (92GB) + Package L#0 + L3 L#0 (36MB)
L2 L#0 (1024KB) + L1d L#0 (32KB) + L1i L#0 (32KB) + Core L#0
PU L#0 (P#0)
PU L#1 (P#24)
L2 L#1 (1024KB) + L1d L#1 (32KB) + L1i L#1 (32KB) + Core L#1
PU L#2 (P#1)
PU L#3 (P#25)
L2 L#2 (1024KB) + L1d L#2 (32KB) + L1i L#2 (32KB) + Core L#2
PU L#4 (P#2)
PU L#5 (P#26)
L2 L#3 (1024KB) + L1d L#3 (32KB) + L1i L#3 (32KB) + Core L#3
PU L#6 (P#3)
PU L#7 (P#27)
L2 L#4 (1024KB) + L1d L#4 (32KB) + L1i L#4 (32KB) + Core L#4
PU L#8 (P#4)
PU L#9 (P#28)
L2 L#5 (1024KB) + L1d L#5 (32KB) + L1i L#5 (32KB) + Core L#5
PU L#10 (P#5)
PU L#11 (P#29)
L2 L#6 (1024KB) + L1d L#6 (32KB) + L1i L#6 (32KB) + Core L#6
PU L#12 (P#6)
PU L#13 (P#30)
L2 L#7 (1024KB) + L1d L#7 (32KB) + L1i L#7 (32KB) + Core L#7
PU L#14 (P#7)
PU L#15 (P#31)
L2 L#8 (1024KB) + L1d L#8 (32KB) + L1i L#8 (32KB) + Core L#8
PU L#16 (P#8)
PU L#17 (P#32)
L2 L#9 (1024KB) + L1d L#9 (32KB) + L1i L#9 (32KB) + Core L#9
PU L#18 (P#9)
PU L#19 (P#33)
L2 L#10 (1024KB) + L1d L#10 (32KB) + L1i L#10 (32KB) + Core L#10
PU L#20 (P#10)
PU L#21 (P#34)
L2 L#11 (1024KB) + L1d L#11 (32KB) + L1i L#11 (32KB) + Core L#11
PU L#22 (P#11)
PU L#23 (P#35)
L2 L#12 (1024KB) + L1d L#12 (32KB) + L1i L#12 (32KB) + Core L#12
PU L#24 (P#12)
PU L#25 (P#36)
L2 L#13 (1024KB) + L1d L#13 (32KB) + L1i L#13 (32KB) + Core L#13
PU L#26 (P#13)
PU L#27 (P#37)
L2 L#14 (1024KB) + L1d L#14 (32KB) + L1i L#14 (32KB) + Core L#14
PU L#28 (P#14)
PU L#29 (P#38)
L2 L#15 (1024KB) + L1d L#15 (32KB) + L1i L#15 (32KB) + Core L#15
PU L#30 (P#15)
PU L#31 (P#39)
L2 L#16 (1024KB) + L1d L#16 (32KB) + L1i L#16 (32KB) + Core L#16
PU L#32 (P#16)
PU L#33 (P#40)
L2 L#17 (1024KB) + L1d L#17 (32KB) + L1i L#17 (32KB) + Core L#17
PU L#34 (P#17)
PU L#35 (P#41)
L2 L#18 (1024KB) + L1d L#18 (32KB) + L1i L#18 (32KB) + Core L#18
PU L#36 (P#18)
PU L#37 (P#42)
L2 L#19 (1024KB) + L1d L#19 (32KB) + L1i L#19 (32KB) + Core L#19
PU L#38 (P#19)
PU L#39 (P#43)
L2 L#20 (1024KB) + L1d L#20 (32KB) + L1i L#20 (32KB) + Core L#20
PU L#40 (P#20)
PU L#41 (P#44)
L2 L#21 (1024KB) + L1d L#21 (32KB) + L1i L#21 (32KB) + Core L#21
PU L#42 (P#21)
PU L#43 (P#45)
L2 L#22 (1024KB) + L1d L#22 (32KB) + L1i L#22 (32KB) + Core L#22
PU L#44 (P#22)
PU L#45 (P#46)
L2 L#23 (1024KB) + L1d L#23 (32KB) + L1i L#23 (32KB) + Core L#23
PU L#46 (P#23)
PU L#47 (P#47)
On a machine with one NUMA node, with 24 physical cores and hyper-threads disabled, totaling 24 logical cores (c5.12xlarge with HT disabled):
lstopo output for 24 physical cores
Machine (92GB) + Package L#0 + L3 L#0 (36MB)
L2 L#0 (1024KB) + L1d L#0 (32KB) + L1i L#0 (32KB) + Core L#0 + PU L#0 (P#0)
L2 L#1 (1024KB) + L1d L#1 (32KB) + L1i L#1 (32KB) + Core L#1 + PU L#1 (P#1)
L2 L#2 (1024KB) + L1d L#2 (32KB) + L1i L#2 (32KB) + Core L#2 + PU L#2 (P#2)
L2 L#3 (1024KB) + L1d L#3 (32KB) + L1i L#3 (32KB) + Core L#3 + PU L#3 (P#3)
L2 L#4 (1024KB) + L1d L#4 (32KB) + L1i L#4 (32KB) + Core L#4 + PU L#4 (P#4)
L2 L#5 (1024KB) + L1d L#5 (32KB) + L1i L#5 (32KB) + Core L#5 + PU L#5 (P#5)
L2 L#6 (1024KB) + L1d L#6 (32KB) + L1i L#6 (32KB) + Core L#6 + PU L#6 (P#6)
L2 L#7 (1024KB) + L1d L#7 (32KB) + L1i L#7 (32KB) + Core L#7 + PU L#7 (P#7)
L2 L#8 (1024KB) + L1d L#8 (32KB) + L1i L#8 (32KB) + Core L#8 + PU L#8 (P#8)
L2 L#9 (1024KB) + L1d L#9 (32KB) + L1i L#9 (32KB) + Core L#9 + PU L#9 (P#9)
L2 L#10 (1024KB) + L1d L#10 (32KB) + L1i L#10 (32KB) + Core L#10 + PU L#10 (P#10)
L2 L#11 (1024KB) + L1d L#11 (32KB) + L1i L#11 (32KB) + Core L#11 + PU L#11 (P#11)
L2 L#12 (1024KB) + L1d L#12 (32KB) + L1i L#12 (32KB) + Core L#12 + PU L#12 (P#12)
L2 L#13 (1024KB) + L1d L#13 (32KB) + L1i L#13 (32KB) + Core L#13 + PU L#13 (P#13)
L2 L#14 (1024KB) + L1d L#14 (32KB) + L1i L#14 (32KB) + Core L#14 + PU L#14 (P#14)
L2 L#15 (1024KB) + L1d L#15 (32KB) + L1i L#15 (32KB) + Core L#15 + PU L#15 (P#15)
L2 L#16 (1024KB) + L1d L#16 (32KB) + L1i L#16 (32KB) + Core L#16 + PU L#16 (P#16)
L2 L#17 (1024KB) + L1d L#17 (32KB) + L1i L#17 (32KB) + Core L#17 + PU L#17 (P#17)
L2 L#18 (1024KB) + L1d L#18 (32KB) + L1i L#18 (32KB) + Core L#18 + PU L#18 (P#18)
L2 L#19 (1024KB) + L1d L#19 (32KB) + L1i L#19 (32KB) + Core L#19 + PU L#19 (P#19)
L2 L#20 (1024KB) + L1d L#20 (32KB) + L1i L#20 (32KB) + Core L#20 + PU L#20 (P#20)
L2 L#21 (1024KB) + L1d L#21 (32KB) + L1i L#21 (32KB) + Core L#21 + PU L#21 (P#21)
L2 L#22 (1024KB) + L1d L#22 (32KB) + L1i L#22 (32KB) + Core L#22 + PU L#22 (P#22)
L2 L#23 (1024KB) + L1d L#23 (32KB) + L1i L#23 (32KB) + Core L#23 + PU L#23 (P#23)
Huh, that's interesting. I think I was expecting that the collapse would look something like going to half the previous performance or lower, but actually, it looks like it's pretty steady at dropping to about 4-6x performance. So if your hardware really only got 4-6x in the first place, it doesn't look like much of anything happening. I do see a noticeable difference between Gosched and non-GoSched performance at higher ratios, but it's never particularly large; it might be 10% at most.
I think I was assuming that, on the smaller machine, performance would collapse to something more like 1x-2x, but it doesn't seem to.
seebs
on 22 Aug 2019
Change https://golang.org/cl/200577 mentions this issue: sync: yield to the waiter when unlocking a starving mutex
 gopherbot
on 11 Oct 2019
gopherbot
on 11 Oct 2019
@rhysh would you be able to test https://golang.org/cl/200577 and see if it improves things for you as welll?
CAFxX
on 16 Oct 2019
Thanks @CAFxX , CL 200577 at PS 7 looks like it fixes the collapse.
I re-ran the benchmark with the current tip (f6c624a22a / go version devel +f6c624a22a Wed Oct 16 15:58:33 2019 +0000), and at that same commit with CL 200577 at PS 7 cherry-picked on top. Without the change, the benchmark's performance collapses as it has since Go 1.9. With the change, increasing concurrency doesn't cause that fast collapse.
The code looks well focused to the problem, and the results LGTM. Thanks again!
Folks with +2 votes / release discretion: are there blockers or risks that would keep this out of Go 1.14?

benchstat
name                                                           old time/op  new time/op  delta
Lock/sync.Mutex/cost=1000,ratio=0.010,concurrency=1/basic-96    354µs ± 0%   356µs ± 1%   +0.64%  (p=0.000 n=9+10)
Lock/sync.Mutex/cost=1000,ratio=0.010,concurrency=2/basic-96    178µs ± 1%   180µs ± 1%   +0.66%  (p=0.015 n=10+10)
Lock/sync.Mutex/cost=1000,ratio=0.010,concurrency=3/basic-96    121µs ± 1%   122µs ± 1%     ~     (p=0.203 n=8+10)
Lock/sync.Mutex/cost=1000,ratio=0.010,concurrency=4/basic-96   92.3µs ± 2%  92.4µs ± 1%     ~     (p=0.529 n=10+10)
Lock/sync.Mutex/cost=1000,ratio=0.010,concurrency=5/basic-96   75.1µs ± 2%  75.8µs ± 3%     ~     (p=0.247 n=10+10)
Lock/sync.Mutex/cost=1000,ratio=0.010,concurrency=6/basic-96   63.0µs ± 2%  63.1µs ± 2%     ~     (p=0.912 n=10+10)
Lock/sync.Mutex/cost=1000,ratio=0.010,concurrency=7/basic-96   54.1µs ± 0%  54.1µs ± 1%     ~     (p=0.758 n=7+9)
Lock/sync.Mutex/cost=1000,ratio=0.010,concurrency=8/basic-96   47.4µs ± 0%  47.9µs ± 2%   +1.04%  (p=0.027 n=8+10)
Lock/sync.Mutex/cost=1000,ratio=0.010,concurrency=9/basic-96   42.4µs ± 0%  42.7µs ± 1%   +0.65%  (p=0.000 n=9+9)
Lock/sync.Mutex/cost=1000,ratio=0.010,concurrency=10/basic-96  38.5µs ± 1%  38.6µs ± 1%     ~     (p=0.139 n=9+8)
Lock/sync.Mutex/cost=1000,ratio=0.010,concurrency=11/basic-96  35.2µs ± 3%  35.2µs ± 1%     ~     (p=0.579 n=10+10)
Lock/sync.Mutex/cost=1000,ratio=0.010,concurrency=12/basic-96  32.4µs ± 3%  32.1µs ± 2%     ~     (p=0.436 n=10+10)
Lock/sync.Mutex/cost=1000,ratio=0.010,concurrency=13/basic-96  30.2µs ± 2%  30.0µs ± 2%     ~     (p=0.353 n=10+10)
Lock/sync.Mutex/cost=1000,ratio=0.010,concurrency=14/basic-96  27.7µs ± 0%  27.9µs ± 1%   +0.67%  (p=0.000 n=7+9)
Lock/sync.Mutex/cost=1000,ratio=0.010,concurrency=15/basic-96  26.0µs ± 2%  26.1µs ± 3%     ~     (p=0.325 n=10+10)
Lock/sync.Mutex/cost=1000,ratio=0.010,concurrency=16/basic-96  24.7µs ± 0%  24.3µs ± 3%     ~     (p=0.573 n=8+10)
Lock/sync.Mutex/cost=1000,ratio=0.010,concurrency=17/basic-96  23.0µs ± 3%  22.9µs ± 1%     ~     (p=0.156 n=10+9)
Lock/sync.Mutex/cost=1000,ratio=0.010,concurrency=18/basic-96  22.2µs ± 4%  22.1µs ± 3%     ~     (p=0.631 n=10+10)
Lock/sync.Mutex/cost=1000,ratio=0.010,concurrency=19/basic-96  20.8µs ± 0%  20.9µs ± 1%   +0.50%  (p=0.001 n=8+10)
Lock/sync.Mutex/cost=1000,ratio=0.010,concurrency=20/basic-96  20.0µs ± 3%  20.1µs ± 2%     ~     (p=0.436 n=10+10)
Lock/sync.Mutex/cost=1000,ratio=0.010,concurrency=21/basic-96  19.1µs ± 2%  18.9µs ± 0%     ~     (p=0.535 n=10+9)
Lock/sync.Mutex/cost=1000,ratio=0.010,concurrency=22/basic-96  18.1µs ± 2%  18.0µs ± 2%     ~     (p=0.863 n=9+9)
Lock/sync.Mutex/cost=1000,ratio=0.010,concurrency=23/basic-96  17.6µs ± 2%  17.2µs ± 1%   -2.37%  (p=0.000 n=8+9)
Lock/sync.Mutex/cost=1000,ratio=0.010,concurrency=24/basic-96  17.2µs ± 6%  16.6µs ± 4%   -3.56%  (p=0.013 n=9+10)
Lock/sync.Mutex/cost=1000,ratio=0.010,concurrency=25/basic-96  16.3µs ± 3%  16.1µs ± 2%   -1.72%  (p=0.028 n=10+10)
Lock/sync.Mutex/cost=1000,ratio=0.010,concurrency=26/basic-96  15.6µs ± 7%  15.5µs ± 5%     ~     (p=0.796 n=10+9)
Lock/sync.Mutex/cost=1000,ratio=0.010,concurrency=27/basic-96  15.4µs ± 6%  15.0µs ± 1%   -2.17%  (p=0.021 n=9+8)
Lock/sync.Mutex/cost=1000,ratio=0.010,concurrency=28/basic-96  15.6µs ± 7%  14.1µs ± 1%   -9.71%  (p=0.000 n=8+10)
Lock/sync.Mutex/cost=1000,ratio=0.010,concurrency=29/basic-96  15.0µs ±12%  14.0µs ± 0%   -6.87%  (p=0.000 n=10+8)
Lock/sync.Mutex/cost=1000,ratio=0.010,concurrency=30/basic-96  14.4µs ± 6%  13.7µs ±11%   -5.24%  (p=0.023 n=10+10)
Lock/sync.Mutex/cost=1000,ratio=0.010,concurrency=31/basic-96  14.8µs ±13%  13.7µs ±11%   -7.37%  (p=0.023 n=10+10)
Lock/sync.Mutex/cost=1000,ratio=0.010,concurrency=32/basic-96  13.8µs ± 7%  13.0µs ± 2%   -5.34%  (p=0.002 n=9+8)
Lock/sync.Mutex/cost=1000,ratio=0.010,concurrency=33/basic-96  14.5µs ±10%  12.3µs ± 4%  -15.12%  (p=0.000 n=10+10)
Lock/sync.Mutex/cost=1000,ratio=0.010,concurrency=34/basic-96  17.0µs ±33%  12.2µs ± 2%  -28.46%  (p=0.000 n=10+10)
Lock/sync.Mutex/cost=1000,ratio=0.010,concurrency=35/basic-96  17.2µs ±44%  11.6µs ± 6%  -33.00%  (p=0.000 n=10+10)
Lock/sync.Mutex/cost=1000,ratio=0.010,concurrency=36/basic-96  20.2µs ±27%  11.4µs ± 7%  -43.38%  (p=0.000 n=8+10)
Lock/sync.Mutex/cost=1000,ratio=0.010,concurrency=37/basic-96  23.0µs ±49%  11.1µs ± 1%  -51.51%  (p=0.000 n=9+10)
Lock/sync.Mutex/cost=1000,ratio=0.010,concurrency=38/basic-96  39.1µs ±57%  11.1µs ± 2%  -71.58%  (p=0.000 n=10+10)
Lock/sync.Mutex/cost=1000,ratio=0.010,concurrency=39/basic-96  39.5µs ±21%  10.7µs ± 6%  -72.88%  (p=0.000 n=9+10)
Lock/sync.Mutex/cost=1000,ratio=0.010,concurrency=40/basic-96  52.3µs ±40%  10.5µs ± 4%  -79.84%  (p=0.000 n=10+9)
Lock/sync.Mutex/cost=1000,ratio=0.010,concurrency=41/basic-96  57.8µs ±25%  10.2µs ± 2%  -82.28%  (p=0.000 n=10+9)
Lock/sync.Mutex/cost=1000,ratio=0.010,concurrency=42/basic-96  61.4µs ±19%  10.5µs ± 4%  -82.91%  (p=0.000 n=10+9)
Lock/sync.Mutex/cost=1000,ratio=0.010,concurrency=43/basic-96  61.0µs ±26%   9.5µs ± 5%  -84.44%  (p=0.000 n=10+10)
Lock/sync.Mutex/cost=1000,ratio=0.010,concurrency=44/basic-96  66.2µs ± 6%   9.6µs ±15%  -85.42%  (p=0.000 n=9+9)
Lock/sync.Mutex/cost=1000,ratio=0.010,concurrency=45/basic-96  66.8µs ± 4%  10.7µs ±11%  -84.00%  (p=0.000 n=9+10)
Lock/sync.Mutex/cost=1000,ratio=0.010,concurrency=46/basic-96  64.9µs ± 5%   9.9µs ± 6%  -84.74%  (p=0.000 n=10+10)
Lock/sync.Mutex/cost=1000,ratio=0.010,concurrency=47/basic-96  66.4µs ±12%  10.1µs ± 8%  -84.73%  (p=0.000 n=10+10)
Lock/sync.Mutex/cost=1000,ratio=0.010,concurrency=48/basic-96  66.3µs ±11%  10.0µs ± 9%  -84.89%  (p=0.000 n=10+10)
Lock/sync.Mutex/cost=1000,ratio=0.010,concurrency=49/basic-96  67.8µs ± 5%  10.1µs ±10%  -85.14%  (p=0.000 n=10+10)
Lock/sync.Mutex/cost=1000,ratio=0.010,concurrency=50/basic-96  67.4µs ± 5%  10.1µs ± 6%  -85.05%  (p=0.000 n=9+9)
Lock/sync.Mutex/cost=1000,ratio=0.010,concurrency=51/basic-96  66.9µs ± 6%   9.9µs ± 5%  -85.19%  (p=0.000 n=10+10)
Lock/sync.Mutex/cost=1000,ratio=0.010,concurrency=52/basic-96  67.9µs ± 4%  10.1µs ± 3%  -85.15%  (p=0.000 n=9+10)
Lock/sync.Mutex/cost=1000,ratio=0.010,concurrency=53/basic-96  67.2µs ± 5%  11.3µs ±10%  -83.10%  (p=0.000 n=10+10)
Lock/sync.Mutex/cost=1000,ratio=0.010,concurrency=54/basic-96  67.4µs ± 5%  11.0µs ±15%  -83.70%  (p=0.000 n=10+10)
Lock/sync.Mutex/cost=1000,ratio=0.010,concurrency=55/basic-96  65.5µs ± 7%  10.0µs ± 2%  -84.77%  (p=0.000 n=10+9)
Lock/sync.Mutex/cost=1000,ratio=0.010,concurrency=56/basic-96  67.1µs ± 8%  11.6µs ±11%  -82.66%  (p=0.000 n=10+10)
Lock/sync.Mutex/cost=1000,ratio=0.010,concurrency=57/basic-96  68.6µs ± 4%  11.8µs ± 7%  -82.80%  (p=0.000 n=10+10)
Lock/sync.Mutex/cost=1000,ratio=0.010,concurrency=58/basic-96  68.1µs ± 5%  10.5µs ± 7%  -84.57%  (p=0.000 n=10+10)
Lock/sync.Mutex/cost=1000,ratio=0.010,concurrency=59/basic-96  68.1µs ± 6%  10.9µs ± 9%  -83.95%  (p=0.000 n=10+10)
Lock/sync.Mutex/cost=1000,ratio=0.010,concurrency=60/basic-96  66.3µs ± 6%  13.4µs ± 3%  -79.77%  (p=0.000 n=10+9)
Lock/sync.Mutex/cost=1000,ratio=0.010,concurrency=61/basic-96  66.0µs ± 8%  12.7µs ±13%  -80.76%  (p=0.000 n=10+10)
Lock/sync.Mutex/cost=1000,ratio=0.010,concurrency=62/basic-96  66.1µs ± 5%  13.0µs ± 7%  -80.35%  (p=0.000 n=10+10)
Lock/sync.Mutex/cost=1000,ratio=0.010,concurrency=63/basic-96  67.5µs ± 5%  13.1µs ± 9%  -80.56%  (p=0.000 n=10+10)
Lock/sync.Mutex/cost=1000,ratio=0.010,concurrency=64/basic-96  68.0µs ± 5%  12.1µs ± 4%  -82.15%  (p=0.000 n=10+9)
Lock/sync.Mutex/cost=1000,ratio=0.010,concurrency=65/basic-96  67.4µs ± 8%  12.2µs ± 7%  -81.87%  (p=0.000 n=10+10)
Lock/sync.Mutex/cost=1000,ratio=0.010,concurrency=66/basic-96  68.5µs ± 4%  11.7µs ± 6%  -82.95%  (p=0.000 n=10+10)
Lock/sync.Mutex/cost=1000,ratio=0.010,concurrency=67/basic-96  67.3µs ± 7%  11.9µs ± 8%  -82.38%  (p=0.000 n=9+10)
Lock/sync.Mutex/cost=1000,ratio=0.010,concurrency=68/basic-96  67.7µs ± 6%  11.5µs ±10%  -82.97%  (p=0.000 n=10+10)
Lock/sync.Mutex/cost=1000,ratio=0.010,concurrency=69/basic-96  68.1µs ± 4%  10.8µs ± 9%  -84.16%  (p=0.000 n=9+10)
Lock/sync.Mutex/cost=1000,ratio=0.010,concurrency=70/basic-96  67.2µs ± 4%  10.5µs ± 5%  -84.43%  (p=0.000 n=10+10)
Lock/sync.Mutex/cost=1000,ratio=0.010,concurrency=71/basic-96  67.2µs ± 5%  11.0µs ± 9%  -83.70%  (p=0.000 n=10+10)
Lock/sync.Mutex/cost=1000,ratio=0.010,concurrency=72/basic-96  68.2µs ± 4%  11.9µs ± 9%  -82.62%  (p=0.000 n=10+9)
Lock/sync.Mutex/cost=1000,ratio=0.010,concurrency=73/basic-96  66.4µs ± 7%  11.2µs ±11%  -83.08%  (p=0.000 n=10+10)
Lock/sync.Mutex/cost=1000,ratio=0.010,concurrency=74/basic-96  67.7µs ± 6%  10.9µs ± 6%  -83.93%  (p=0.000 n=10+10)
Lock/sync.Mutex/cost=1000,ratio=0.010,concurrency=75/basic-96  67.5µs ± 6%  11.6µs ± 7%  -82.86%  (p=0.000 n=10+10)
Lock/sync.Mutex/cost=1000,ratio=0.010,concurrency=76/basic-96  69.8µs ± 3%  12.6µs ± 5%  -81.93%  (p=0.000 n=10+9)
Lock/sync.Mutex/cost=1000,ratio=0.010,concurrency=77/basic-96  69.0µs ± 5%  11.7µs ± 9%  -83.07%  (p=0.000 n=10+10)
Lock/sync.Mutex/cost=1000,ratio=0.010,concurrency=78/basic-96  68.5µs ± 3%  11.1µs ± 6%  -83.83%  (p=0.000 n=10+9)
Lock/sync.Mutex/cost=1000,ratio=0.010,concurrency=79/basic-96  68.6µs ± 5%  10.5µs ± 8%  -84.65%  (p=0.000 n=10+10)
Lock/sync.Mutex/cost=1000,ratio=0.010,concurrency=80/basic-96  68.8µs ± 7%  11.0µs ±13%  -83.95%  (p=0.000 n=10+10)
Lock/sync.Mutex/cost=1000,ratio=0.010,concurrency=81/basic-96  66.8µs ± 5%  10.7µs ± 6%  -84.01%  (p=0.000 n=10+10)
Lock/sync.Mutex/cost=1000,ratio=0.010,concurrency=82/basic-96  69.2µs ± 7%  11.1µs ± 9%  -83.90%  (p=0.000 n=10+10)
Lock/sync.Mutex/cost=1000,ratio=0.010,concurrency=83/basic-96  67.0µs ± 6%  11.4µs ±12%  -83.05%  (p=0.000 n=10+10)
Lock/sync.Mutex/cost=1000,ratio=0.010,concurrency=84/basic-96  67.1µs ± 5%  10.8µs ± 7%  -83.90%  (p=0.000 n=10+10)
Lock/sync.Mutex/cost=1000,ratio=0.010,concurrency=85/basic-96  67.9µs ± 7%  10.8µs ± 9%  -84.13%  (p=0.000 n=10+10)
Lock/sync.Mutex/cost=1000,ratio=0.010,concurrency=86/basic-96  66.9µs ± 5%  10.7µs ± 5%  -84.08%  (p=0.000 n=10+10)
Lock/sync.Mutex/cost=1000,ratio=0.010,concurrency=87/basic-96  69.3µs ± 3%  10.6µs ± 4%  -84.70%  (p=0.000 n=9+9)
Lock/sync.Mutex/cost=1000,ratio=0.010,concurrency=88/basic-96  67.5µs ± 7%  11.0µs ± 6%  -83.72%  (p=0.000 n=10+10)
Lock/sync.Mutex/cost=1000,ratio=0.010,concurrency=89/basic-96  66.6µs ± 6%  11.5µs ± 9%  -82.76%  (p=0.000 n=10+10)
Lock/sync.Mutex/cost=1000,ratio=0.010,concurrency=90/basic-96  67.4µs ± 6%  11.1µs ± 6%  -83.55%  (p=0.000 n=9+10)
Lock/sync.Mutex/cost=1000,ratio=0.010,concurrency=91/basic-96  68.4µs ± 4%  11.1µs ± 5%  -83.80%  (p=0.000 n=10+10)
Lock/sync.Mutex/cost=1000,ratio=0.010,concurrency=92/basic-96  66.8µs ± 3%  10.9µs ± 4%  -83.74%  (p=0.000 n=9+10)
Lock/sync.Mutex/cost=1000,ratio=0.010,concurrency=93/basic-96  68.1µs ± 2%  10.9µs ± 4%  -83.95%  (p=0.000 n=7+9)
Lock/sync.Mutex/cost=1000,ratio=0.010,concurrency=94/basic-96  66.5µs ± 6%  11.0µs ± 2%  -83.45%  (p=0.000 n=10+10)
Lock/sync.Mutex/cost=1000,ratio=0.010,concurrency=95/basic-96  67.6µs ± 5%  11.1µs ± 1%  -83.62%  (p=0.000 n=10+10)
Lock/sync.Mutex/cost=1000,ratio=0.010,concurrency=96/basic-96  68.9µs ± 5%  10.5µs ± 3%  -84.83%  (p=0.000 n=10+10)
rhysh
on 16 Oct 2019
Thanks @rhysh for the confirmation!
are there blockers or risks that would keep this out of Go 1.14?
We haven't given this a run through the builders yet, but I'm hopeful.
CAFxX
on 17 Oct 2019
Change https://golang.org/cl/205817 mentions this issue: Revert "sync: yield to the waiter when unlocking a starving mutex"
gopherbot
on 7 Nov 2019
Should this be re-opened given that the change was reverted?
 jonhoo
on 7 Nov 2019
jonhoo
on 7 Nov 2019
The revert is not merged yet, but yes, it should be re-opened.
bcmills
on 7 Nov 2019
All the failures I've looked at in detail come from sync.(*Pool).pinSlow, which calls sync.(*Mutex).Unlock after calling sync.runtime_procPin, which increments getg().m.locks.
I have a linux / arm64 machine for testing, but it only occasionally reproduces the failure (with go test -count=1 net/http under https://godoc.org/golang.org/x/tools/cmd/stress). I've gotten 11 failures out of 1320 runs with that. Is there something special about the builder setups that helps them to reproduce the problem more often?
After adding a check of getg().m.locks to semrelease1, I've gotten 0 failures on the AArch64 machine out of 1305 runs. I've pointed out the line on the CL.
rhysh
on 8 Nov 2019
Change https://golang.org/cl/206180 mentions this issue: sync: yield to the waiter when unlocking a starving mutex
gopherbot
on 8 Nov 2019
Related issues
gopherbot
·
3Comments
 bbodenmiller
·
3Comments
bbodenmiller
·
3Comments
 dominikh
·
3Comments
dominikh
·
3Comments
 bradfitz
·
3Comments
bradfitz
·
3Comments
 OneOfOne
·
3Comments
OneOfOne
·
3Comments
Most helpful comment
Thanks @CAFxX , CL 200577 at PS 7 looks like it fixes the collapse.
I re-ran the benchmark with the current tip (f6c624a22a /
go version devel +f6c624a22a Wed Oct 16 15:58:33 2019 +0000), and at that same commit with CL 200577 at PS 7 cherry-picked on top. Without the change, the benchmark's performance collapses as it has since Go 1.9. With the change, increasing concurrency doesn't cause that fast collapse.The code looks well focused to the problem, and the results LGTM. Thanks again!
Folks with +2 votes / release discretion: are there blockers or risks that would keep this out of Go 1.14?
benchstat