What version of Go are you using (go version)?
$ go version
go version devel +a10b4cff91 Sun Feb 17 04:46:20 2019 +0000 windows/amd64
Does this issue reproduce with the latest release?
Yes
What operating system and processor architecture are you using (go env)?
go env Output
$ go env

set GOARCH=amd64

set GOBIN=

set GOCACHE=C:\Users\mattn\AppData\Local\go-build

set GOEXE=.exe

set GOFLAGS=

set GOHOSTARCH=amd64

set GOHOSTOS=windows

set GOOS=windows

set GOPATH=C:\Users\mattn\go

set GOPROXY=

set GORACE=

set GOROOT=C:\go

set GOTMPDIR=

set GOTOOLDIR=C:\go\pkg\tool\windows_amd64

set GCCGO=gccgo

set CC=gcc

set CXX=g++

set CGO_ENABLED=1

set GOMOD=

set CGO_CFLAGS=-g -O2

set CGO_CPPFLAGS=

set CGO_CXXFLAGS=-g -O2

set CGO_FFLAGS=-g -O2

set CGO_LDFLAGS=-g -O2

set PKG_CONFIG=pkg-config

set GOGCCFLAGS=-m64 -mthreads -fmessage-length=0 -fdebug-prefix-map=C:\Users\mattn\AppData\Local\Temp\go-build232338458=/tmp/go-build -gno-record-gcc-switches
What did you do?
Install gopls from latest x/tools/cmd/gopls, open daemon.go with vim-lsp.
And send textDocument/completion request from vim-lsp.
What did you expect to see?
In my personal experience, I thought gopls take about 500-800MB memory usage.
What did you see instead?
gopls take 3.5 GB memory usage.

 mattn
mattn
All 68 comments
I second this.
Whilst using gopls, I notice a steady increase of memory until it OOMs my system (which has 30GiB spare). I've been using gopls on the go compiler itself, and on the x/tools repository. I regularly have to kill gopls to prevent it from using too much RAM.
 pwaller
on 19 Feb 2019
pwaller
on 19 Feb 2019
CC @stamblerre @ianthehat
 bcmills
on 28 Feb 2019
bcmills
on 28 Feb 2019
We are currently working on a number of improvements to gopls, particularly caching, which should solve a lot of these issues. As of right now, gopls calls go/packages.Load on every keystroke, which is likely why it requires so much memory. There should be updates on this soon.
 stamblerre
on 28 Feb 2019
stamblerre
on 28 Feb 2019
Change https://golang.org/cl/164779 mentions this issue: internal/lsp: handle initializationOptions
 gopherbot
on 3 Mar 2019
gopherbot
on 3 Mar 2019
Change https://golang.org/cl/165438 mentions this issue: internal/lsp: add cache for type information
gopherbot
on 6 Mar 2019
I'm trying latest master branch with same file.

memory usage is improved considerably. And completion seems to be faster.
mattn
on 11 Mar 2019
Closing for now, we can reopen as needed.
stamblerre
on 12 Mar 2019
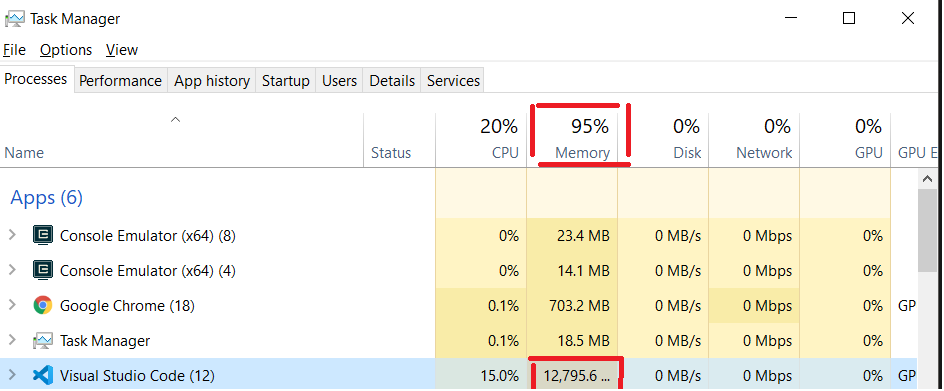
Is this normal? I get 7gb usage from gopls.exe

 speedwheel
on 9 May 2019
speedwheel
on 9 May 2019
This also happened to me; wasn't actively using vscode at the time:

It kept using more memory until the machine was OOM.
 200sc
on 9 May 2019
200sc
on 9 May 2019
Also in Ubuntu

 Akumzy
on 10 May 2019
Akumzy
on 10 May 2019
What is the size of the projects that you were working on? gopls caches type information so the larger the project, the more memory it will use. It shouldn't keep using more memory or OOM, however, unless you are consistently adding new dependencies.
stamblerre
on 11 May 2019
@stamblerre My go.mod has around 70 dependencies.
speedwheel
on 11 May 2019
@stamblerre I have about 10 dependencies
I don't if the information below will be helpful
Screenshot from 2019-05-11 16-16-00

Screenshot from 2019-05-11 21-12-32

go.mod file
go 1.12
require (
github.com/Akumzy/ipc v0.0.0-20190428150754-76128748c1e5
github.com/asdine/storm v2.1.2+incompatible
github.com/emersion/go-imap v1.0.0-beta.4
github.com/emersion/go-imap-idle v0.0.0-20180114101550-2af93776db6b
github.com/emersion/go-message v0.9.2
github.com/emersion/go-sasl v0.0.0-20161116183048-7e096a0a6197
github.com/stretchr/testify v1.3.0 // indirect
go.etcd.io/bbolt v1.3.2
golang.org/x/oauth2 v0.0.0-20190402181905-9f3314589c9a
)
go.som file
cloud.google.com/go v0.34.0 h1:eOI3/cP2VTU6uZLDYAoic+eyzzB9YyGmJ7eIjl8rOPg=

cloud.google.com/go v0.34.0/go.mod h1:aQUYkXzVsufM+DwF1aE+0xfcU+56JwCaLick0ClmMTw=

github.com/Akumzy/ipc v0.0.0-20190428150754-76128748c1e5 h1:tiD/RAuIZlj2Dy8f5NUhNdBrH5M0F0xPPVVtU6Scug8=

github.com/Akumzy/ipc v0.0.0-20190428150754-76128748c1e5/go.mod h1:KtE0oJxRkmbN0MyDlw/wULkL0ey21TF2SpDOfJ+sJUk=

github.com/asdine/storm v2.1.2+incompatible h1:dczuIkyqwY2LrtXPz8ixMrU/OFgZp71kbKTHGrXYt/Q=

github.com/asdine/storm v2.1.2+incompatible/go.mod h1:RarYDc9hq1UPLImuiXK3BIWPJLdIygvV3PsInK0FbVQ=

github.com/davecgh/go-spew v1.1.0 h1:ZDRjVQ15GmhC3fiQ8ni8+OwkZQO4DARzQgrnXU1Liz8=

github.com/davecgh/go-spew v1.1.0/go.mod h1:J7Y8YcW2NihsgmVo/mv3lAwl/skON4iLHjSsI+c5H38=

github.com/emersion/go-imap v1.0.0-beta.4 h1:QglkDofK1RhU471SqcHxzRlSuPsCL6YpFc+NR5O6H6Q=

github.com/emersion/go-imap v1.0.0-beta.4/go.mod h1:mOPegfAgLVXbhRm1bh2JTX08z2Y3HYmKYpbrKDeAzsQ=

github.com/emersion/go-imap-idle v0.0.0-20180114101550-2af93776db6b h1:q4qkNe/W10qFGD3RWd4meQTkD0+Zrz0L4ekMvlptg60=

github.com/emersion/go-imap-idle v0.0.0-20180114101550-2af93776db6b/go.mod h1:o14zPKCmEH5WC1vU5SdPoZGgNvQx7zzKSnxPQlobo78=

github.com/emersion/go-message v0.9.1/go.mod h1:m3cK90skCWxm5sIMs1sXxly4Tn9Plvcf6eayHZJ1NzM=

github.com/emersion/go-message v0.9.2 h1:rJmtGZO1Z71PJDQXbC31EwzlJCsA/8kya6GnebSGp6I=

github.com/emersion/go-message v0.9.2/go.mod h1:m3cK90skCWxm5sIMs1sXxly4Tn9Plvcf6eayHZJ1NzM=

github.com/emersion/go-sasl v0.0.0-20161116183048-7e096a0a6197 h1:rDJPbyliyym8ZL/Wt71kdolp6yaD4fLIQz638E6JEt0=

github.com/emersion/go-sasl v0.0.0-20161116183048-7e096a0a6197/go.mod h1:G/dpzLu16WtQpBfQ/z3LYiYJn3ZhKSGWn83fyoyQe/k=

github.com/emersion/go-textwrapper v0.0.0-20160606182133-d0e65e56babe h1:40SWqY0zE3qCi6ZrtTf5OUdNm5lDnGnjRSq9GgmeTrg=

github.com/emersion/go-textwrapper v0.0.0-20160606182133-d0e65e56babe/go.mod h1:aqO8z8wPrjkscevZJFVE1wXJrLpC5LtJG7fqLOsPb2U=

github.com/golang/protobuf v1.2.0/go.mod h1:6lQm79b+lXiMfvg/cZm0SGofjICqVBUtrP5yJMmIC1U=

github.com/pmezard/go-difflib v1.0.0 h1:4DBwDE0NGyQoBHbLQYPwSUPoCMWR5BEzIk/f1lZbAQM=

github.com/pmezard/go-difflib v1.0.0/go.mod h1:iKH77koFhYxTK1pcRnkKkqfTogsbg7gZNVY4sRDYZ/4=

github.com/stretchr/objx v0.1.0/go.mod h1:HFkY916IF+rwdDfMAkV7OtwuqBVzrE8GR6GFx+wExME=

github.com/stretchr/testify v1.3.0 h1:TivCn/peBQ7UY8ooIcPgZFpTNSz0Q2U6UrFlUfqbe0Q=

github.com/stretchr/testify v1.3.0/go.mod h1:M5WIy9Dh21IEIfnGCwXGc5bZfKNJtfHm1UVUgZn+9EI=

go.etcd.io/bbolt v1.3.2 h1:Z/90sZLPOeCy2PwprqkFa25PdkusRzaj9P8zm/KNyvk=

go.etcd.io/bbolt v1.3.2/go.mod h1:IbVyRI1SCnLcuJnV2u8VeU0CEYM7e686BmAb1XKL+uU=

golang.org/x/net v0.0.0-20180724234803-3673e40ba225/go.mod h1:mL1N/T3taQHkDXs73rZJwtUhF3w3ftmwwsq0BUmARs4=

golang.org/x/net v0.0.0-20190108225652-1e06a53dbb7e h1:bRhVy7zSSasaqNksaRZiA5EEI+Ei4I1nO5Jh72wfHlg=

golang.org/x/net v0.0.0-20190108225652-1e06a53dbb7e/go.mod h1:mL1N/T3taQHkDXs73rZJwtUhF3w3ftmwwsq0BUmARs4=

golang.org/x/oauth2 v0.0.0-20190402181905-9f3314589c9a h1:tImsplftrFpALCYumobsd0K86vlAs/eXGFms2txfJfA=

golang.org/x/oauth2 v0.0.0-20190402181905-9f3314589c9a/go.mod h1:gOpvHmFTYa4IltrdGE7lF6nIHvwfUNPOp7c8zoXwtLw=

golang.org/x/sync v0.0.0-20181221193216-37e7f081c4d4/go.mod h1:RxMgew5VJxzue5/jJTE5uejpjVlOe/izrB70Jof72aM=

golang.org/x/text v0.3.0 h1:g61tztE5qeGQ89tm6NTjjM9VPIm088od1l6aSorWRWg=

golang.org/x/text v0.3.0/go.mod h1:NqM8EUOU14njkJ3fqMW+pc6Ldnwhi/IjpwHt7yyuwOQ=

google.golang.org/appengine v1.4.0/go.mod h1:xpcJRLb0r/rnEns0DIKYYv+WjYCduHsrkT7/EB5XEv4=
Akumzy
on 11 May 2019
I had a few projects with modules open with ~70 dependencies between them.
200sc
on 12 May 2019
I have around 10 dependencies and memory goes up to 1GB right away
 WoLfulus
on 12 May 2019
WoLfulus
on 12 May 2019
I have experienced similar issues for what it is worth, ubuntu works flawlessly running with <1gb ram but initially running in windows quickly ate all available ram rendering gopls inoperative. Recent updates have improved this significantly, now gopls will only use ~5gb with ~40 dependencies for a single project.
 Dolmant
on 29 May 2019
Dolmant
on 29 May 2019
We have a few pending changes that will hopefully improve the memory consumption - I will update this issue once these changes are submitted.
stamblerre
on 29 May 2019
Change https://golang.org/cl/178719 mentions this issue: internal/lsp: trim ASTs for which we do not require function bodies
gopherbot
on 1 Jun 2019
The change above was the first of these planned improvements. It would be really helpful to get feedback on it. Did memory consumption decrease for anyone on this thread?
stamblerre
on 5 Jun 2019
I switch to Windows from Linux (Ubuntu) recently and I haven't notice any lag since then
Akumzy
on 5 Jun 2019
The first "go to definition" on https://github.com/golang/tools/commit/8aaa1484dc108aa23dcf2d4a09371c0c9e280f6b made my NixOS system unresponsive for ~5 minutes(freezes like this are very common with gopls in my experience and have never happened before on the system).
 rvolosatovs
on 5 Jun 2019
rvolosatovs
on 5 Jun 2019
Change https://golang.org/cl/180857 mentions this issue: internal/lsp: call the trimAST function, actually
gopherbot
on 5 Jun 2019
@stamblerre
Hi, I test gopls with my project, both on windows7 and ubuntu with vscode, and the result is the same: gopls takes too much memory and cpu.
windows 7 x64:

ubuntu 18 x64:

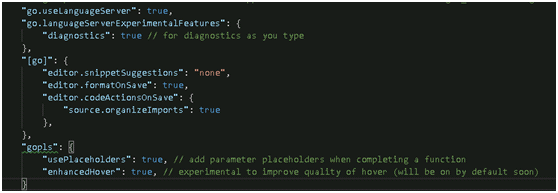
my vscode config:
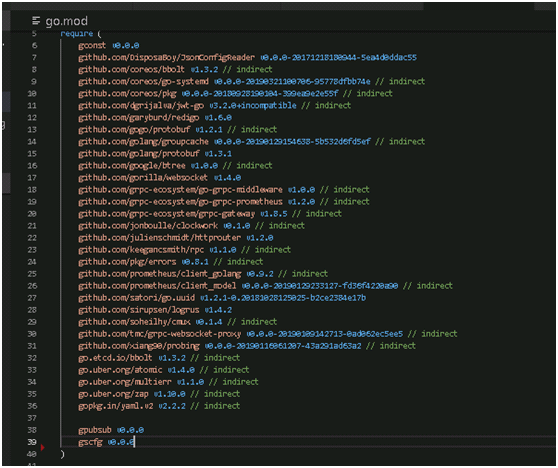
my project go.mod:
 linguohua
on 6 Jun 2019
linguohua
on 6 Jun 2019
I have also seen no improvement
Dolmant
on 6 Jun 2019
@linguohua @Dolmant As far as this comment, the improvement is implemented, but not used yet.
 methane
on 6 Jun 2019
methane
on 6 Jun 2019
@rvolosatovs @methane Hi, I have test gopls of rvolosatovs's fork, the memory used has decrease from 7G to 5G, it looks good. But the cpu is always so high, 40% of my pc, it never goes down until I close vscode.

I guess gopls has fall into some infinite loop, cause it will never response to any request from vscode:

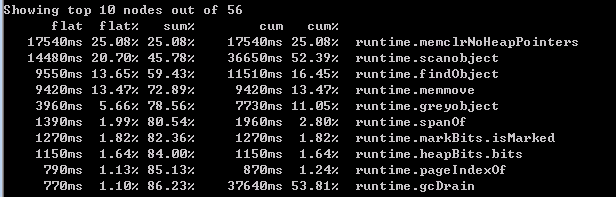
pprof cpu:
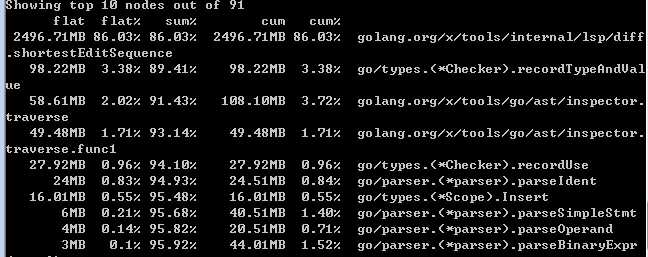
pprof heap:
If I add the following code to gopls's main.go:
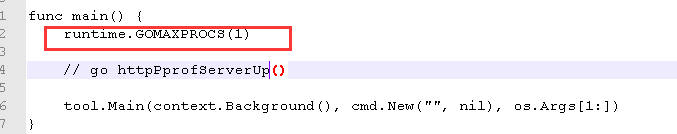
and comment out the call to func "shortestEditSequence" in diff.go:

then, the gopls seems to work, maybe leaks some feature, but it now can response to vscode, 'hover', 'go to def', 'auto complete' response quickly. It use 1G memory, cpu is low:

now I know by comment out the 'shortestEditSequence' will kill format feature, so i just limit the size of array, in diff.go:
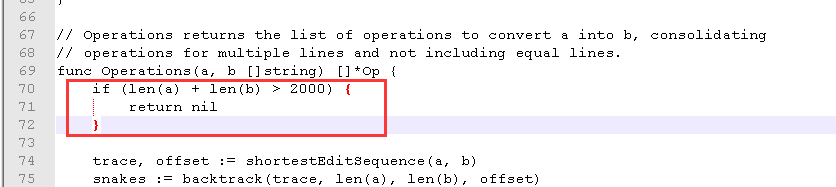
now it works fine except files which lines count exceed 1000. So, maybe the 'shortestEditSequence' need a new algorithm to increase performance.
linguohua
on 7 Jun 2019
@linguohua: Thanks for the detailed report. Do you have "files.eol": "\n" configured in VSCode? I wonder if your formatting is causing problems because gofmt always uses \n line endings, even on Windows.
Also, my apologies re: the change above. It had some bugs, and it's now actually merged. It seems to have decreased memory usage for me, so I hope others will see the same results.
stamblerre
on 11 Jun 2019
@stamblerre Thanks for your reply. I update to the latest gopls, now it works perfect, the memory is so so so low, only 300M, compare to prev's 7G, the same project, the same vscode config, the same vscode-go, this is so unbelievable, I just can't understand why.
There must be some magic change happend in these commits:
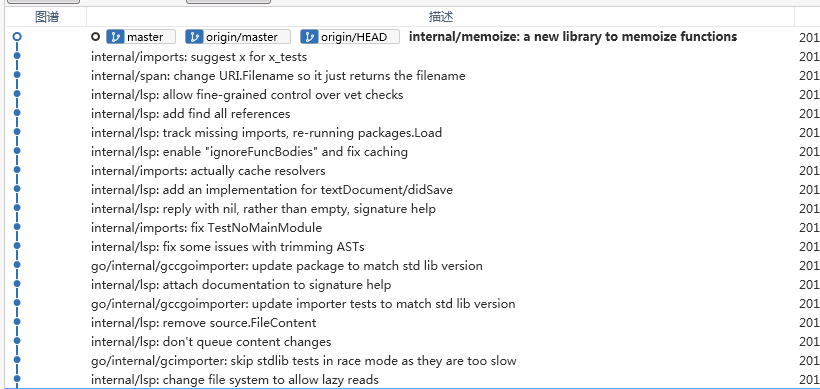
Anyway, gopls works great for me now, thanks to all contributors.
linguohua
on 11 Jun 2019
@stamblerre Thanks, I fired up windows to check and it has definitely improved a lot! My same project is now capping out at 3.5GB (from 10+GB) and is usable.
Much appreciated!
Dolmant
on 11 Jun 2019
Before the latest update it needed like 1 or 2 GB more and reached the peak faster. There is a visible improvement, but I don't think this is ideal yet. gopls still requires a lot of space and is very slow overall.

 FlorianKutz
on 18 Jun 2019
FlorianKutz
on 18 Jun 2019
@1522784: We are working on further improvements to help with memory usage, but I would be interested to hear more about the speed issues you are encountering. Would you be willing to share your gopls logs so I can look at the latencies? They can be found by going to View: Debug Console -> Output -> Tasks -> gopls.
stamblerre
on 18 Jun 2019
@1522784 , Hi, maybe you can provide a heap snapshot to @stamblerre use the following steps:
- in the user setting of vscode, paste the following json statements:
    "go.languageServerFlags": [
        "-debug=localhost:8090",
    ],
reload your project, wait the gopls to startup, then go to browser and type "http://localhost:8090/", you will see a web page like this one:

click the 'debug' link, then click 'profiling', and click 'heap', then you can see something like this:

maybe these information can provide some help to gopls contributors.
linguohua
on 20 Jun 2019
using latest build 2019-06-28
"debug->profile->heap" just after start up:
heap profile: 1: 32 [1: 32] @ heap/1048576
1: 32 [1: 32] @ 0x7cb496 0x7cb414 0x7caa95 0x7c9a15 0x7e7283 0x8ffb65 0x91a510 0x430858 0x45d841
#   0x7cb495    text/template/parse.(*ListNode).append+0x445            /usr/local/go/src/text/template/parse/node.go:89
#   0x7cb413    text/template/parse.(*Tree).parse+0x3c3             /usr/local/go/src/text/template/parse/parse.go:295
#   0x7caa94    text/template/parse.(*Tree).Parse+0x214             /usr/local/go/src/text/template/parse/parse.go:230
#   0x7c9a14    text/template/parse.Parse+0x124                 /usr/local/go/src/text/template/parse/parse.go:55
#   0x7e7282    text/template.(*Template).Parse+0x112               /usr/local/go/src/text/template/template.go:196
#   0x8ffb64    html/template.(*Template).Parse+0x84                /usr/local/go/src/html/template/template.go:189
#   0x91a50f    golang.org/x/tools/internal/lsp/debug.init.ializers+0x1af   /home/jackieli/gomod/saibing-tools/internal/lsp/debug/serve.go:306
#   0x430857    runtime.main+0x1c7                      /usr/local/go/src/runtime/proc.go:188


# runtime.MemStats
# Alloc = 1295552
# TotalAlloc = 1295552
# Sys = 71893240
# Lookups = 0
# Mallocs = 6913
# Frees = 211
# HeapAlloc = 1295552
# HeapSys = 66781184
# HeapIdle = 64462848
# HeapInuse = 2318336
# HeapReleased = 0
# HeapObjects = 6702
# Stack = 327680 / 327680
# MSpan = 29088 / 32768
# MCache = 13888 / 16384
# BuckHashSys = 1443399
# GCSys = 2240512
# OtherSys = 1051313
# NextGC = 4473924
# LastGC = 0
# PauseNs = [0 0 0 0 0 0 0 0 0 0 0 0 0 0 0 0 0 0 0 0 0 0 0 0 0 0 0 0 0 0 0 0 0 0 0 0 0 0 0 0 0 0 0 0 0 0 0 0 0 0 0 0 0 0 0 0 0 0 0 0 0 0 0 0 0 0 0 0 0 0 0 0 0 0 0 0 0 0 0 0 0 0 0 0 0 0 0 0 0 0 0 0 0 0 0 0 0 0 0 0 0 0 0 0 0 0 0 0 0 0 0 0 0 0 0 0 0 0 0 0 0 0 0 0 0 0 0 0 0 0 0 0 0 0 0 0 0 0 0 0 0 0 0 0 0 0 0 0 0 0 0 0 0 0 0 0 0 0 0 0 0 0 0 0 0 0 0 0 0 0 0 0 0 0 0 0 0 0 0 0 0 0 0 0 0 0 0 0 0 0 0 0 0 0 0 0 0 0 0 0 0 0 0 0 0 0 0 0 0 0 0 0 0 0 0 0 0 0 0 0 0 0 0 0 0 0 0 0 0 0 0 0 0 0 0 0 0 0 0 0 0 0 0 0 0 0 0 0 0 0 0 0 0 0 0 0]
# PauseEnd = [0 0 0 0 0 0 0 0 0 0 0 0 0 0 0 0 0 0 0 0 0 0 0 0 0 0 0 0 0 0 0 0 0 0 0 0 0 0 0 0 0 0 0 0 0 0 0 0 0 0 0 0 0 0 0 0 0 0 0 0 0 0 0 0 0 0 0 0 0 0 0 0 0 0 0 0 0 0 0 0 0 0 0 0 0 0 0 0 0 0 0 0 0 0 0 0 0 0 0 0 0 0 0 0 0 0 0 0 0 0 0 0 0 0 0 0 0 0 0 0 0 0 0 0 0 0 0 0 0 0 0 0 0 0 0 0 0 0 0 0 0 0 0 0 0 0 0 0 0 0 0 0 0 0 0 0 0 0 0 0 0 0 0 0 0 0 0 0 0 0 0 0 0 0 0 0 0 0 0 0 0 0 0 0 0 0 0 0 0 0 0 0 0 0 0 0 0 0 0 0 0 0 0 0 0 0 0 0 0 0 0 0 0 0 0 0 0 0 0 0 0 0 0 0 0 0 0 0 0 0 0 0 0 0 0 0 0 0 0 0 0 0 0 0 0 0 0 0 0 0 0 0 0 0 0 0]
# NumGC = 0
# NumForcedGC = 0
# GCCPUFraction = 0
# DebugGC = false
heap after some jumping around
heap.txt
go.mod:
require (
    github.com/RichardKnop/machinery v1.6.5
    github.com/coreos/go-oidc v2.0.0+incompatible
    github.com/gogo/protobuf v1.2.1
    github.com/golang/protobuf v1.3.1 // indirect
    github.com/grpc-ecosystem/go-grpc-middleware v1.0.0
    github.com/hashicorp/golang-lru v0.5.1
    github.com/inconshreveable/mousetrap v1.0.0 // indirect
    github.com/jackielii/process v0.0.0-20190625104948-ee2b034387b8
    github.com/konsorten/go-windows-terminal-sequences v1.0.2 // indirect
    github.com/minio/minio-go/v6 v6.0.29
    github.com/mitchellh/go-homedir v1.1.0
    github.com/pebbe/go-proj-4 v0.9.1
    github.com/pkg/errors v0.8.1
    github.com/pquerna/cachecontrol v0.0.0-20180517163645-1555304b9b35 // indirect
    github.com/sirupsen/logrus v1.4.2
    github.com/spf13/cobra v0.0.3
    github.com/spf13/viper v1.3.1
    github.com/stretchr/testify v1.3.0
    github.com/twpayne/go-geom v1.0.5-0.20190320002942-31a8a3d5e136
    golang.org/x/net v0.0.0-20190522155817-f3200d17e092
    google.golang.org/grpc v1.19.1
    gopkg.in/square/go-jose.v2 v2.3.1 // indirect
)
 jackielii
on 1 Jul 2019
jackielii
on 1 Jul 2019
I noticed this issue when opening a large go lookup table file with vs code on win 10 with go version go1.12.6 windows/amd64. The file has 16,612 lines and is 188kb. The lookup tables are declared like this:
 var LUT = [][]uint16{
[]uint16 {
 2316:891,
  912:378,
 7296:75,
...
}
}
My memory usage goes through the roof, quickly filling up ALL my RAM within 10 seconds or so. Closing the file has no effect, the memory isn't restored. Quitting vs code or killing gopls.exe is the only way to free the memory. I didn't check to see if waiting after closing the file would resore the memory.
go env output
set GOARCH=amd64
set GOBIN=F:\Users\Travis\AppData\Local\Go-1.12.6\bin\
set GOCACHE=F:\Users\Travis\AppData\Local\go-build
set GOEXE=.exe
set GOFLAGS=
set GOHOSTARCH=amd64
set GOHOSTOS=windows
set GOOS=windows
set GOPATH=F:\Users\Travis.go
set GOPROXY=
set GORACE=
set GOROOT=F:\Users\Travis\AppData\Local\Go-1.12.6
set GOTMPDIR=
set GOTOOLDIR=F:\Users\Travis\AppData\Local\Go-1.12.6\pkg\tool\windows_amd64
set GCCGO=gccgo
set CC=gcc
set CXX=g++
set CGO_ENABLED=1
set GOMOD=F:\Users\Travis\Documents\Code\go\pokerserver\go.mod
set CGO_CFLAGS=-g -O2
set CGO_CPPFLAGS=
set CGO_CXXFLAGS=-g -O2
set CGO_FFLAGS=-g -O2
set CGO_LDFLAGS=-g -O2
set PKG_CONFIG=pkg-config
set GOGCCFLAGS=-m64 -mthreads -fmessage-length=0 -fdebug-prefix-map=C:\Users\Travis\AppData\Local\Temp\go-build106900346=/tmp/go-build -gno-record-gcc-switches
 travisstaloch
on 21 Aug 2019
travisstaloch
on 21 Aug 2019
@travisstaloch: That sounds like an instance of https://github.com/golang/go/issues/33003.
stamblerre
on 24 Aug 2019
Change https://golang.org/cl/192332 mentions this issue: dashboard: skip x/tools on the linux-arm builder
gopherbot
on 29 Aug 2019
Change https://golang.org/cl/192336 mentions this issue: go/packages,internal/lsp: skip memory-intensive tests on the linux-arm builder
gopherbot
on 29 Aug 2019
I've seem to managed to contain gopls with linux cgroups
$ cat /etc/cgconfig.conf
group gopls{
     memory{
         memory.limit_in_bytes = 300m;
     }
}

$ cat /etc/cgrules.conf
*:gopls memory gopls/
 ugjka
on 22 Oct 2019
ugjka
on 22 Oct 2019
Older versions of gopls had a memory leak that was causing major problems. Are users still having memory issues with gopls versions 0.2.0 or 0.2.1?
stamblerre
on 4 Dec 2019
I was experiencing this a couple weeks ago on master. I opened up controller-runtime and some other k8s libs, and my gopls instance was at 10Gi+. Only noticed because my machine started swapping.
 jsravn
on 9 Dec 2019
jsravn
on 9 Dec 2019
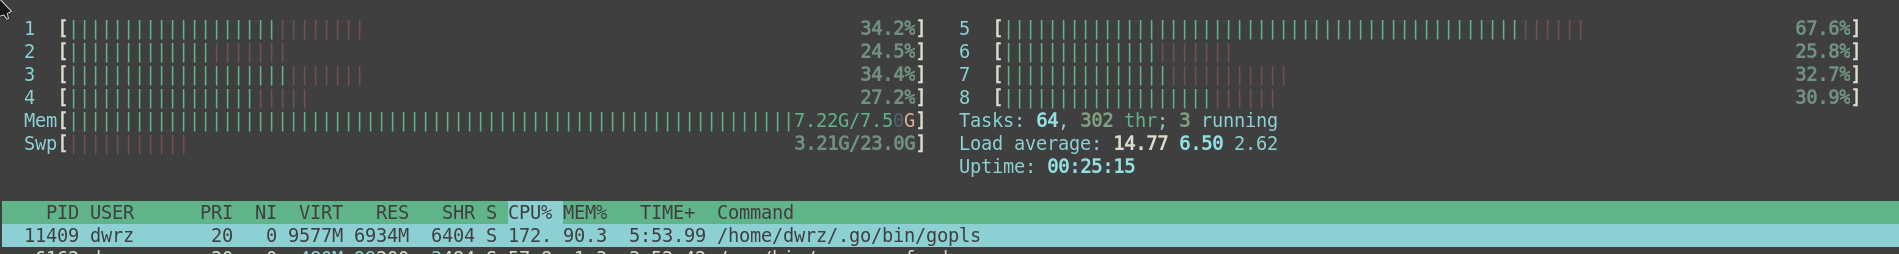
I am still experiencing high memory usage (%75) with both 0.2.1 and latest.
 dwrz
on 10 Dec 2019
dwrz
on 10 Dec 2019
@jsravn, @dwrz: Can you share your VS Code settings? Are you using the staticcheck configuration?
stamblerre
on 10 Dec 2019
@stamblerre -- apologies -- I'm running gopls with Emacs and lsp-mode. I'm not familiar staticcheck. Happy to provide any relevant information there, if that'd be helpful.
dwrz
on 10 Dec 2019
I'm also using emacs and lsp-mode. It doesn't enable staticcheck as far as I know. You can see what it does here - looks like it just invokes gopls without any flags.
jsravn
on 11 Dec 2019
gopls has some additional settings that you can see above, which is what I was referring to, but no worries about the staticcheck stuff. I was just asking because that tends to increase memory usage significantly.
You can pass the following flags to gopls to enable debug pages: gopls serve -rpc.trace --debug=localhost:6060. Some concrete numbers on memory usage from the localhost:6060/memory endpoint, as well as some information about your workspace (module or GOPATH mode, number of packages, number of files, etc.) would be very helpful here.
stamblerre
on 11 Dec 2019
Following are the stats after a relatively light day at work -- using gopls 0.2.2:
GoPls memory usage
Stats
Allocated bytes 1,270,176
Total allocated bytes   320,152,504
System bytes    72,548,600
Heap system bytes   66,256,896
Malloc calls    10,308,639
Frees   10,296,957
Idle heap bytes 63,488,000
In use bytes    2,768,896
Released to system bytes    61,710,336
Heap object count   11,682
Stack in use bytes  851,968
Stack from system bytes 851,968
Bucket hash bytes   1,455,470
GC metadata bytes   2,385,920
Off heap bytes  1,500,042
By size
Size    Mallocs Frees
0   0   0
8   1,505   1,049
16  1,845,429   1,842,789
32  6,640,157   6,636,497
48  862,977 860,617
64  10,096  9,551
80  8,848   8,620
96  1,009   497
112 4,684   4,599
128 4,914   4,810
144 4,291   4,273
160 256 159
176 13  4
192 23  2
208 762 458
224 4,283   4,271
240 9   1
256 4,518   4,378
288 131 100
320 33  27
352 141 125
384 163 4
416 51  23
448 9   4
480 16  11
512 10  6
576 41  24
640 38  12
704 4,216   4,203
768 10  1
896 51  21
1,024   785 765
1,152   23  6
1,280   18  6
1,408   14  2
1,536   3   0
1,792   27  9
2,048   268 263
2,304   7   2
2,688   11  6
3,072   2   0
3,200   1   0
3,456   0   0
4,096   33  23
4,864   4   2
5,376   4   0
6,144   4,185   4,182
6,528   0   0
6,784   0   0
6,912   0   0
8,192   2   0
9,472   9   1
9,728   0   0
10,240  0   0
10,880  0   0
12,288  1   0
13,568  0   0
14,336  0   0
16,384  0   0
18,432  1   0
19,072  0   0
At its peak, gopls was using about 30% of system memory.
I've had three different projects open today. The primary one is ~150 .go files in total (maybe a few dozen open), 20 modules. The others are probably more or less the same size. All projects are in module mode (1.13).
I wasn't able to get lsp-mode to pass the flags to gopls, even though it looks like the variables were set correctly. I resorted to running gopls manually with the flags. One thing I noticed -- it looked like lsp-mode was always using the same instance of gopls (identical port). Usually, if I don't manually start gopls, it looks like lsp-mode starts a different instance for each project / module. I'm not sure what the proper behavior is, but I'm wondering if that explains the memory issues I was seeing.
dwrz
on 12 Dec 2019
https://github.com/golang/go/issues/34111 tracks making sure that there is only 1 instance of gopls running even if there are multiple clients. So it's definitely possible that having multiple editors open causes the high memory usage. The memory statistics you posted above don't seem troublesome to me, and they definitely don't seem like 30% of system memory.
stamblerre
on 12 Dec 2019
I will try to capture it when things get bad. For now I did a quick test where I opened a project using controller-runtime, and browsed to some of the libraries:
GoPls memory usage
Stats
Allocated bytes 792,769,944
Total allocated bytes   2,384,210,888
System bytes    1,264,525,560
Heap system bytes   1,204,748,288
Malloc calls    20,911,293
Frees   14,848,714
Idle heap bytes 312,418,304
In use bytes    892,329,984
Released to system bytes    47,751,168
Heap object count   6,062,579
Stack in use bytes  3,211,264
Stack from system bytes 3,211,264
Bucket hash bytes   2,019,118
GC metadata bytes   43,986,944
Off heap bytes  2,335,178
By size
Size    Mallocs Frees
0   0   0
8   822,099 446,916
16  4,303,210   2,886,190
32  5,283,014   3,197,583
48  2,468,900   1,614,119
64  3,080,836   2,789,412
80  1,322,559   522,351
96  478,457 412,899
112 48,708  42,552
128 135,327 118,202
144 38,332  36,857
160 29,206  28,242
176 42,519  36,550
192 7,106   6,955
208 210,550 204,099
224 28,153  27,767
240 13,591  13,531
256 37,565  30,079
288 172,776 88,002
320 5,386   5,214
352 6,022   5,933
384 15,393  5,044
416 24,448  23,801
448 2,938   2,908
480 72,169  57,519
512 10,877  8,642
576 14,072  12,482
640 1,300   1,239
704 2,174   2,041
768 380 356
896 8,954   8,169
1,024   7,530   5,914
1,152   8,019   7,493
1,280   1,065   860
1,408   583 396
1,536   608 553
1,792   6,321   5,632
2,048   4,517   3,392
2,304   2,510   2,084
2,688   3,502   3,328
3,072   2,340   2,247
3,200   126 87
3,456   455 360
4,096   7,694   6,391
4,864   1,085   703
5,376   404 302
6,144   350 100
6,528   66  3
6,784   49  13
6,912   67  53
8,192   4,260   3,268
9,472   538 317
9,728   33  13
10,240  387 322
10,880  60  11
12,288  108 41
13,568  279 188
14,336  1,411   1,096
16,384  1,005   730
18,432  239 146
19,072  239 144
Session 1
From: Cache 1
Views
cloudstate-operator is View 1 in file:///home/james/lightbend/cloudstatemachine/cloudstate-operator
Files
file:///home/james/go/pkg/mod/k8s.io/[email protected]/core/v1/types.go
file:///home/james/go/pkg/mod/k8s.io/[email protected]/pkg/api/meta/help.go
file:///home/james/go/pkg/mod/k8s.io/[email protected]/pkg/apis/meta/v1/types.go
file:///home/james/go/pkg/mod/k8s.io/[email protected]/pkg/runtime/scheme.go
file:///home/james/go/pkg/mod/sigs.k8s.io/[email protected]/alias.go
file:///home/james/lightbend/cloudstatemachine/cloudstate-operator/controllers/statefulservice_controller.go
file:///usr/lib/go/src/context/context.go
I was able to get into this situation by creating a new function (without parameters) and copying some code into it. Once I saved the file, goimports kicked in, was unable to resolve what ought to have been defined as that function's parameters. That's when I saw gopls start to spike in CPU and memory usage.
I was able to replicate this killing gopls, reverting the file, and then repeating the steps (new function without parameters, copy code).
I'm still a little bit confused by what's going on with the number of gopls instances running. I manually started an instance and thought it would be the only one running. But after stopping it manually, it looked like there were still other instances running, that I had to stop with killall gopls. I'll try to keep a closer eye on this and report back.
Allocated bytes 2,752,472
Total allocated bytes   11,922,080
System bytes    72,548,600
Heap system bytes   66,453,504
Malloc calls    343,313
Frees   286,591
Idle heap bytes 62,308,352
In use bytes    4,145,152
Released to system bytes    61,562,880
Heap object count   56,722
Stack in use bytes  655,360
Stack from system bytes 655,360
Bucket hash bytes   1,446,646
GC metadata bytes   2,385,920
Off heap bytes  1,492,482
By size
Size    Mallocs Frees
0   0   0
8   622 147
16  60,016  48,846
32  218,766 182,820
48  30,758  24,266
64  1,211   625
80  586 316
96  539 93
112 558 451
128 310 177
144 84  68
160 244 124
176 12  3
192 23  2
208 398 94
224 159 124
240 9   1
256 320 158
288 85  55
320 33  27
352 49  27
384 68  2
416 46  22
448 9   4
480 12  7
512 9   5
576 31  14
640 38  12
704 156 122
768 10  1
896 49  19
1,024   38  17
1,152   17  6
1,280   18  6
1,408   8   2
1,536   3   0
1,792   23  6
2,048   10  4
2,304   5   0
2,688   7   2
3,072   2   0
3,200   1   0
3,456   0   0
4,096   17  7
4,864   2   0
5,376   4   0
6,144   139 115
6,528   0   0
6,784   0   0
6,912   0   0
8,192   2   0
9,472   9   1
9,728   0   0
10,240  0   0
10,880  0   0
12,288  1   0
13,568  0   0
14,336  0   0
16,384  0   0
18,432  1   0
19,072  0   0
@dwrz are you sure you're scraping the right gopls? 72MiB heap is not very big. I also see multiple gopls processes. Only one of them can successfully bind to port 6060.
jsravn
on 16 Dec 2019
@jsravn -- just took a closer look -- I don't think I am. It looks like lsp-mode is starting its own instances and not using the debug server. So -- apologies -- those memory stats are irrelevant.
I tried setting lsp-gopls-server-args again and it looks to be working for me now. I'll try this again later -- may have to be tomorrow -- and report back.
dwrz
on 16 Dec 2019
(setq lsp-gopls-server-args '("-rpc.trace" "--debug=localhost:6060")) should do the trick.
jsravn
on 16 Dec 2019
Yep, that's what I have -- when I tried it last week it wasn't having any effect.
dwrz
on 16 Dec 2019
Hopefully this is on the right track:
 Main Info Memory Metrics RPC Trace
GoPls memory usage
Stats
Allocated bytes 1,874,759,688
Total allocated bytes   27,826,168,120
System bytes    5,422,058,296
Heap system bytes   3,823,140,864
Malloc calls    328,987,833
Frees   309,344,009
Idle heap bytes 1,664,188,416
In use bytes    2,158,952,448
Released to system bytes    15,638,528
Heap object count   19,643,824
Stack in use bytes  1,344,241,664
Stack from system bytes 1,344,241,664
Bucket hash bytes   3,228,582
GC metadata bytes   190,748,672
Off heap bytes  9,416,594
By size
Size    Mallocs Frees
0   0   0
8   5,937,615   5,463,178
16  62,172,147  59,529,419
32  105,959,191 99,970,666
48  32,586,016  29,370,218
64  23,455,382  22,104,325
80  11,692,136  10,895,865
96  4,782,414   3,965,587
112 1,251,115   1,175,280
128 3,514,623   3,382,241
144 14,696,691  13,772,588
160 9,697,051   9,606,337
176 8,473,294   7,405,670
192 4,022,748   3,916,726
208 6,710,206   6,634,774
224 4,886,396   4,113,227
240 512,857 388,860
256 611,621 509,291
288 941,235 763,448
320 530,070 430,645
352 342,435 260,203
384 765,073 284,602
416 182,057 160,201
448 76,485  68,972
480 58,594  56,157
512 101,509 98,480
576 37,235  35,434
640 30,912  30,313
704 22,933  22,523
768 6,832   6,670
896 28,810  28,071
1,024   66,962  65,195
1,152   9,491   9,118
1,280   8,060   7,920
1,408   5,744   5,616
1,536   10,193  10,054
1,792   69,264  68,793
2,048   36,226  35,270
2,304   11,438  11,228
2,688   5,422   5,235
3,072   4,625   4,476
3,200   1,478   1,446
3,456   4,391   4,309
4,096   50,499  49,535
4,864   5,826   5,614
5,376   3,458   3,330
6,144   4,673   4,502
6,528   1,686   1,640
6,784   1,007   981
6,912   746 723
8,192   70,139  69,641
9,472   4,297   4,131
9,728   341 325
10,240  4,214   4,130
10,880  959 928
12,288  3,282   3,230
13,568  3,809   3,742
14,336  2,882   2,741
16,384  5,253   5,111
18,432  2,991   2,949
19,072  1,126   1,098
I think this was related to goimports again -- changing the parameters of a function.
lsp-mode config:
(use-package lsp-mode
  :ensure t
  :hook (go-mode . lsp)
  :commands lsp
  :config
  (setq lsp-gopls-server-args '("-rpc.trace" "--debug=localhost:6060")))
go-mode config:
(use-package go-mode
  :ensure t
  :bind-keymap
  (("C-c t" . go-tag-add)
  ("C-c T" . go-tag-remove)
  ("C-c C-b" . pop-tag-mark))
  :config
  (add-hook 'before-save-hook #'gofmt-before-save)
  (add-hook 'go-mode-hook 'flycheck-mode)
  (add-hook 'go-mode-hook 'dumb-jump-mode)
  (if (executable-find "goimports")
      (setq gofmt-command "goimports"))
  (setq go-tag-args (list "-transform" "camelcase")))
I'm going to try setting go-mode to use gofmt instead of goimports and see if there's any improvement.
dwrz
on 16 Dec 2019
gopls should be able to perform import organization for you, so you should not need to run the goimports binary separately. https://github.com/golang/tools/blob/master/gopls/doc/emacs.md has the information on how to configure this. This doesn't explain the gopls memory usage, but it may help since it will de-duplicate some of the work your machine is doing.
stamblerre
on 17 Dec 2019
Thank you. I didn't notice any issues with memory usage after removing goimports from my go-mode config. I've just added the save-hooks specified in the docs and will see how things go.
dwrz
on 17 Dec 2019

Unfortunately, it looks like I'm still running into memory usage issues. I think this was related to imports again -- a typo in accessing a struct field seemed to cause a spike in CPU and memory usage. I had to manually kill gopls to get control back.
Hope this is still helpful:
 Main Info Memory Metrics RPC Trace
GoPls memory usage
Stats
Allocated bytes 3,513,551,600
Total allocated bytes   23,534,938,824
System bytes    7,178,594,392
Heap system bytes   4,375,805,952
Malloc calls    248,781,847
Frees   209,081,325
Idle heap bytes 814,415,872
In use bytes    3,561,390,080
Released to system bytes    22,593,536
Heap object count   39,700,522
Stack in use bytes  2,468,151,296
Stack from system bytes 2,468,151,296
Bucket hash bytes   3,214,374
GC metadata bytes   251,400,192
Off heap bytes  12,192,818
By size
Size    Mallocs Frees
0   0   0
8   5,084,837   4,311,387
16  48,989,694  41,724,412
32  71,900,063  61,706,671
48  26,418,769  20,442,178
64  19,835,705  17,607,378
80  10,926,038  9,475,692
96  5,458,456   3,835,888
112 928,812 798,434
128 2,195,352   1,903,198
144 11,638,153  8,902,226
160 6,965,488   5,972,364
176 7,282,924   5,039,367
192 3,011,182   2,487,809
208 4,960,396   4,364,049
224 2,188,038   1,503,377
240 418,976 192,544
256 678,848 474,599
288 1,350,681   983,676
320 547,058 340,549
352 411,855 239,361
384 961,807 253,902
416 218,154 165,008
448 64,591  43,486
480 172,986 162,323
512 106,509 100,322
576 50,746  46,541
640 38,054  36,929
704 15,882  15,444
768 7,102   6,838
896 49,097  48,353
1,024   59,821  58,282
1,152   18,140  17,791
1,280   5,736   5,646
1,408   13,189  13,047
1,536   5,326   5,216
1,792   84,438  83,832
2,048   31,352  30,071
2,304   12,648  12,396
2,688   9,108   8,895
3,072   3,511   3,432
3,200   2,577   2,530
3,456   2,503   2,430
4,096   45,466  44,136
4,864   10,538  10,354
5,376   3,718   3,629
6,144   5,584   5,509
6,528   1,669   1,633
6,784   751 734
6,912   1,739   1,718
8,192   67,701  67,056
9,472   6,654   6,510
9,728   338 320
10,240  3,435   3,383
10,880  699 677
12,288  4,225   4,179
13,568  2,446   2,370
14,336  7,685   7,570
16,384  5,643   5,509
18,432  1,928   1,887
19,072  1,774   1,744
(use-package go-mode
  :ensure t
  :bind
  (("C-c C-b" . pop-tag-mark)
   ("C-c t" . go-tag-add)
   ("C-c T" . go-tag-remove))
  :config
  (defun lsp-go-install-save-hooks ()
    (add-hook 'before-save-hook #'lsp-format-buffer t t)
    (add-hook 'before-save-hook #'lsp-organize-imports t t))
  (add-hook 'go-mode-hook 'dumb-jump-mode)
  (add-hook 'go-mode-hook 'flycheck-mode)
  (add-hook 'go-mode-hook #'lsp-go-install-save-hooks)
  (setq go-tag-args (list "-transform" "camelcase")))

(use-package lsp-mode
  :ensure t
  :hook (go-mode . lsp)
  :commands lsp
  :config
  (setq lsp-gopls-server-args '("-rpc.trace" "--debug=localhost:6060")))
Yes, those numbers do seem problematic. Are you working on a public project that I can try reproducing on or is this private code?
Also, do you experience the same issues at master? You can get master by running GO111MODULE=on go get golang.org/x/tools/gopls@master golang.org/x/tools@master.
stamblerre
on 19 Dec 2019
Unfortunately I'm working on private code. I'll try and see if I can get the behavior to trigger in a public codebase, though. I'll also set up master now -- thank you.
dwrz
on 19 Dec 2019
It also happens to me ... 10G +... It is easy to reproduce, git clone https://github.com/asticode/go-astilectron-demo, With vscode, remote SSH to open this folder, open message.go and main.go files and scroll to browse the code. In one minute the memory will increase to 10G (insider version), while with release version of vscode, the memory up to 7.6G.


 ajeecai
on 16 Jan 2020
ajeecai
on 16 Jan 2020
@ajeecai: What version of gopls are you using (gopls version)? You report sounds like a memory leak that existed a few months ago. If you update to the latest version (GO111MODULE=on go get golang.org/x/tools/gopls), I don't think that you should see this behavior.
stamblerre
on 16 Jan 2020
Hi @stamblerre Is this the latest version? I don't know how to update standalone gopls and what is its latest version.

ajeecai
on 17 Jan 2020
@ajeecai: v0.2.2 is the latest released version, though we will be releasing an update sometime this month. If you'd like to try out the current master, you can run: GO111MODULE=on go get golang.org/x/tools/gopls@master golang.org/x/tools@master.
stamblerre
on 17 Jan 2020
hi @stamblerre , with this command, the version of gopls looks downgrading

But as I edit the code in vscode, the memory usage looks extremely high, worse.

Do you have any change to try with the project I code mentioned, I think it is easy to reproduce.
ajeecai
on 18 Jan 2020
@ajeecai: I am not able to reproduce with the example you've given, but it's possible there are other factors at play here. Can you share you enable debug logging and share your gopls logs here? See https://github.com/golang/tools/blob/master/gopls/doc/troubleshooting.md#capturing-logs for more information. You can also enable the debug server, and we can try seeing what is using that much memory.
stamblerre
on 21 Jan 2020
I have switched gopls back to 0.2.2, when the memory up to 9G, I have followed the instructions and captured the log information in attachments. Please take a look.
gopls_log.txt
gopls_6060.tar.gz
Thanks
ajeecai
on 23 Jan 2020
Thank you for sharing this - something does appear to be going very wrong here, as the memory usage really is high, and you'll notice that there are many cancellation requests in the log, indicating that something is probably hanging. I'm afraid I won't be able to make much more progress in investigation without memory profiles, so if you'd be willing to collect some that would be very helpful. This can be done by running go tool pprof -web http://localhost:6060/debug/pprof/heap while gopls is running.
I would also highly recommend sticking with master (the v0.1.8 number was correct, sorry that it is misleading). A lot has changed since v0.2.2 came out, so I hope that might have some effect.
stamblerre
on 24 Jan 2020
This issue is almost a year old, and a great deal has changed in gopls since that time. There are a lot of discussions here that are no longer relevant, so I am going to close this issue and use https://github.com/golang/go/issues/36943 to track general memory improvements.
If you encounter a specific issue with your project, please open a new issue so that we can begin discussion separately.
@ajeecai: If you are able to produce profiles, please do create a new issue to share them, and we will continue investigating.
stamblerre
on 31 Jan 2020
Related issues
 bbodenmiller
·
3Comments
bbodenmiller
·
3Comments
 lkarlslund
·
3Comments
lkarlslund
·
3Comments
 stub42
·
3Comments
stub42
·
3Comments
 bradfitz
·
3Comments
bradfitz
·
3Comments
 OneOfOne
·
3Comments
OneOfOne
·
3Comments
Most helpful comment
Is this normal? I get 7gb usage from gopls.exe