Please answer these questions before submitting your issue. Thanks!
What version of Go are you using (go version)?
go version go1.10.2 linux/amd64
Does this issue reproduce with the latest release?
yes
What operating system and processor architecture are you using (go env)?
GOARCH="amd64"
GOBIN=""
GOCACHE="/home/svn/jessemjchen/.cache/go-build"
GOEXE=""
GOHOSTARCH="amd64"
GOHOSTOS="linux"
GOOS="linux"
GOPATH="/home/svn/jessemjchen"
GORACE=""
GOROOT="/home/svn/go"
GOTMPDIR=""
GOTOOLDIR="/home/svn/go/pkg/tool/linux_amd64"
GCCGO="gccgo"
CC="gcc"
CXX="g++"
CGO_ENABLED="1"
CGO_CFLAGS="-g -O2"
CGO_CPPFLAGS=""
CGO_CXXFLAGS="-g -O2"
CGO_FFLAGS="-g -O2"
CGO_LDFLAGS="-g -O2"
PKG_CONFIG="pkg-config"
GOGCCFLAGS="-fPIC -m64 -pthread -fmessage-length=0 -fdebug-prefix-map=/tmp/go-build019705885=/tmp/go-build"
What did you do?
I write a server in golang,and I use SetReadDeadline/SetWriteDeadline to set a timeout . But when I benchmark ,and use pprof to get cpu pprof ,I get a bad performance because of this two function.

What did you expect to see?
SetReadDeadline/SetWriteDeadline occupy less cpu time.
What did you see instead?
SetReadDeadline/SetWriteDeadline occupy lots of cpu time.
 sandyskies
All 31 comments
Please show us the whole profile and/or show us the code so that we can recreate the problem ourselves. Thanks.
 ianlancetaylor
on 5 Jun 2018
ianlancetaylor
on 5 Jun 2018
@ianlancetaylor Can I upload the svg file?
sandyskies
on 5 Jun 2018
yes, you can uploads the svg file
On 5 June 2018 at 16:55, ChenMingjie notifications@github.com wrote:
@ianlancetaylor https://github.com/ianlancetaylor Can I upload the svg
file?—
You are receiving this because you are subscribed to this thread.
Reply to this email directly, view it on GitHub
https://github.com/golang/go/issues/25729#issuecomment-394601816, or mute
the thread
https://github.com/notifications/unsubscribe-auth/AAAcA-q5Txv7XYhH-3Lk8XxECDNeyXmhks5t5it2gaJpZM4UaHJP
.
 davecheney
on 5 Jun 2018
davecheney
on 5 Jun 2018
@ianlancetaylor @davecheney https://github.com/sandyskies/test/blob/master/profile003.svg
sandyskies
on 5 Jun 2018
@sandyskies , could you build and profile the same program under go 1.9 ? This may be related to #15133
The svg file shows the program spends 15% of CPU time in a send syscall and 20% of CPU time in conn.SetWriteDeadline. The send syscall is usually fast, so it's usually OK if its' time share is comparable to conn.SetWriteDeadline time share.
It looks like the program calls tars/transport.ConnectHandler.send too frequently (hundreds thousands or even a million calls per second). Probably it would be better optimizing the program by reducing the frequency of tars/transport.ConnectHandler.send calls. For instance, process requests in batches. Additionally, conn.SetWriteDeadline may be called on each connection every timeout / 10 seconds instead of calling it before each send syscall. But even if conn.SetWriteDeadline overhead is completely eliminated, the program will run faster only by 1/(1-0.2) = 1.25 times.
 valyala
on 5 Jun 2018
valyala
on 5 Jun 2018
@valyala Thanks for the answer. I have run it under go 1.9,and have a worse performance, because of the muti cpu timmer problem in the issue that u mentioned, I have to upgrade to 1.10 . I mentioned in my issue than I am performing a benchmark ,it's a sever and client model, which client send some data to server ,and server simply sends back. transport.ConnectHandler.send is the function that server use to sends the data back to client . Because it is a shot connection ,So I have to use SetDeadline in every socket/connection . Benchmark is use in this case ,so I should not change the program logic I used.
sandyskies
on 5 Jun 2018
Hello,
I had an opportunity to spend some time with the OP last week and I believe the following benchmark reproduces the issue they are seeing.
package ptheadwait

import (
        "io"
        "net"
        "testing"
        "time"
)

const BUFSIZ = 4096

func BenchmarkSetDeadline(b *testing.B) {
        l, err := net.Listen("tcp", "127.0.0.1:0")
        check(b, err)
        defer l.Close()
        go func() {
                c, err := l.Accept()
                check(b, err)
                _, err = io.Copy(c, c)
                check(b, err)
        }()
        c, err := net.Dial("tcp", l.Addr().String())
        check(b, err)

        b.ReportAllocs()
        b.SetBytes(BUFSIZ)
        b.ResetTimer()

        var buf [BUFSIZ]byte
        deadline := 1 * time.Second
        for i := 0; i < b.N; i++ {
                c.SetWriteDeadline(time.Now().Add(deadline))
                _, err := c.Write(buf[:])
                check(b, err)
                c.SetReadDeadline(time.Now().Add(deadline))
                _, err = c.Read(buf[:])
                check(b, err)
                deadline += 1 * time.Second
        }
}

func check(tb testing.TB, err error) {
        tb.Helper()
        if err != nil {
                tb.Fatal(err)
        }
}
On this laptop I see 18.95% of the time spent in pthread_cond_wait
zapf(~/src/pthreadwait) % go test -bench=.  -benchtime=5s -cpuprofile=c.p
goos: darwin
goarch: amd64
pkg: pthreadwait
BenchmarkSetDeadline-4            200000             37122 ns/op         110.34 MB/s         320 B/op          4 allocs/op
PASS
ok      pthreadwait     8.021s
zapf(~/src/pthreadwait) % go tool pprof -png c.p
Generating report in profile001.png

% go version
go version devel +2e9f0817f0 Tue Oct 30 04:39:53 2018 +0000 darwin/amd64
From the spelunking the OP and I did my interpretation of the trace is thrashing between the goroutine that owns the timer and the main goroutine which is needs to wake the former so it can wrestle control of the lock over the timer wheel.
davecheney
on 30 Oct 2018
Some results on a different laptop
(~/src/pthreadtest) % go1.9 test -bench=. -cpu=1,2,4,8 -benchtime=5s
goos: darwin
goarch: amd64
pkg: pthreadtest
BenchmarkSetDeadline              200000             35134 ns/op         116.58 MB/s         288 B/op          4 allocs/op
BenchmarkSetDeadline-2            200000             34476 ns/op         118.80 MB/s         288 B/op          4 allocs/op
BenchmarkSetDeadline-4            200000             30776 ns/op         133.09 MB/s         288 B/op          4 allocs/op
BenchmarkSetDeadline-8            200000             30638 ns/op         133.69 MB/s         288 B/op          4 allocs/op
PASS
ok      pthreadtest     27.563s
(~/src/pthreadtest) % go1.11 test -bench=. -cpu=1,2,4,8 -benchtime=5s
goos: darwin
goarch: amd64
pkg: pthreadtest
BenchmarkSetDeadline              200000             37773 ns/op         108.44 MB/s         320 B/op          4 allocs/op
BenchmarkSetDeadline-2            200000             37212 ns/op         110.07 MB/s         320 B/op          4 allocs/op
BenchmarkSetDeadline-4            200000             33654 ns/op         121.71 MB/s         320 B/op          4 allocs/op
BenchmarkSetDeadline-8            200000             33783 ns/op         121.24 MB/s         320 B/op          4 allocs/op
PASS
ok      pthreadtest     29.961s
/cc @ianlancetaylor @dvyukov
davecheney
on 31 Oct 2018
A bunch of things to improve here. I am on it.
 dvyukov
on 31 Oct 2018
dvyukov
on 31 Oct 2018
Change https://golang.org/cl/146342 mentions this issue: runtime: mark poll_runtimeNano and time_runtimeNano as nosplit
 gopherbot
on 31 Oct 2018
gopherbot
on 31 Oct 2018
Change https://golang.org/cl/146340 mentions this issue: runtime, time: refactor startNano handling
gopherbot
on 31 Oct 2018
Change https://golang.org/cl/146345 mentions this issue: runtime: use StorepNoWB instead of atomicstorep in netpoll
gopherbot
on 31 Oct 2018
Change https://golang.org/cl/146339 mentions this issue: runtime: add and use modtimer in netpoll
gopherbot
on 31 Oct 2018
Change https://golang.org/cl/146343 mentions this issue: runtime: execute memory barrier conditionally when changing netpoll timers
gopherbot
on 31 Oct 2018
Change https://golang.org/cl/146337 mentions this issue: runtime: don't wake timeproc needlessly
gopherbot
on 31 Oct 2018
Change https://golang.org/cl/146341 mentions this issue: time: speed up Since and Until
gopherbot
on 31 Oct 2018
Change https://golang.org/cl/146338 mentions this issue: tuntime: don't recreate netpoll timers if they don't change
gopherbot
on 31 Oct 2018
@sandyskies could you post full pprof profile? Or at least the netpoll part. You stripped the most important info. We see that lots of time is spent in descendants of setDeadlineImpl, but we don't see where exactly. setDeadlineImpl itself does not consume any sigfnificant time.
dvyukov
on 31 Oct 2018
@davecheney for your benchmark for the whole series I got:
name           old time/op  new time/op  delta
SetDeadline    34.6µs ± 1%  20.4µs ± 1%  -41.11%  (p=0.008 n=5+5)
SetDeadline-6  24.2µs ± 1%  21.1µs ± 0%  -12.96%  (p=0.008 n=5+5)
and for the standard net conn benchmark and SetDeadline stress:
name                  old time/op  new time/op  delta
TCP4OneShotTimeout    99.0µs ± 2%  87.9µs ± 0%  -11.20%  (p=0.008 n=5+5)
TCP4OneShotTimeout-6  18.6µs ± 1%  17.0µs ± 0%   -8.65%  (p=0.008 n=5+5)
SetReadDeadline        320ns ± 0%   204ns ± 1%  -36.14%  (p=0.016 n=4+5)
SetReadDeadline-6      562ns ± 5%   205ns ± 1%  -63.50%  (p=0.008 n=5+5)
@sandyskies The file seems to be corrupted, it gives me:
This page contains the following errors:
error on line 44 at column 89: Specification mandates value for attribute data-pjax-transient
Below is a rendering of the page up to the first error.
test/profile003.svg at master · sandyskies/test
@dvyukov I try show it as blame in github, and save it as svg file ,and open it with ie explore ,it works fine.
sandyskies
on 1 Nov 2018
Whatever I try to open it, it fails.
Chrome fails with:
This page contains the following errors:
error on line 44 at column 89: Specification mandates value for attribute data-pjax-transient
Below is a rendering of the page up to the first error.
test/profile003.svg at master · sandyskies/test
Firefox fails with:
XML Parsing Error: not well-formed
Location: file:///tmp/profile003.svg
Line Number 44, Column 89:  <meta name="request-id" content="9D4D:44ED:488F43:7E3ACF:5BDADD61" data-pjax-transient>
----------------------------------------------------------------------------------------^
ovenmitts fails with:
Error domain 1 code 41 on line 44 column 89 of file:///tmp/profile003.svg: Specification mandate value for attribute data-pjax-transient
and github webpage fails too:
https://github.com/sandyskies/test/blob/master/profile003.svg
dvyukov
on 1 Nov 2018
Please try
go tool pprof -png $url
This will generate a png which you can upload directly.
On 1 Nov 2018, at 23:49, Dmitry Vyukov notifications@github.com wrote:
Whatever I try to open it, it fails.
Chrome fails with:This page contains the following errors:
error on line 44 at column 89: Specification mandates value for attribute data-pjax-transient
Below is a rendering of the page up to the first error.
test/profile003.svg at master · sandyskies/test
Firefox fails with:XML Parsing Error: not well-formed
Location: file:///tmp/profile003.svg
Line Number 44, Column 89:
----------------------------------------------------------------------------------------^
ovenmitts fails with:Error domain 1 code 41 on line 44 column 89 of file:///tmp/profile003.svg: Specification mandate value for attribute data-pjax-transient
and github webpage fails too:
https://github.com/sandyskies/test/blob/master/profile003.svg—
You are receiving this because you were mentioned.
Reply to this email directly, view it on GitHub, or mute the thread.
davecheney
on 1 Nov 2018
I think the reason is that , git covert the svg file automatically. I put it into a zip file , please check again. @davecheney @dvyukov
profile003.zip
sandyskies
on 2 Nov 2018
This works.
So large fraction of addTimerLocked goes to notewakeup, also lots of contention on timers lock from timerproc. So my patch series can potentially help. You may test the patch series already.
dvyukov
on 2 Nov 2018
@dvyukov thank you very much, this patch set has had a substantial impact on my benchmark.
(~/src/pthreadtest) % benchstat old.txt new.txt
name           old time/op    new time/op    delta
SetDeadline      37.7µs ± 0%    27.4µs ± 1%  -27.31%  (p=0.000 n=20+20)
SetDeadline-2    37.3µs ± 1%    27.5µs ± 1%  -26.23%  (p=0.000 n=15+20)
SetDeadline-4    33.4µs ± 1%    27.4µs ± 1%  -17.96%  (p=0.000 n=19+20)
SetDeadline-8    33.5µs ± 1%    27.4µs ± 1%  -18.24%  (p=0.000 n=19+10)

name           old speed      new speed      delta
SetDeadline     109MB/s ± 0%   149MB/s ± 1%  +37.57%  (p=0.000 n=20+20)
SetDeadline-2   110MB/s ± 1%   149MB/s ± 1%  +35.56%  (p=0.000 n=15+20)
SetDeadline-4   123MB/s ± 1%   149MB/s ± 1%  +21.88%  (p=0.000 n=19+20)
SetDeadline-8   122MB/s ± 1%   150MB/s ± 1%  +22.31%  (p=0.000 n=19+10)

name           old alloc/op   new alloc/op   delta
SetDeadline        320B ± 0%      320B ± 0%     ~     (all equal)
SetDeadline-2      320B ± 0%      320B ± 0%     ~     (all equal)
SetDeadline-4      320B ± 0%      320B ± 0%     ~     (all equal)
SetDeadline-8      320B ± 0%      320B ± 0%     ~     (all equal)

name           old allocs/op  new allocs/op  delta
SetDeadline        4.00 ± 0%      4.00 ± 0%     ~     (all equal)
SetDeadline-2      4.00 ± 0%      4.00 ± 0%     ~     (all equal)
SetDeadline-4      4.00 ± 0%      4.00 ± 0%     ~     (all equal)
SetDeadline-8      4.00 ± 0%      4.00 ± 0%     ~     (all equal)
@dvyukov I've removed the errant allocations in the benchmark (they were coming from the check helper). The updated results are even more promising
(~/src/pthreadtest) % benchstat old.txt new.txt
name           old time/op    new time/op    delta
SetDeadline      34.3µs ± 1%    24.2µs ± 1%  -29.28%  (p=0.000 n=20+20)
SetDeadline-2    34.8µs ± 0%    24.2µs ± 1%  -30.43%  (p=0.000 n=19+20)
SetDeadline-4    29.6µs ± 1%    24.1µs ± 1%  -18.40%  (p=0.000 n=20+20)
SetDeadline-8    29.6µs ± 0%    24.1µs ± 1%  -18.52%  (p=0.000 n=16+20)

name           old speed      new speed      delta
SetDeadline     119MB/s ± 1%   169MB/s ± 1%  +41.40%  (p=0.000 n=20+20)
SetDeadline-2   118MB/s ± 0%   169MB/s ± 1%  +43.74%  (p=0.000 n=19+20)
SetDeadline-4   138MB/s ± 1%   170MB/s ± 1%  +22.55%  (p=0.000 n=20+20)
SetDeadline-8   138MB/s ± 0%   170MB/s ± 1%  +22.72%  (p=0.000 n=16+20)

name           old alloc/op   new alloc/op   delta
SetDeadline       0.00B          0.00B          ~     (all equal)
SetDeadline-2     0.00B          0.00B          ~     (all equal)
SetDeadline-4     0.00B          0.00B          ~     (all equal)
SetDeadline-8     0.00B          0.00B          ~     (all equal)

name           old allocs/op  new allocs/op  delta
SetDeadline        0.00           0.00          ~     (all equal)
SetDeadline-2      0.00           0.00          ~     (all equal)
SetDeadline-4      0.00           0.00          ~     (all equal)
SetDeadline-8      0.00           0.00          ~     (all equal)
Both the improvements in throughput and latency are far less affected by -cpu values. Nice job!
Before (go 1.11)
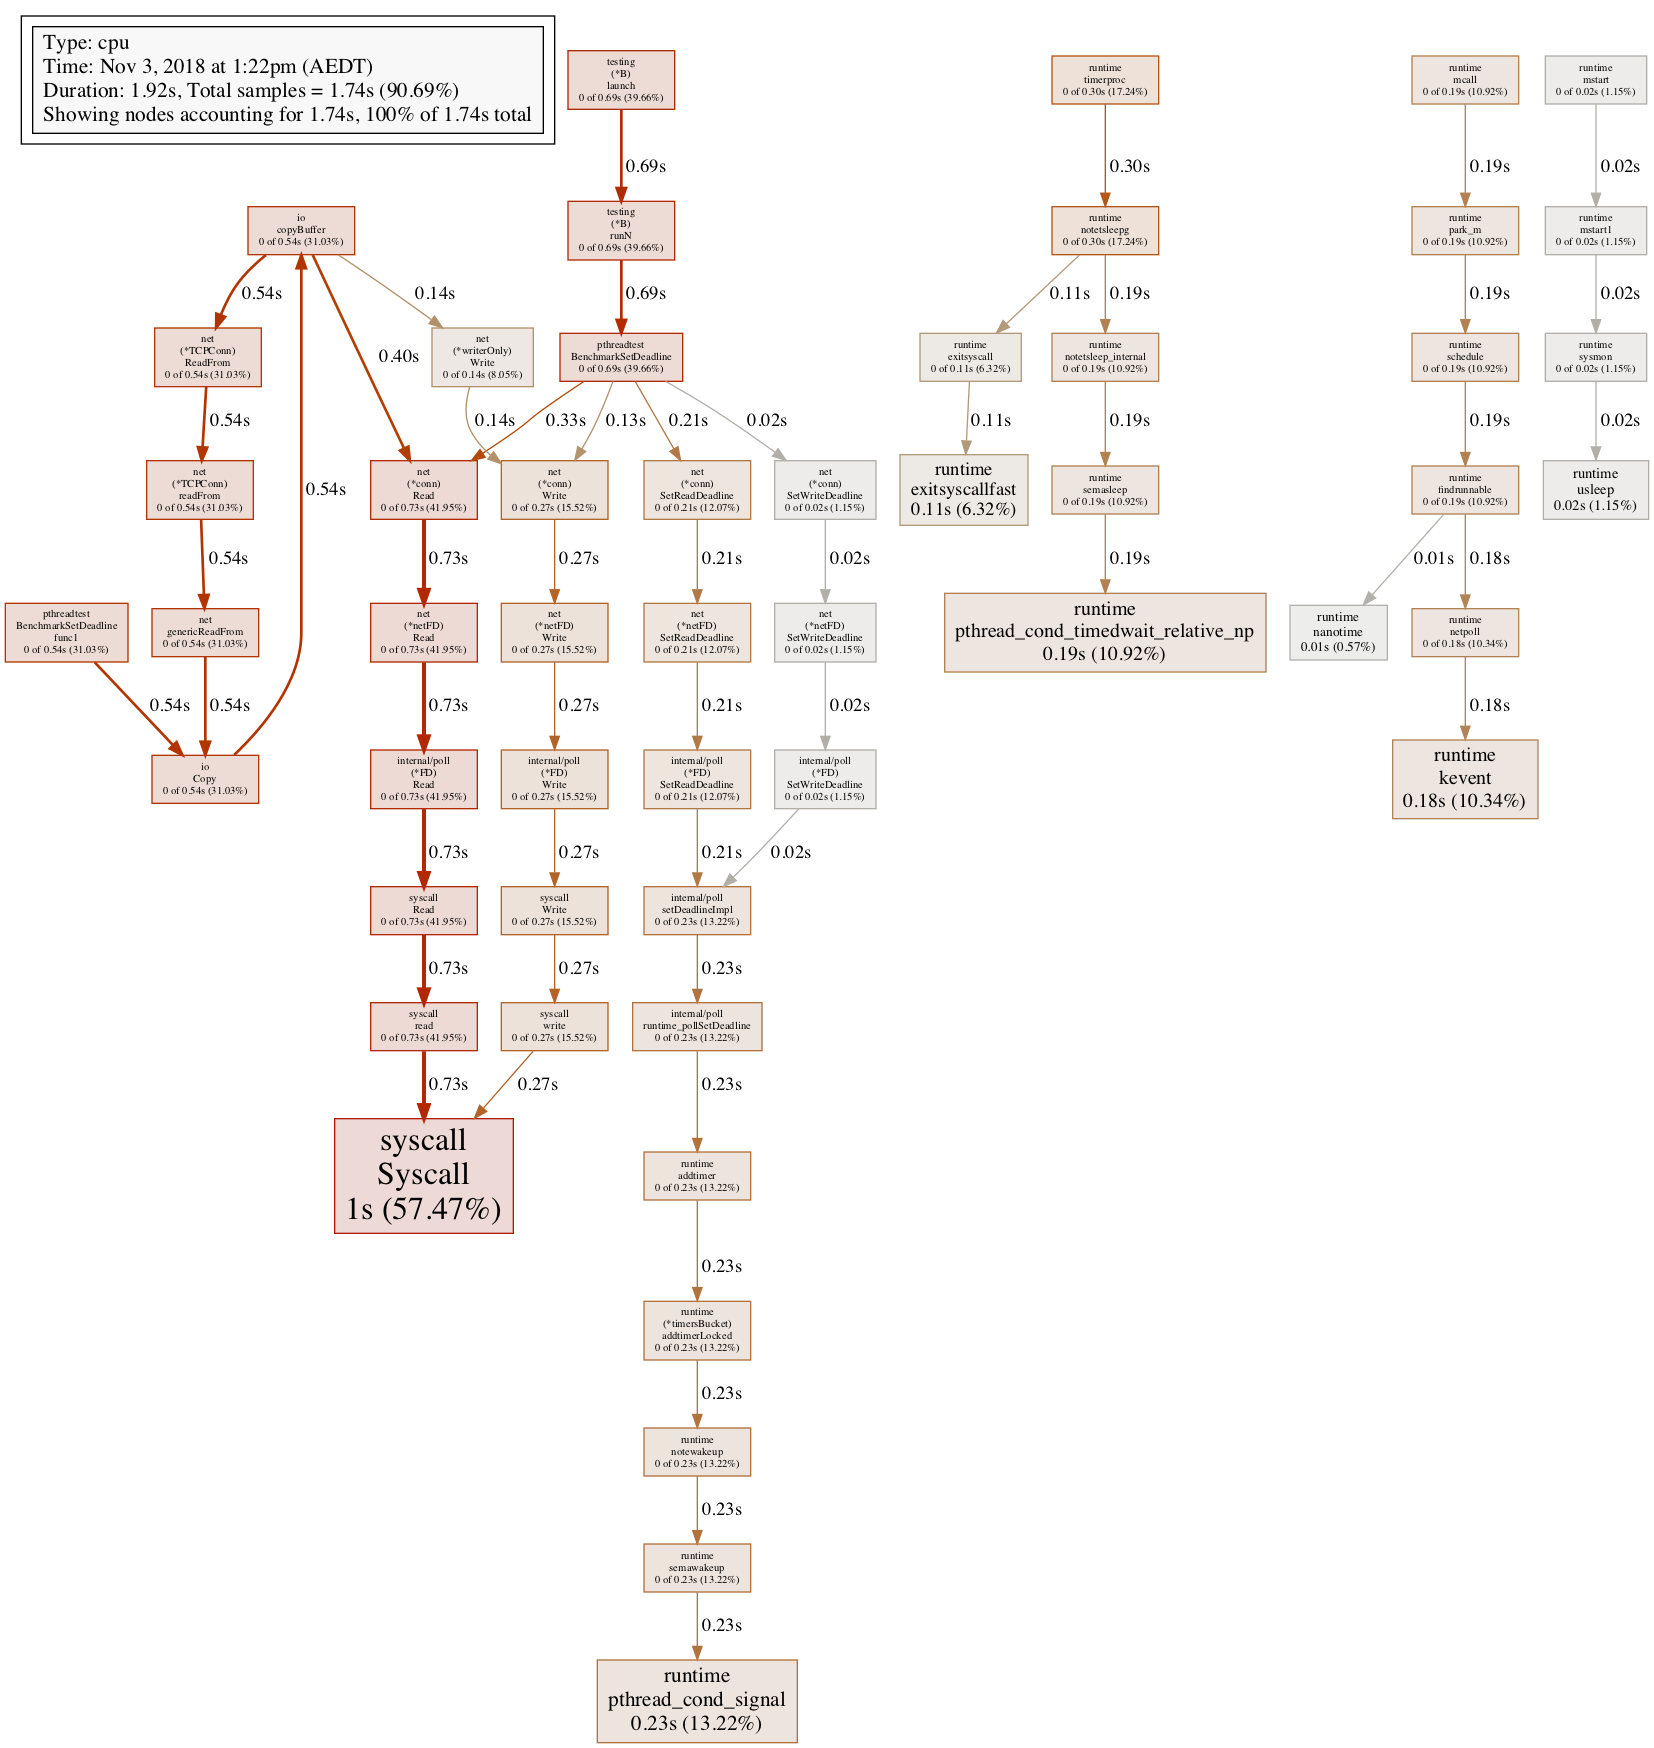
After (tip)

davecheney
on 3 Nov 2018
@dvyukov - Did you have anything else in mind for this issue ?
 agnivade
on 3 Nov 2018
agnivade
on 3 Nov 2018
@agnivade no
@sandyskies please re-open if this does not help, but from your profile it looked like it should
dvyukov
on 3 Nov 2018
Thank u all!
sandyskies
on 4 Nov 2018
Related issues
 mingrammer
·
3Comments
mingrammer
·
3Comments
 go101
·
3Comments
go101
·
3Comments
 myitcv
·
3Comments
myitcv
·
3Comments
 michaelsafyan
·
3Comments
michaelsafyan
·
3Comments
 lkarlslund
·
3Comments
lkarlslund
·
3Comments
Most helpful comment
A bunch of things to improve here. I am on it.