Gluon: High load on some devices after v2017.1.x update
The devices were fine before, but with 2017.1.x high loads appeared. They seem to originate somewhere in the kernelspace.
Only some models are affected, but then all devices of that model experience this issue:
- TP-Link WR842ND v2
- TP-Link WR1043ND v1
- Ubiquiti Nanostation Loco M2
Probably more, but since our Grafana is currently down it's cumbersome to find more.
 mweinelt
All 124 comments
I've seen the issue on a WR841ND (I think it was v9 or v10). Possibly, all models with 32MB are affected?
 NeoRaider
on 22 Oct 2017
NeoRaider
on 22 Oct 2017
Unaffected:
- TP-Link WR841ND v8
- TP-Link WR841ND v10
Partially affected:
- TP-Link WR841ND v9
mweinelt
on 22 Oct 2017
we also noticed that devices with more mesh neighbours are more likely to be affected - what a surprise!
 rotanid
on 22 Oct 2017
rotanid
on 22 Oct 2017
I can confirm that dir Freifunk Nord
 Tarnatos
on 23 Oct 2017
Tarnatos
on 23 Oct 2017
Device loads by model on the FFDA network where load > 2.0
{
  "TP-Link TL-MR3420 v1": [
    8.63
  ],
  "TP-Link TL-WR841N/ND v11": [
    7.85,
    12.47,
    3.44,
    3.9
  ],
  "TP-Link TL-WR940N v4": [
    4.48
  ],
  "Ubiquiti AirRouter": [
    3.09
  ],
  "TP-Link TL-WR710N v1": [
    6.2
  ],
  "TP-Link TL-WR842N/ND v2": [
    2.28,
    12.43,
    8.98,
    15.45,
    8.98,
    3.47,
    7.22,
    10.07,
    12.14,
    9.2,
    7.25,
    8.48,
    2.91,
    6.22,
    8.91,
    3.14,
    2.13,
    9.9,
    10.92
  ],
  "Ubiquiti PicoStation M2": [
    9.97
  ],
  "Linksys WRT160NL": [
    4.69
  ],
  "TP-Link TL-WR710N v2.1": [
    4.19,
    11.26
  ],
  "TP-Link TL-WR1043N/ND v1": [
    6.98,
    3.57,
    6.25,
    2.23,
    5.62
  ],
  "TP-Link TL-WR841N/ND v9": [
    4.98,
    4.55,
    4.08,
    2.67,
    4.89,
    2.57,
    9.66,
    7.81
  ],
  "TP-Link TL-WA850RE v1": [
    7.71
  ],
  "TP-Link TL-WR841N/ND v10": [
    2.87,
    5.32,
    5.59
  ],
  "TP-Link TL-WA901N/ND v3": [
    7.96
  ],
  "Ubiquiti NanoStation loco M2": [
    4.94
  ],
  "TP-Link TL-WR842N/ND v1": [
    2.49
  ]
}
Affected nodes on the FFDA Network grouped by SoC:
AR9341
TP-Link TL-WR842N/ND v2 19
TP-Link TL-WA801N/ND v2 1
TP-Link TL-WA850RE v1 1
QCA9533
TP-Link TL-WR841N/ND v9 7
TP-Link TL-WR841N/ND v10 5
TP-Link TL-WR841N/ND v11 2
AR9132
TP-Link TL-WR1043N/ND v1 4
AR9331
TP-Link TL-WR710N v2.1 2
TP-Link TL-WR710N v1 1
AR7240
Ubiquiti NanoStation loco M2 1
Ubiquiti PicoStation M2 1
AR7241
TP-Link TL-MR3420 v1 1
Ubiquiti AirRouter 1
AR9130
Linksys WRT160NL 1
 blocktrron
on 24 Oct 2017
blocktrron
on 24 Oct 2017
Hi!
I don't got any nodes with a higher load than 0.8 in our network.
we've had these problems when using batman 2017.x first time.. but then a bug with multicast optimization in batman-adv was found. After disabling this in firmware AND at all gateways the load was going down.
Could you please provide these information:
- How many Nodes are on old firmware in your network? (maybe someone can add the first gluon Version without MO to name the affected versions....)
- Which Batmand-adv is running on your Gateways?
- Is Multicast Optimisation activated on gateway level?
I think this could be related. Maybe you could try to update your batman-adv gateways and disable multicast optimizations with "batctl mm 0" (don't forget your mapserver ;))
If the behaviour is related, you could try to eliminate the fulltable orgy by disabling all vpn tunnels for a minute to make the mismarked packages disappear
 A-Kasper
on 25 Oct 2017
A-Kasper
on 25 Oct 2017
- ~700 new (v2017.1.3), ~30 old (v2017.1.2 and earlier)
- batman-adv v2017.3
- yes
Multicast optimizations are still disabled on v2017.1.x, see https://github.com/freifunk-gluon/gluon/commit/c6a3afa1301d0edda4a7eb69a8fc64af220d71d8.
mweinelt
on 25 Oct 2017
I think the MO Bug is still not addressed. As already mentioned our load is in normal range (but we have a smaller network). If you are able to, I would like to ask you to check if the load goes down if you disable MO at all gateways via batctl mm 0 i would like to make sure it's not still this mo thing.....
Our Network went stable after ALL Sources of mismarked packages were eliminated... Gateways had the biggest effect. I'm not sure, but if my memories are correct it was you who had a look at our network dump... if so: can you see these full table requests?
A-Kasper
on 25 Oct 2017
This issue was fixed in https://git.open-mesh.org/batman-adv.git/commit/382d020fe3fa528b1f65f8107df8fc023eb8cacb, no?
mweinelt
on 25 Oct 2017
Am 25.10.2017 14:53 schrieb "hexa-" notifications@github.com:
This issue was fixed in https://git.open-mesh.org/batman-adv.git/commit/
382d020fe3fa528b1f65f8107df8fc023eb8cacb, no?
My Bauchgefühl still says that a part of the problem is still not fixed.
Wirh mo disabled everwhere we don`t got the load problems. thats why i have
asked you for trying to disable it.
The other idea is, that the mismarked packages from some nodes are enough
to corrubtvthe table of fixed batman versions.
I can't say if this is the point. i just want to make sure that ithis is
not related.
The fix in batman-adv is something like untested. the problem appears just
in big networks, so the feedback goes to zero. They consider it is
fixed... but i don't think that someone dumped the traffic.
I can sure tell you that broken nodes affect the load of the fixed nodes.
A-Kasper
on 26 Oct 2017
Disabled mm on our gateways.
Looking at this node for example at this time of day (3:00)
https://meshviewer.darmstadt.freifunk.net/#/de/map/30b5c2c2ead4
- Model 841 v9
- Load average 4,83
- RAM 74,7% used
json "memory": { "total": 27808, "free": 5236, "buffers": 992, "cached": 1696 }, - Clients 0
- Traffic negligible
5,2 MB of "free" RAM does not seem to be enough if we suspect the issue arises due to high memory fragmentation.
mweinelt
on 27 Oct 2017
thank you for testing.
i'll have a look at free mem tomorrow. I'm interested in why we don't got
this problem anymore.....
Am 27.10.2017 2:57 vorm. schrieb "hexa-" notifications@github.com:
Disabled mm on our gateways.
Looking at this node for example at this time of day (3:00)
https://meshviewer.darmstadt.freifunk.net/#/de/map/30b5c2c2ead4
- Model 841 v9
- Load average 4,83
RAM 74,7% used
"memory": {
"total": 27808,
"free": 5236,
"buffers": 992,
"cached": 1696
},Clients 0
- Traffic neglible
5,2 MB of "free" RAM does not seem to be enough if we suspect the issue
arises due to high memory fragmentation.—
You are receiving this because you commented.
Reply to this email directly, view it on GitHub
https://github.com/freifunk-gluon/gluon/issues/1243#issuecomment-339842442,
or mute the thread
https://github.com/notifications/unsubscribe-auth/AIA7UnQvkNo3fLOux3Dx6JeQXflSxkaqks5swSp7gaJpZM4QBx-M
.
A-Kasper
on 27 Oct 2017
@A-Kasper
1) please try to not comment if you have nothing new to contribute. this makes the whole issue harder and harder to read. you could have waited with your comment until you had a look at your mem.
2) how many nodes does you network have? what about large groups of wireless-meshing-nodes? maybe your network is simply too small to have this issue.
rotanid
on 27 Oct 2017
@mweinelt Do you have any custom ash-scripts running on your nodes?
I have had an ash-script running and my node got slower and slower until logging in via ssh took about a minute. The same happened when a monitoring script logged into the router via SSH and just executed some commands. That's why I think it could be a problem with ash/Busybox. With only lua scripts running on the router executed by micrond everything works as expected.
 CodeFetch
on 31 Oct 2017
CodeFetch
on 31 Oct 2017
@CodeFetch No, we're not running anything custom.
mweinelt
on 31 Oct 2017
perhaps this issue is actually the same as #753 - only that it appears earlier than before
rotanid
on 6 Nov 2017
Looking at the issue by SoC alone does not seem to yield a clear result.
[
  {
    "family": "AR9531",
    "loadavg": 0.17,
    "devices": {
      "TP-Link TL-WR842N/ND v3": 0.17
    }
  },
  {
    "family": "QCA9558",
    "loadavg": 0.18,
    "devices": {
      "TP-Link TL-WR1043N/ND v3": 0.16,
      "TP-Link Archer C7 v2": 0.19,
      "TP-Link TL-WR1043N/ND v2": 0.2,
      "TP-Link Archer C5 v1": 0.21
    }
  },
  {
    "family": "QCA9563",
    "loadavg": 0.19,
    "devices": {
      "TP-Link TL-WR1043N/ND v4": 0.19
    }
  },
  {
    "family": "AR7240",
    "loadavg": 0.67,
    "devices": {
      "Ubiquiti NanoStation loco M2": 0.59,
      "Ubiquiti NanoStation M2": 1.61,
      "TP-Link TL-WA801N/ND v1": 1.25,
      "TP-Link TL-WR740N/ND v4": 1.18,
      "TP-Link TL-WR740N/ND v1": 0.3,
      "TP-Link TL-WA901N/ND v1": 0.04,
      "TP-Link TL-WA830RE v1": 0.17,
      "TP-Link TL-WR741N/ND v1": 0.41,
      "TP-Link TL-WR841N/ND v5": 0.06
    }
  },
  {
    "family": "QCA9533",
    "loadavg": 1.05,
    "devices": {
      "TP-Link TL-WR841N/ND v11": 0.79,
      "TP-Link TL-WR841N/ND v10": 1.18,
      "TP-Link TL-WR841N/ND v9": 1.1
    }
  },
  {
    "family": "AR2316A",
    "loadavg": 1.49,
    "devices": {
      "Ubiquiti PicoStation M2": 1.49
    }
  },
  {
    "family": "AR9344",
    "loadavg": 0.21,
    "devices": {
      "TP-Link CPE210 v1.1": 0.21,
      "TP-Link TL-WDR4300 v1": 0.2,
      "TP-Link CPE210 v1.0": 0.24,
      "TP-Link TL-WDR3600 v1": 0.17
    }
  },
  {
    "family": "AR9341",
    "loadavg": 2.5,
    "devices": {
      "TP-Link TL-WR842N/ND v2": 3.5,
      "TP-Link TL-WA850RE v1": 1.42,
      "TP-Link TL-WR841N/ND v8": 1.25,
      "TP-Link TL-WA801N/ND v2": 0.18,
      "TP-Link TL-WR941N/ND v5": 0.07,
      "TP-Link TL-WA901N/ND v3": 2.26,
      "TP-Link TL-WA860RE v1": 0.15
    }
  },
  {
    "family": "AR9331",
    "loadavg": 2.76,
    "devices": {
      "TP-Link TL-WR710N v2.1": 6.76,
      "TP-Link TL-MR3020 v1": 1.15,
      "TP-Link TL-WR710N v1": 3.62,
      "TP-Link TL-WR741N/ND v4": 0.21,
      "TP-Link TL-WR710N v2": 0.12,
      "TP-Link TL-WA701N/ND v2": 0.61
    }
  },
  {
    "family": "AR9132",
    "loadavg": 1.95,
    "devices": {
      "TP-Link TL-WR1043N/ND v1": 2.51,
      "TP-Link TL-WR941N/ND v2": 0.18,
      "TP-Link TL-WA901N/ND v2": 0.11
    }
  },
  {
    "family": "AR7241",
    "loadavg": 2.56,
    "devices": {
      "TP-Link TL-MR3420 v1": 2.78,
      "TP-Link TL-WR842N/ND v1": 2.12,
      "Ubiquiti AirRouter": 2.77
    }
  },
  {
    "family": "TP9343",
    "loadavg": 1.06,
    "devices": {
      "TP-Link TL-WR941N/ND v6": 0.44,
      "TP-Link TL-WR940N v4": 2.07,
      "TP-Link TL-WA901N/ND v4": 0.07
    }
  },
  {
    "family": "MT7621AT",
    "loadavg": 0.08,
    "devices": {
      "D-Link DIR-860L B1": 0.08
    }
  },
  {
    "family": "AR7161",
    "loadavg": 0.26,
    "devices": {
      "Buffalo WZR-HP-AG300H/WZR-600DHP": 0.26
    }
  },
  {
    "family": "AR1311",
    "loadavg": 0.21,
    "devices": {
      "D-Link DIR-505 rev. A2": 0.21
    }
  },
  {
    "family": "AR9350",
    "loadavg": 0.15,
    "devices": {
      "TP-Link CPE510 v1.0": 0.15,
      "TP-Link CPE510 v1.1": 0.14
    }
  },
  {
    "family": "AR9130",
    "loadavg": 7.59,
    "devices": {
      "Linksys WRT160NL": 7.59
    }
  },
  {
    "family": "AR9342",
    "loadavg": 0.02,
    "devices": {
      "Ubiquiti Loco M XW": 0.02
    }
  }
]
hey All,
on an Ubiquiti NanoStation loco M2 the issue seems to go away when the mesh wlan is deactivated. at least it looks that way since 2 days.
this is kbu freifunk, where the wireless mesh config looks like this
config wifi-iface 'ibss_radio0'
        option ifname 'ibss0'
        option network 'ibss_radio0'
        option device 'radio0'
        option bssid '02:d2:22:01:fc:22'
        option disabled '1'
        option mcast_rate '12000'
        option mode 'adhoc'
        option macaddr '42:84:e7:d9:c1:32'
        option ssid '02:d2:22:01:fc:22'
..ede
 edeso
on 10 Nov 2017
edeso
on 10 Nov 2017
Does this NSM2 Loco have a VPN connection or is it otherwise connected to the Mesh after disabling the WiFi-Mesh?
How big is the batadv L2 domain? Originators? Transtable (global) size?
mweinelt
on 10 Nov 2017
At least the three devices in the original post are all 32MB RAM _and_ 8MB flash devices. Is this ticket a duplicate of #1197 maybe? Or could we somehow separate these two tickets more clearly?
Just a crazy idea... As decently fast microSD cards seem to have gotten quite cheap: I'd be curious whether attaching some flash storage to the USB port of a router and configuring one partition for swap and one for /tmp/ would make a difference. For instance this plus this would cost less than 10€. Maybe there's even a decently fast, usable USB flash stick for less than 5€. Not suggesting this as a fix, but curious whether that'd change anything.
Also, if some people with devices constantly having high loads could recompile with CONFIG_KERNEL_SLABINFO=y and could dump /proc/slabinfo, that could be helpful (I asked for this in #1197, too).
 T-X
on 13 Nov 2017
T-X
on 13 Nov 2017
We tested an image for the 1043v1 without additional USB modules, that are currently being loaded unconditionally - and the device seemed to behave fine again.
@blocktrron can maybe tell us more about what he saw during tests.
mweinelt
on 13 Nov 2017
At Freifunk Darmstadt, we were able to observe that 8MB/32MB devices rebooted frequently, most likely due to additional RAM usage of the integrated USB support.
We were also able to recreate the problems (High load/crashing) on an OpenWRT based Gluon by writing to tmpfs. Crashing/High load only occurred, when RAM was filled before the batman transglobal table was initialized, in case the router was already connected to the mesh.
When the Router ist booted without visible neighbors, then filling RAM and connecting to the Network, the node was not affected by crashing or high load.
blocktrron
on 13 Nov 2017
Fyi: We're building images from master with slabinfo enabled and without additional USB modules tonight. If we can trigger the issue with those, we'll post slabinfo, else we'll retry again with the USB modules installed,
mweinelt
on 14 Nov 2017
From our 1043v1 rebooting in circles:
OOM Reboot
[   90.450092] hotplug-call invoked oom-killer: gfp_mask=0x2420848, order=0, oom_score_adj=0
[   90.458394] CPU: 0 PID: 2327 Comm: hotplug-call Not tainted 4.4.93 #0
[   90.464869] Stack : 803e96e4 00000000 00000001 80440000 807d5764 80434e63 803ca228 00000917
      804a378c 00001b20 00000040 00000000 00000000 800a787c 00000006 00000000
      00000000 00000000 803cdd4c 8172199c 804a6542 800a57f8 02420848 00000000
      00000001 801f9300 00000000 00000000 00000000 00000000 00000000 00000000
      00000000 00000000 00000000 00000000 00000000 00000000 00000000 00000000
      ...
[   90.500943] Call Trace:
[   90.503422] [<80071f1c>] show_stack+0x54/0x88
[   90.507826] [<800d498c>] dump_header.isra.4+0x48/0x130
[   90.513003] [<800d515c>] check_panic_on_oom+0x48/0x84
[   90.518102] [<800d5288>] out_of_memory+0xf0/0x324
[   90.522847] [<800d8da0>] __alloc_pages_nodemask+0x6b8/0x724
[   90.528488] [<800d1b44>] pagecache_get_page+0x154/0x278
[   90.533765] [<80136e94>] __getblk_slow+0x15c/0x374
[   90.538617] [<8015e518>] squashfs_read_data+0x1c8/0x6e8
[   90.543888] [<80162728>] squashfs_readpage_block+0x32c/0x4d8
[   90.549602] [<801603a4>] squashfs_readpage+0x5bc/0x6d0
[   90.554780] [<800dc53c>] __do_page_cache_readahead+0x1f8/0x264
[   90.560673] [<800d393c>] filemap_fault+0x1ac/0x458
[   90.565526] [<800eeb4c>] __do_fault+0x3c/0xa8
[   90.569925] [<800f1d84>] handle_mm_fault+0x478/0xb14
[   90.574934] [<80076be8>] __do_page_fault+0x134/0x470
[   90.579944] [<80060820>] ret_from_exception+0x0/0x10
[   90.584933]
[   90.586446] Mem-Info:
[   90.588769] active_anon:820 inactive_anon:9 isolated_anon:0
[   90.588769]  active_file:136 inactive_file:154 isolated_file:0
[   90.588769]  unevictable:0 dirty:0 writeback:0 unstable:0
[   90.588769]  slab_reclaimable:211 slab_unreclaimable:3104
[   90.588769]  mapped:59 shmem:29 pagetables:104 bounce:0
[   90.588769]  free:293 free_pcp:0 free_cma:0
[   90.620556] Normal free:1172kB min:1024kB low:1280kB high:1536kB active_anon:3280kB inactive_anon:36kB active_file:544kB inactive_file:616kB unevictable:0kB isolated(anon):0kB isolated(file):0kB present:32768kB managed:27776kB mlocked:0kB dirty:0kB writeback:0kB mapped:236kB shmem:116kB slab_reclaimable:844kB slab_unreclaimable:12416kB kernel_stack:472kB pagetables:416kB unstable:0kB bounce:0kB free_pcp:0kB local_pcp:0kB free_cma:0kB writeback_tmp:0kB pages_scanned:6972 all_unreclaimable? yes
[   90.664376] lowmem_reserve[]: 0 0
[   90.667738] Normal: 49*4kB (UME) 80*8kB (UME) 13*16kB (UME) 4*32kB (M) 0*64kB 0*128kB 0*256kB 0*512kB 0*1024kB 0*2048kB 0*4096kB = 1172kB
[   90.680287] 319 total pagecache pages
[   90.683970] 0 pages in swap cache
[   90.687314] Swap cache stats: add 0, delete 0, find 0/0
[   90.692565] Free swap  = 0kB
[   90.695472] Total swap = 0kB
[   90.698373] 8192 pages RAM
[   90.701093] 0 pages HighMem/MovableOnly
[   90.704947] 1248 pages reserved
[   90.708117] [ pid ]   uid  tgid total_vm      rss nr_ptes nr_pmds swapents oom_score_adj name
[   90.716721] [  515]     0   515      297       49       3       0        0             0 ubusd
[   90.725384] [  516]     0   516      296       40       4       0        0             0 ash
[   90.733889] [  807]     0   807      306       68       4       0        0             0 logd
[   90.742477] [  814]     0   814      429      189       4       0        0             0 haveged
[   90.751328] [ 1055]     0  1055      447       82       4       0        0             0 netifd
[   90.760092] [ 1102]     0  1102      264       40       3       0        0             0 dropbear
[   90.769029] [ 1119]     0  1119      225       42       3       0        0             0 uradvd
[   90.777794] [ 1330]     0  1330      296       39       4       0        0             0 udhcpc
[   90.786557] [ 1332]     0  1332      254       44       3       0        0             0 odhcp6c
[   90.795396] [ 1343]     0  1343      254       49       3       0        0             0 odhcp6c
[   90.804250] [ 1487]     0  1487      225       44       4       0        0             0 micrond
[   90.813101] [ 1521]     0  1521      224       39       3       0        0             0 sse-multiplexd
[   90.822562] [ 1685]     0  1685      320       50       3       0        0             0 uhttpd
[   90.831325] [ 1794]     0  1794      383       76       3       0        0             0 hostapd
[   90.840177] [ 1809]   453  1809      353      137       4       0        0             0 dnsmasq
[   90.849033] [ 1830]     0  1830      280       52       4       0        0             0 dnsmasq
[   90.857887] [ 2116]     0  2116      320       63       4       0        0             0 fastd
[   90.866563] [ 2213]     0  2213      517       71       3       0        0             0 respondd
[   90.875502] [ 2223]     0  2223      306       50       3       0        0             0 hotplug-call
[   90.884777] [ 2295]     0  2295      296       40       3       0        0             0 ntpd
[   90.893369] [ 2326]     0  2326      327       75       4       0        0             0 dhcpv6.script
[   90.902742] [ 2327]     0  2327      306       47       3       0        0             0 hotplug-call
[   90.912030] [ 2332]     0  2332      326       72       4       0        0             0 gluon-respondd
[   90.921492] [ 2342]     0  2342      326       71       4       0        0             0 gluon-respondd
[   90.930952] [ 2343]     0  2343      326       71       4       0        0             0 gluon-respondd
[   90.940413] [ 2345]     0  2345      293       62       3       0        0             0 jsonfilter
[   90.949525] [ 2346]     0  2346      212       42       3       0        0             0 ubus
[   90.958114] [ 2349]     0  2349      382       60       4       0        0             0 procd
[   90.966786] Kernel panic - not syncing: Out of memory: system-wide panic_on_oom is enabled
[   90.966786]
[   90.980773] Rebooting in 3 seconds..
Slabinfo
slabinfo - version: 2.1
# name            <active_objs> <num_objs> <objsize> <objperslab> <pagesperslab> : tunables <limit> <batchcount> <sharedfactor> : slabdata <active_slabs> <num_slabs> <sharedavail>
mesh_rmc                0     0     72    56  1  :  tunables  0  0  0  :  slabdata  0    0    0
nf-frags                0     0     184   22  1  :  tunables  0  0  0  :  slabdata  0    0    0
nf_conntrack_1          7     15    264   15  1  :  tunables  0  0  0  :  slabdata  1    1    0
nf_conntrack_expect     0     0     208   19  1  :  tunables  0  0  0  :  slabdata  0    0    0
fq_flow_cache           0     0     112   36  1  :  tunables  0  0  0  :  slabdata  0    0    0
batadv_tt_roam_cache    0     0     96    42  1  :  tunables  0  0  0  :  slabdata  0    0    0
batadv_tt_req_cache     0     0     96    42  1  :  tunables  0  0  0  :  slabdata  0    0    0
batadv_tt_change_cache  0     64    64    64  1  :  tunables  0  0  0  :  slabdata  1    1    0
batadv_tt_orig_cache    0     0     96    42  1  :  tunables  0  0  0  :  slabdata  0    0    0
batadv_tg_cache         0     0     96    42  1  :  tunables  0  0  0  :  slabdata  0    0    0
batadv_tl_cache         2     42    96    42  1  :  tunables  0  0  0  :  slabdata  1    1    0
sd_ext_cdb              2     51    80    51  1  :  tunables  0  0  0  :  slabdata  1    1    0
sgpool-128              2     15    2112  15  8  :  tunables  0  0  0  :  slabdata  1    1    0
sgpool-64               2     15    1088  15  4  :  tunables  0  0  0  :  slabdata  1    1    0
sgpool-32               2     14    576   14  2  :  tunables  0  0  0  :  slabdata  1    1    0
sgpool-16               2     12    320   12  1  :  tunables  0  0  0  :  slabdata  1    1    0
sgpool-8                2     21    192   21  1  :  tunables  0  0  0  :  slabdata  1    1    0
scsi_data_buffer        0     0     64    64  1  :  tunables  0  0  0  :  slabdata  0    0    0
bridge_fdb_cache        11    42    96    42  1  :  tunables  0  0  0  :  slabdata  1    1    0
ip6-frags               0     0     184   22  1  :  tunables  0  0  0  :  slabdata  0    0    0
fib6_nodes              21    42    96    42  1  :  tunables  0  0  0  :  slabdata  1    1    0
ip6_dst_cache           44    56    288   14  1  :  tunables  0  0  0  :  slabdata  4    4    0
ip6_mrt_cache           0     0     160   25  1  :  tunables  0  0  0  :  slabdata  0    0    0
PINGv6                  0     0     832   19  4  :  tunables  0  0  0  :  slabdata  0    0    0
RAWv6                   8     19    832   19  4  :  tunables  0  0  0  :  slabdata  1    1    0
UDPLITEv6               0     0     800   10  2  :  tunables  0  0  0  :  slabdata  0    0    0
UDPv6                   4     10    800   10  2  :  tunables  0  0  0  :  slabdata  1    1    0
tw_sock_TCPv6           0     0     232   17  1  :  tunables  0  0  0  :  slabdata  0    0    0
request_sock_TCPv6      0     0     280   14  1  :  tunables  0  0  0  :  slabdata  0    0    0
TCPv6                   1     10    1536  10  4  :  tunables  0  0  0  :  slabdata  1    1    0
jffs2_xattr_ref         0     0     72    56  1  :  tunables  0  0  0  :  slabdata  0    0    0
jffs2_xattr_datum       0     0     104   39  1  :  tunables  0  0  0  :  slabdata  0    0    0
jffs2_inode_cache       165   168   72    56  1  :  tunables  0  0  0  :  slabdata  3    3    0
jffs2_node_frag         63    112   72    56  1  :  tunables  0  0  0  :  slabdata  2    2    0
jffs2_refblock          96    104   296   13  1  :  tunables  0  0  0  :  slabdata  8    8    0
jffs2_tmp_dnode         0     51    80    51  1  :  tunables  0  0  0  :  slabdata  1    1    0
jffs2_raw_inode         0     32    128   32  1  :  tunables  0  0  0  :  slabdata  1    1    0
jffs2_raw_dirent        0     42    96    42  1  :  tunables  0  0  0  :  slabdata  1    1    0
jffs2_full_dnode        131   192   64    64  1  :  tunables  0  0  0  :  slabdata  3    3    0
jffs2_i                 87    88    368   11  1  :  tunables  0  0  0  :  slabdata  8    8    0
squashfs_inode_cache    611   620   384   10  1  :  tunables  0  0  0  :  slabdata  62   62   0
fasync_cache            4     56    72    56  1  :  tunables  0  0  0  :  slabdata  1    1    0
posix_timers_cache      0     0     200   20  1  :  tunables  0  0  0  :  slabdata  0    0    0
UNIX                    15    26    608   13  2  :  tunables  0  0  0  :  slabdata  2    2    0
ip4-frags               0     0     168   24  1  :  tunables  0  0  0  :  slabdata  0    0    0
ip_mrt_cache            0     0     160   25  1  :  tunables  0  0  0  :  slabdata  0    0    0
UDP-Lite                0     0     704   11  2  :  tunables  0  0  0  :  slabdata  0    0    0
tcp_bind_bucket         1     42    96    42  1  :  tunables  0  0  0  :  slabdata  1    1    0
inet_peer_cache         2     21    192   21  1  :  tunables  0  0  0  :  slabdata  1    1    0
secpath_cache           0     0     96    42  1  :  tunables  0  0  0  :  slabdata  0    0    0
flow_cache              0     0     152   26  1  :  tunables  0  0  0  :  slabdata  0    0    0
xfrm_dst_cache          0     0     320   12  1  :  tunables  0  0  0  :  slabdata  0    0    0
ip_fib_trie             13    51    80    51  1  :  tunables  0  0  0  :  slabdata  1    1    0
ip_fib_alias            14    51    80    51  1  :  tunables  0  0  0  :  slabdata  1    1    0
ip_dst_cache            1     21    192   21  1  :  tunables  0  0  0  :  slabdata  1    1    0
PING                    0     0     672   12  2  :  tunables  0  0  0  :  slabdata  0    0    0
RAW                     2     12    672   12  2  :  tunables  0  0  0  :  slabdata  1    1    0
UDP                     1     11    704   11  2  :  tunables  0  0  0  :  slabdata  1    1    0
tw_sock_TCP             0     0     232   17  1  :  tunables  0  0  0  :  slabdata  0    0    0
request_sock_TCP        0     0     280   14  1  :  tunables  0  0  0  :  slabdata  0    0    0
TCP                     1     11    1408  11  4  :  tunables  0  0  0  :  slabdata  1    1    0
eventpoll_pwq           28    51    80    51  1  :  tunables  0  0  0  :  slabdata  1    1    0
eventpoll_epi           28    64    128   32  1  :  tunables  0  0  0  :  slabdata  2    2    0
inotify_inode_mark      0     0     96    42  1  :  tunables  0  0  0  :  slabdata  0    0    0
blkdev_queue            6     8     976   8   2  :  tunables  0  0  0  :  slabdata  1    1    0
blkdev_requests         24    32    256   16  1  :  tunables  0  0  0  :  slabdata  2    2    0
blkdev_ioc              3     39    104   39  1  :  tunables  0  0  0  :  slabdata  1    1    0
bio-0                   14    64    256   16  1  :  tunables  0  0  0  :  slabdata  4    4    0
biovec-256              14    20    3136  10  8  :  tunables  0  0  0  :  slabdata  2    2    0
biovec-128              0     0     1600  10  4  :  tunables  0  0  0  :  slabdata  0    0    0
biovec-64               0     0     832   19  4  :  tunables  0  0  0  :  slabdata  0    0    0
biovec-16               0     0     256   16  1  :  tunables  0  0  0  :  slabdata  0    0    0
uid_cache               0     0     96    42  1  :  tunables  0  0  0  :  slabdata  0    0    0
sock_inode_cache        44    60    384   10  1  :  tunables  0  0  0  :  slabdata  6    6    0
skbuff_fclone_cache     0     0     448   9   1  :  tunables  0  0  0  :  slabdata  0    0    0
skbuff_head_cache       258   304   256   16  1  :  tunables  0  0  0  :  slabdata  19   19   0
file_lock_cache         0     24    168   24  1  :  tunables  0  0  0  :  slabdata  1    1    0
file_lock_ctx           19    56    72    56  1  :  tunables  0  0  0  :  slabdata  1    1    0
shmem_inode_cache       153   154   360   11  1  :  tunables  0  0  0  :  slabdata  14   14   0
pool_workqueue          6     8     512   8   1  :  tunables  0  0  0  :  slabdata  1    1    0
proc_inode_cache        413   418   360   11  1  :  tunables  0  0  0  :  slabdata  38   38   0
sigqueue                0     21    192   21  1  :  tunables  0  0  0  :  slabdata  1    1    0
bdev_cache              4     9     448   9   1  :  tunables  0  0  0  :  slabdata  1    1    0
kernfs_node_cache       9232  9248  128   32  1  :  tunables  0  0  0  :  slabdata  289  289  0
mnt_cache               22    32    256   16  1  :  tunables  0  0  0  :  slabdata  2    2    0
filp                    238   294   192   21  1  :  tunables  0  0  0  :  slabdata  14   14   0
inode_cache             1396  1404  328   12  1  :  tunables  0  0  0  :  slabdata  117  117  0
dentry                  3509  3520  184   22  1  :  tunables  0  0  0  :  slabdata  160  160  0
names_cache             3     7     4160  7   8  :  tunables  0  0  0  :  slabdata  1    1    0
buffer_head             2472  2484  112   36  1  :  tunables  0  0  0  :  slabdata  69   69   0
nsproxy                 0     0     72    56  1  :  tunables  0  0  0  :  slabdata  0    0    0
vm_area_struct          446   540   136   30  1  :  tunables  0  0  0  :  slabdata  18   18   0
mm_struct               32    57    416   19  2  :  tunables  0  0  0  :  slabdata  3    3    0
fs_cache                30    84    96    42  1  :  tunables  0  0  0  :  slabdata  2    2    0
files_cache             31    64    256   16  1  :  tunables  0  0  0  :  slabdata  4    4    0
signal_cache            60    84    576   14  2  :  tunables  0  0  0  :  slabdata  6    6    0
sighand_cache           60    80    3136  10  8  :  tunables  0  0  0  :  slabdata  8    8    0
task_struct             60    72    1336  12  4  :  tunables  0  0  0  :  slabdata  6    6    0
cred_jar                92    125   160   25  1  :  tunables  0  0  0  :  slabdata  5    5    0
anon_vma_chain          310   510   80    51  1  :  tunables  0  0  0  :  slabdata  10   10   0
anon_vma                228   357   80    51  1  :  tunables  0  0  0  :  slabdata  7    7    0
pid                     63    126   96    42  1  :  tunables  0  0  0  :  slabdata  3    3    0
radix_tree_node         206   209   352   11  1  :  tunables  0  0  0  :  slabdata  19   19   0
idr_layer_cache         72    84    1112  14  4  :  tunables  0  0  0  :  slabdata  6    6    0
kmalloc-8192            10    12    8320  3   8  :  tunables  0  0  0  :  slabdata  4    4    0
kmalloc-4096            543   560   4224  7   8  :  tunables  0  0  0  :  slabdata  80   80   0
kmalloc-2048            84    90    2176  15  8  :  tunables  0  0  0  :  slabdata  6    6    0
kmalloc-1024            131   140   1152  14  4  :  tunables  0  0  0  :  slabdata  10   10   0
kmalloc-512             447   456   640   12  2  :  tunables  0  0  0  :  slabdata  38   38   0
kmalloc-256             359   370   384   10  1  :  tunables  0  0  0  :  slabdata  37   37   0
kmalloc-128             8162  8192  256   16  1  :  tunables  0  0  0  :  slabdata  512  512  0
kmem_cache_node         113   128   128   32  1  :  tunables  0  0  0  :  slabdata  4    4    0
kmem_cache              113   128   256   16  1  :  tunables  0  0  0  :  slabdata  8    8    0
Behaviour does not improve when:
- removing
fq_codeland usingpfifo_fast - disabling Airtime Fairness
Memory usage on the device looks like this after boot and before connecting to the mesh:
root@64283-ranzload:/# echo m > /proc/sysrq-trigger
[   60.205101] sysrq: SysRq : Show Memory
[   60.208967] Mem-Info:
[   60.211292] active_anon:641 inactive_anon:8 isolated_anon:0
[   60.211292]  active_file:538 inactive_file:261 isolated_file:0
[   60.211292]  unevictable:0 dirty:0 writeback:0 unstable:0
[   60.211292]  slab_reclaimable:474 slab_unreclaimable:2651
[   60.211292]  mapped:379 shmem:22 pagetables:78 bounce:0
[   60.211292]  free:472 free_pcp:0 free_cma:0
[   60.243091] Normal free:1888kB min:1024kB low:1280kB high:1536kB active_anon:2564kB inactive_anon:32kB active_file:2152kB inactive_file:1044kB unevictable:0kB isolated(anon):0kB isolated(file):0kB present:32768kB managed:27776kB mlocked:0kB dirty:0kB writeback:0kB mapped:1516kB shmem:88kB slab_reclaimable:1896kB slab_unreclaimable:10604kB kernel_stack:424kB pagetables:312kB unstable:0kB bounce:0kB free_pcp:0kB local_pcp:0kB free_cma:0kB writeback_tmp:0kB pages_scanned:0 all_unreclaimable? no
[   60.286822] lowmem_reserve[]: 0 0
[   60.290173] Normal: 24*4kB (U) 84*8kB (UM) 70*16kB (U) 0*32kB 0*64kB 0*128kB 0*256kB 0*512kB 0*1024kB 0*2048kB 0*4096kB = 1888kB
[   60.301938] 821 total pagecache pages
[   60.305632] 0 pages in swap cache
[   60.308970] Swap cache stats: add 0, delete 0, find 0/0
[   60.314223] Free swap  = 0kB
[   60.317130] Total swap = 0kB
[   60.320022] 8192 pages RAM
[   60.322743] 0 pages HighMem/MovableOnly
[   60.326608] 1248 pages reserved
Slabinfo`after bootup, as stated on IRC it looks like the OOM happens as soon as the device connects to the mesh.
slabinfo - version: 2.1
# name            <active_objs> <num_objs> <objsize> <objperslab> <pagesperslab> : tunables <limit> <batchcount> <sharedfactor> : slabdata <active_slabs> <num_slabs> <sharedavail>
mesh_rmc                1023   1064   72    56  1  :  tunables  0  0  0  :  slabdata  19   19   0
nf-frags                0      0      184   22  1  :  tunables  0  0  0  :  slabdata  0    0    0
nf_conntrack_1          7      15     264   15  1  :  tunables  0  0  0  :  slabdata  1    1    0
nf_conntrack_expect     0      0      208   19  1  :  tunables  0  0  0  :  slabdata  0    0    0
fq_flow_cache           0      0      112   36  1  :  tunables  0  0  0  :  slabdata  0    0    0
batadv_tt_roam_cache    0      0      96    42  1  :  tunables  0  0  0  :  slabdata  0    0    0
batadv_tt_req_cache     0      42     96    42  1  :  tunables  0  0  0  :  slabdata  1    1    0
batadv_tt_change_cache  0      64     64    64  1  :  tunables  0  0  0  :  slabdata  1    1    0
batadv_tt_orig_cache    0      0      96    42  1  :  tunables  0  0  0  :  slabdata  0    0    0
batadv_tg_cache         0      0      96    42  1  :  tunables  0  0  0  :  slabdata  0    0    0
batadv_tl_cache         10     42     96    42  1  :  tunables  0  0  0  :  slabdata  1    1    0
sd_ext_cdb              2      51     80    51  1  :  tunables  0  0  0  :  slabdata  1    1    0
sgpool-128              2      15     2112  15  8  :  tunables  0  0  0  :  slabdata  1    1    0
sgpool-64               2      15     1088  15  4  :  tunables  0  0  0  :  slabdata  1    1    0
sgpool-32               2      14     576   14  2  :  tunables  0  0  0  :  slabdata  1    1    0
sgpool-16               2      12     320   12  1  :  tunables  0  0  0  :  slabdata  1    1    0
sgpool-8                2      21     192   21  1  :  tunables  0  0  0  :  slabdata  1    1    0
scsi_data_buffer        0      0      64    64  1  :  tunables  0  0  0  :  slabdata  0    0    0
bridge_fdb_cache        12     42     96    42  1  :  tunables  0  0  0  :  slabdata  1    1    0
ip6-frags               0      0      184   22  1  :  tunables  0  0  0  :  slabdata  0    0    0
fib6_nodes              36     42     96    42  1  :  tunables  0  0  0  :  slabdata  1    1    0
ip6_dst_cache           62     84     288   14  1  :  tunables  0  0  0  :  slabdata  6    6    0
ip6_mrt_cache           0      0      160   25  1  :  tunables  0  0  0  :  slabdata  0    0    0
PINGv6                  0      0      832   19  4  :  tunables  0  0  0  :  slabdata  0    0    0
RAWv6                   8      19     832   19  4  :  tunables  0  0  0  :  slabdata  1    1    0
UDPLITEv6               0      0      800   10  2  :  tunables  0  0  0  :  slabdata  0    0    0
UDPv6                   6      10     800   10  2  :  tunables  0  0  0  :  slabdata  1    1    0
tw_sock_TCPv6           0      0      232   17  1  :  tunables  0  0  0  :  slabdata  0    0    0
request_sock_TCPv6      0      0      280   14  1  :  tunables  0  0  0  :  slabdata  0    0    0
TCPv6                   4      10     1536  10  4  :  tunables  0  0  0  :  slabdata  1    1    0
jffs2_xattr_ref         0      0      72    56  1  :  tunables  0  0  0  :  slabdata  0    0    0
jffs2_xattr_datum       0      0      104   39  1  :  tunables  0  0  0  :  slabdata  0    0    0
jffs2_inode_cache       227    280    72    56  1  :  tunables  0  0  0  :  slabdata  5    5    0
jffs2_node_frag         63     112    72    56  1  :  tunables  0  0  0  :  slabdata  2    2    0
jffs2_refblock          104    104    296   13  1  :  tunables  0  0  0  :  slabdata  8    8    0
jffs2_tmp_dnode         0      51     80    51  1  :  tunables  0  0  0  :  slabdata  1    1    0
jffs2_raw_inode         0      32     128   32  1  :  tunables  0  0  0  :  slabdata  1    1    0
jffs2_raw_dirent        0      42     96    42  1  :  tunables  0  0  0  :  slabdata  1    1    0
jffs2_full_dnode        132    192    64    64  1  :  tunables  0  0  0  :  slabdata  3    3    0
jffs2_i                 88     88     368   11  1  :  tunables  0  0  0  :  slabdata  8    8    0
squashfs_inode_cache    620    620    384   10  1  :  tunables  0  0  0  :  slabdata  62   62   0
fasync_cache            4      56     72    56  1  :  tunables  0  0  0  :  slabdata  1    1    0
posix_timers_cache      0      0      200   20  1  :  tunables  0  0  0  :  slabdata  0    0    0
UNIX                    20     26     608   13  2  :  tunables  0  0  0  :  slabdata  2    2    0
ip4-frags               0      0      168   24  1  :  tunables  0  0  0  :  slabdata  0    0    0
ip_mrt_cache            0      0      160   25  1  :  tunables  0  0  0  :  slabdata  0    0    0
UDP-Lite                0      0      704   11  2  :  tunables  0  0  0  :  slabdata  0    0    0
tcp_bind_bucket         4      42     96    42  1  :  tunables  0  0  0  :  slabdata  1    1    0
inet_peer_cache         1      21     192   21  1  :  tunables  0  0  0  :  slabdata  1    1    0
secpath_cache           0      0      96    42  1  :  tunables  0  0  0  :  slabdata  0    0    0
flow_cache              0      0      152   26  1  :  tunables  0  0  0  :  slabdata  0    0    0
xfrm_dst_cache          0      0      320   12  1  :  tunables  0  0  0  :  slabdata  0    0    0
ip_fib_trie             13     51     80    51  1  :  tunables  0  0  0  :  slabdata  1    1    0
ip_fib_alias            14     51     80    51  1  :  tunables  0  0  0  :  slabdata  1    1    0
ip_dst_cache            1      21     192   21  1  :  tunables  0  0  0  :  slabdata  1    1    0
PING                    0      0      672   12  2  :  tunables  0  0  0  :  slabdata  0    0    0
RAW                     2      12     672   12  2  :  tunables  0  0  0  :  slabdata  1    1    0
UDP                     4      11     704   11  2  :  tunables  0  0  0  :  slabdata  1    1    0
tw_sock_TCP             0      0      232   17  1  :  tunables  0  0  0  :  slabdata  0    0    0
request_sock_TCP        0      0      280   14  1  :  tunables  0  0  0  :  slabdata  0    0    0
TCP                     4      11     1408  11  4  :  tunables  0  0  0  :  slabdata  1    1    0
eventpoll_pwq           30     51     80    51  1  :  tunables  0  0  0  :  slabdata  1    1    0
eventpoll_epi           33     64     128   32  1  :  tunables  0  0  0  :  slabdata  2    2    0
inotify_inode_mark      2      42     96    42  1  :  tunables  0  0  0  :  slabdata  1    1    0
blkdev_queue            6      8      976   8   2  :  tunables  0  0  0  :  slabdata  1    1    0
blkdev_requests         24     32     256   16  1  :  tunables  0  0  0  :  slabdata  2    2    0
blkdev_ioc              2      39     104   39  1  :  tunables  0  0  0  :  slabdata  1    1    0
bio-0                   14     64     256   16  1  :  tunables  0  0  0  :  slabdata  4    4    0
biovec-256              14     20     3136  10  8  :  tunables  0  0  0  :  slabdata  2    2    0
biovec-128              0      0      1600  10  4  :  tunables  0  0  0  :  slabdata  0    0    0
biovec-64               0      0      832   19  4  :  tunables  0  0  0  :  slabdata  0    0    0
biovec-16               0      0      256   16  1  :  tunables  0  0  0  :  slabdata  0    0    0
uid_cache               1      42     96    42  1  :  tunables  0  0  0  :  slabdata  1    1    0
sock_inode_cache        69     80     384   10  1  :  tunables  0  0  0  :  slabdata  8    8    0
skbuff_fclone_cache     0      0      448   9   1  :  tunables  0  0  0  :  slabdata  0    0    0
skbuff_head_cache       622    720    256   16  1  :  tunables  0  0  0  :  slabdata  45   45   0
file_lock_cache         1      24     168   24  1  :  tunables  0  0  0  :  slabdata  1    1    0
file_lock_ctx           19     56     72    56  1  :  tunables  0  0  0  :  slabdata  1    1    0
shmem_inode_cache       162    165    360   11  1  :  tunables  0  0  0  :  slabdata  15   15   0
pool_workqueue          6      8      512   8   1  :  tunables  0  0  0  :  slabdata  1    1    0
proc_inode_cache        7      44     360   11  1  :  tunables  0  0  0  :  slabdata  4    4    0
sigqueue                0      21     192   21  1  :  tunables  0  0  0  :  slabdata  1    1    0
bdev_cache              4      9      448   9   1  :  tunables  0  0  0  :  slabdata  1    1    0
kernfs_node_cache       9267   9280   128   32  1  :  tunables  0  0  0  :  slabdata  290  290  0
mnt_cache               22     32     256   16  1  :  tunables  0  0  0  :  slabdata  2    2    0
filp                    287    420    192   21  1  :  tunables  0  0  0  :  slabdata  20   20   0
inode_cache             796    1032   328   12  1  :  tunables  0  0  0  :  slabdata  86   86   0
dentry                  1966   3432   184   22  1  :  tunables  0  0  0  :  slabdata  156  156  0
names_cache             0      7      4160  7   8  :  tunables  0  0  0  :  slabdata  1    1    0
buffer_head             1008   1008   112   36  1  :  tunables  0  0  0  :  slabdata  28   28   0
nsproxy                 0      0      72    56  1  :  tunables  0  0  0  :  slabdata  0    0    0
vm_area_struct          484    540    136   30  1  :  tunables  0  0  0  :  slabdata  18   18   0
mm_struct               30     57     416   19  2  :  tunables  0  0  0  :  slabdata  3    3    0
fs_cache                29     84     96    42  1  :  tunables  0  0  0  :  slabdata  2    2    0
files_cache             30     64     256   16  1  :  tunables  0  0  0  :  slabdata  4    4    0
signal_cache            59     70     576   14  2  :  tunables  0  0  0  :  slabdata  5    5    0
sighand_cache           59     70     3136  10  8  :  tunables  0  0  0  :  slabdata  7    7    0
task_struct             59     72     1336  12  4  :  tunables  0  0  0  :  slabdata  6    6    0
cred_jar                111    150    160   25  1  :  tunables  0  0  0  :  slabdata  6    6    0
anon_vma_chain          362    459    80    51  1  :  tunables  0  0  0  :  slabdata  9    9    0
anon_vma                269    357    80    51  1  :  tunables  0  0  0  :  slabdata  7    7    0
pid                     64     126    96    42  1  :  tunables  0  0  0  :  slabdata  3    3    0
radix_tree_node         210    220    352   11  1  :  tunables  0  0  0  :  slabdata  20   20   0
idr_layer_cache         82     84     1112  14  4  :  tunables  0  0  0  :  slabdata  6    6    0
kmalloc-8192            13     15     8320  3   8  :  tunables  0  0  0  :  slabdata  5    5    0
kmalloc-4096            649    716    4224  7   8  :  tunables  0  0  0  :  slabdata  134  134  0
kmalloc-2048            84     90     2176  15  8  :  tunables  0  0  0  :  slabdata  6    6    0
kmalloc-1024            144    168    1152  14  4  :  tunables  0  0  0  :  slabdata  12   12   0
kmalloc-512             452    480    640   12  2  :  tunables  0  0  0  :  slabdata  40   40   0
kmalloc-256             1046   1050   384   10  1  :  tunables  0  0  0  :  slabdata  105  105  0
kmalloc-128             12701  12848  256   16  1  :  tunables  0  0  0  :  slabdata  803  803  0
kmem_cache_node         113    128    128   32  1  :  tunables  0  0  0  :  slabdata  4    4    0
kmem_cache              113    128    256   16  1  :  tunables  0  0  0  :  slabdata  8    8    0
testing with a 1043v1 sounds a bit like "trying to fix 2 issues with one shot", since (at least everybody seems to know for sure) that 1043v1 is instable by design, even in CC and BB. (eventhough it's just a hanging wifi, not a high load or a reboot.)
 Adorfer
on 15 Nov 2017
Adorfer
on 15 Nov 2017
On 10.11.2017 16:03, hexa- wrote:
Does this NSM2 Loco have a VPN connection or is it otherwise connected to the Mesh after disabling the WiFi-Mesh?
fastd is disabled. batman meshes on wan. there is an x86 offloader doing the fastd vpn.
How big is the batadv L2 domain? Originators? Transtable (global) size?
not in my area of expertise. do you have some commands you want me to run?
i am talking about this node, which is w/o symptoms since then
https://map.kbu.freifunk.net/#!v:m;n:6872513e82a7
..ede
edeso
on 15 Nov 2017
@edeso So neither VPN nor WiFi-Mesh, that in itself should reduce memory usage quite a bit. However that's not the most prominent use case of these devices, but we can try and confirm that this stabilizes the device.
@Adorfer You are acknowledging that it's the WiFi that hangs on said device, however this issue is entirely related to memory usage, load and oom reboots.
The device currently reboots every minute, so I don't think WiFi hangs play into this issue, and I can easily take the WiFi out of the equation and still have it crash.
mweinelt
on 15 Nov 2017
On 15.11.2017 13:40, hexa- wrote:
@edeso https://github.com/edeso So neither VPN nor WiFi-Mesh, that in itself should reduce memory usage quite a bit. However that's not the most prominent use case of these devices, but we can try and confirm that this stabilizes the device.
well, the device _didn't_ run vpn before as well but had huge blocking load issues. so i tried beside other things disabling mesh, just to try it out (disabling non essentials, see if something changes [1]).
wireless meshing is not that important for this node as it primarily serves a train station where the likelyhood of finding a mesh node is very low by nature.
also, top did report free ram, but the load was something like
Mem: 19780K used, 8028K free, 92K shrd, 1288K buff, 2748K cached
CPU: 3% usr 92% sys 0% nic 0% idle 0% io 0% irq 3% sirq
Load average: 4.34 4.68 5.06 4/52 4074
PID PPID USER STAT VSZ %VSZ %CPU COMMAND
2698 2 root RW 0 0% 90% [kworker/u2:2]
3 2 root RW 0 0% 2% [ksoftirqd/0]
4033 2 root RW 0 0% 2% [kworker/u2:4]
...
..ede
[1] also tried, but w/o any success load wise
- disabling the logd
- minimizing hostapd logging
- having the node restart the network periodically via cron
- having the node restart wifi periodically via cron
edeso
on 15 Nov 2017
Collected slabinfo and sysrq-m outputs on a TL-WR1043ND-v1
- 2016.2.7: https://git.darmstadt.ccc.de/snippets/11
- master (20171114): https://git.darmstadt.ccc.de/snippets/12
mweinelt
on 18 Nov 2017
Unaffected:
TP-Link WR841ND v10
I have seen occasional high load on my WR841N/ND v10 with Gluon 2017.1.x. Are you sure it is not affected?
 RalfJung
on 19 Nov 2017
RalfJung
on 19 Nov 2017
@RalfJung maybe one in ten.
mweinelt
on 19 Nov 2017
UPDATE on the node w/ disabled mesh wlan. today it showed the symptoms again and only a reboot made it go away. so obviously it only mitigates but does not solve the this issue.
..ede
edeso
on 22 Nov 2017
In the Nordwest Freifunk network we can detect this issue as well:
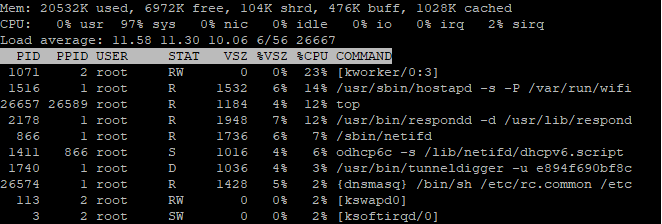
Mem: 19164K used, 8628K free, 116K shrd, 788K buff, 1316K cached
CPU:   1% usr  90% sys   0% nic   0% idle   0% io   0% irq   8% sirq
Load average: 5.13 4.66 3.03 4/60 8719
  PID  PPID USER     STAT   VSZ %VSZ %CPU COMMAND
 7412     2 root     RW       0   0%  21% [kworker/0:0]
 3063     1 root     R     2148   8%  10% /usr/bin/respondd -d /usr/lib/respond
 8704  8285 root     R     1184   4%   5% top
 8680  8677 root     S     1932   7%   5% {hoodselector} /usr/bin/lua /usr/sbin
 2415     1 root     S     1276   5%   4% /usr/bin/fastd --config - --daemon --
 2871     1 root     S     1532   6%   3% /usr/sbin/hostapd -s -P /var/run/wifi
 2573  1062 root     S     1016   4%   3% odhcp6c -s /lib/netifd/dhcpv6.script
    3     2 root     SW       0   0%   2% [ksoftirqd/0]
  106     2 root     SW       0   0%   2% [kswapd0]
- Device: TP-Link TL-WR841N/ND v11
- Gluon-Version: v2017.1.x
- Commit ID: 2ae74fe737a45e589f85ace098fa8466dfb7927e
- Download: https://firmware.ffnw.de/20171216
 2tata
on 20 Dec 2017
2tata
on 20 Dec 2017
fyi:
2017-12-12 00:11:47 blocktrron T_X: echo fq_memory_limit 200 > /sys/kernel/debug/ieee80211/phy0/aqm resultiert darin, dass der Router stabil läuft
On 12/21/17 02:01, Martin Weinelt wrote:
fyi:
2017-12-12 00:11:47 blocktrron T_X: echo fq_memory_limit 200 > /sys/kernel/debug/ieee80211/phy0/aqm resultiert darin, dass der Router stabil läuft
Ay, Thanks
We were able to solve this problem, by updating batman-adv on our gateways to a version higher than 2017.0.1.
vg
Tarek
2tata
on 21 Dec 2017
We are currently on batman-adv v2017.3, shortly v2017.4. I don't think it will fix this issue for us, seeing as the workaround in https://github.com/freifunk-gluon/gluon/issues/1243#issuecomment-353227388 reduces the memory of some 802.11 queuing mechanism.
mweinelt
on 21 Dec 2017
I don't know what batman-adv you where using before, but it could be that batman-adv v2017.3 fixed the problem.
There was a bug with multicast optimization in batman-adv before. This bug leaded to many small packages. your workaround helps to handle more small packages. but maybe your router wouldn't need this workaround in "normal" conditions without the batman failure.
we had got these problems until we upgraded all batman-adv on all gateways and disabled multicast optimizations with batctl mm 0
I didn't had time yet to test if batctl mm 1 works now. I disabled it after the problems persisted. Later I found out, that I missed to upgrade the mapserver, so the mapserver still produced misflagged packets.
see: https://patchwork.open-mesh.org/patch/17072/
can you confirm this issue in a network with => batman-adv 2017.3 nodes only or with mm disabled also on gateways and mapserver? maybe you fix to work with existing error instead of removing the error
A-Kasper
on 21 Dec 2017
That issue was already fixed in 2017.2, which we rolled out some time back in july. We do follow batman-adv quite closely.
mweinelt
on 21 Dec 2017
we just noticed the debug-oom branch wasn't mentioned here before:
https://github.com/freifunk-gluon/gluon/tree/debug-oom
did this branch alone not help? or did i just miss comments regarding this?
or did it help even more together with the manual "200" limit?
rotanid
on 27 Dec 2017
echo fq_memory_limit 200 > /sys/kernel/debug/ieee80211/phy0/aqm worked for me on an ubiquiti loco m2 so far for 3 days. testing higher limits now.
..ede
edeso
on 28 Dec 2017
@edeso in our meeting the question also was, whether the autoupdater is working again with the lower limit of 200 - or if that still leads to a crash/load/OOM issue.
rotanid
on 28 Dec 2017
@rotanid sorry can't help you with that. the gluon on these nodes does not have a valid autoupdate config. any way to simulate one? i would be willing to try.
..ede
edeso
on 28 Dec 2017
yes, you could write a file (consisting of zeroes) of slowly increasing size to /tmp/ and see if you get to a size big enough that it is the same size as an sysupgrade file would be
rotanid
on 28 Dec 2017
like a dd of say 4MB from /dev/zeroes to /tmp/test ? if the device reboots bad, if not success?
..ede
edeso
on 28 Dec 2017
@edeso worst devices are the ones with 32mb ram and 8mb flash, like WR842v2, its sysupgrade image has 5046276 byte (similar Loco M2 and some others)
yes, if it doesn't reboot it's good. but the autoupdater already stops some services to save memory, so less than this byte count is not always bad.
rotanid
on 28 Dec 2017
@rotanid ok. will try as soon as i have time and ipv6 again. probably in 2-3 days.. ede
edeso
on 28 Dec 2017
@rotanid found a shell w/ ipv6 and tried it (sitting in a db train right now). codel limit is currently 512 on this node. tried 1-5MB and that worked. 8MB rebooted the box. after a fresh start 8MB works even w/o the memory limit set, box get's a bit laggy though, so it seems to matter how long the box ran before the mounted ram is used.
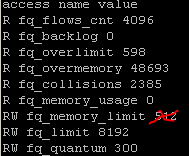
:~# cat /sys/kernel/debug/ieee80211/phy0/aqm
access name value
R fq_flows_cnt 4096
R fq_backlog 0
R fq_overlimit 0
R fq_overmemory 40295713
R fq_collisions 67
R fq_memory_usage 0
RW fq_memory_limit 512
RW fq_limit 8192
RW fq_quantum 300

:~# dd bs=1024 count=$((5*1024)) if=/dev/zero of=/tmp/test
5120+0 records in
5120+0 records out

:~# ls -lah /tmp/test
-rw-r--r--    1 root     root        5.0M Dec 28 02:29 /tmp/test

:~# df -h
Filesystem                Size      Used Available Use% Mounted on
/dev/root                 2.3M      2.3M         0 100% /rom
tmpfs                    13.6M      5.1M      8.5M  38% /tmp
/dev/mtdblock5            3.8M    372.0K      3.4M  10% /overlay
overlayfs:/overlay        3.8M    372.0K      3.4M  10% /
tmpfs                   512.0K         0    512.0K   0% /dev
looks promising to me, but @T-X and @NeoRaider can interprete this much better
@edeso , could you perhaps show us "cat /sys/kernel/debug/ieee80211/phy0/aqm" without changing it before, if it is possible to get this information before the node reboots?
rotanid
on 28 Dec 2017
Documenting regarding what had been found out back then with the tests done by @mweinelt and @blocktrron back then:
This paste produced with the slabinfo-on-OOM patch backported seems to indicate that:
- The issue is not caused by userspace
- The issue is not caused by kernelspace kmalloc()/kmem_cache_alloc() allocations. This seems to outrule:
- batman-adv or the Linux bridge, for instance, as they are using these and not vmalloc()
T-X
on 30 Jan 2018
This issue appeared to Freifunk Münsterland in v2017.1.4 and v2017.1.5 aswell.
Example node TP-Link TL-WR841N V8: http://backend-aegidiistrasse.knoten.ffmsl.de/
So far we tried updating the batman version on the two gateways. Both are running Batman 2017.4 now.
Further up it was speculated, that some broken batman versions between v2017.0 and v2017.3 could cause this issue. We don't have any of those nodes in this domain. There are only v2016.2.7 Gluons with Batman 2016.2 and a very few v2017.1.5 test nodes.
There are no packages included in our configuration, which could explain this load besides the ssid changer, which used to run perfectly.
Is there anything I can do to help solving this issue? The affected nodes are barely usable. The download speed goes down to a few kilobytes per second.
Bye,
Matthias
 MPW1412
on 8 Feb 2018
MPW1412
on 8 Feb 2018
@MPW1412 at least there is a workaround above https://github.com/freifunk-gluon/gluon/issues/1243#issuecomment-353227388
just add it to /etc/rc.local so it get's executed on every boot.
..ede
edeso
on 9 Feb 2018
Results in the network of Freifunk Darmstadt are documented here: https://md.darmstadt.ccc.de/ffda-gluon-debugwishlist
blocktrron
on 16 Feb 2018
1363 should significantly reduce RAM usage, please test!
NeoRaider
on 11 Apr 2018
Even with a build of the actual master branch, the high cpu load problem is still reproducable on an WR841v9 (maybe the load is little bit lower but still near 1 in average withoud much traffic)
 TomSiener
on 25 Apr 2018
TomSiener
on 25 Apr 2018
As of the firmware image with kmods-builtin a problem device (842NDv2) has started reaching uptimes of several days again.
At least the last three reboots are due to updates from the master branch.
Also I have a 1043NDv1 locally that has reached an uptime of 3 hours. Note that it used to crash in seconds earlier this year.
root@64xxx-90f652f45cc4:/# uptime
22:28:28 up 3:05, load average: 0.19, 0.16, 0.15
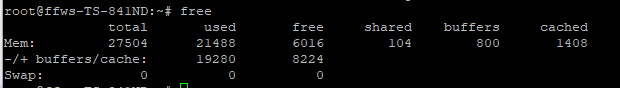
root@64xxx-90f652f45cc4:/# free
total used free shared buffers cached
Mem: 27512 20804 6708 120 1304 2480
-/+ buffers/cache: 17020 10492
Swap: 0 0 0
root@64xxx-90f652f45cc4:/# echo m > /proc/sysrq-trigger
[11151.278546] sysrq: SysRq : Show Memory
[11151.282392] Mem-Info:
[11151.294013] active_anon:587 inactive_anon:10 isolated_anon:0
[11151.294013] active_file:747 inactive_file:169 isolated_file:0
[11151.294013] unevictable:0 dirty:0 writeback:0 unstable:0
[11151.294013] slab_reclaimable:236 slab_unreclaimable:1899
[11151.294013] mapped:371 shmem:30 pagetables:79 bounce:0
[11151.294013] free:1708 free_pcp:0 free_cma:0
[11151.326043] Normal free:6832kB min:1024kB low:1280kB high:1536kB active_anon:2348kB inactive_anon:40kB active_file:2988kB inactive_file:676kB unevictable:0kB isolated(anon):0kB isolated(file):0kB present:32768kB managed:27512kB mlocked:0kB dirty:0kB writeback:0kB mapped:1484kB shmem:120kB slab_reclaimable:944kB slab_unreclaimable:7596kB kernel_stack:400kB pagetables:316kB unstable:0kB bounce:0kB free_pcp:0kB local_pcp:0kB free_cma:0kB writeback_tmp:0kB pages_scanned:0 all_unreclaimable? no
[11151.369605] lowmem_reserve[]: 0 0
[11151.372960] Normal: 198*4kB (UME) 213*8kB (UME) 93*16kB (UME) 37*32kB (UME) 16*64kB (ME) 5*128kB (UM) 0*256kB 0*512kB 0*1024kB 0*2048kB 0*4096kB = 6832kB
[11151.386939] 946 total pagecache pages
[11151.390623] 0 pages in swap cache
[11151.393963] Swap cache stats: add 0, delete 0, find 0/0
[11151.399231] Free swap = 0kB
[11151.402129] Total swap = 0kB
[11151.405024] 8192 pages RAM
[11151.407758] 0 pages HighMem/MovableOnly
[11151.411616] 1314 pages reserved
I certainly can push the 1043v1 into an OOM, but I think that is out of scope for this issue. We are likely going to remove opkg on 8/32 ar71xx-generic devices to limit the possiblities of people shooting themselves in their foot.
mweinelt
on 1 May 2018
so far i also see improvement on the lowmem devices, even in v2017.1.x branch.
firmware builders should make sure to not include many additional packages which could overload these lowmem devices again.
we in our community handle lowmem devices differently as we don't include any feature-only package for lowmem devices - examples: USB, airtime, custom packages like time-based stuff, etc. - we even removed opkg from some devices, so people can't shoot themselves in their feet accidently by installing stuff.
some of these ideas are borrowed from @mweinelt / Freifunk Darmstadt.
it would be nice to get reports about the progress in the Gluon master branch by @MPW1412 who had serious issues with some nodes
rotanid
on 6 May 2018
@rotanid I flashed the node that we used to analyze the load bug (a TL-WR841N v8) with a master based image 4 days ago, so far it didn't reappear.
 flobeier
on 11 May 2018
flobeier
on 11 May 2018
Made a new build with the actual master and the high load problem is still there.
The phenomena is easier to reproduce with an AP connected to one of the lan ports (e.g. Nanostation or Unifi with stock fw). Then the cpu-load rises within minutes or hours.
Without this, the node can run several days before the cpu-load rises. (or on some nodes never)
When the radio is disabled, the phenomena doesn't appear, regardless if there's an AP connected.
There must be some kind of traffic on the client-bridge which causes the wifi-interface to produce this load.
TomSiener
on 13 May 2018
@TomSiener good catch!
while not having flashed any current master i can add that my nodes that ae affected are all doing MeshOnWAN due to an offloader. also the fq_memory_limit workaround from above does still work flawlessly .
..ede
edeso
on 13 May 2018
setting fq_memory_limit to 200 didn't work for me, maybe because a cannot update our gateways to batman 2017 at this time.
TomSiener
on 13 May 2018
@TomSiener your device seems to have a high memory usage (85%), have you read my comment regarding removing packages?
the fq_memory_limit doesn't have to do with your batman-version. you still run a 2016.x batman-adv? you should really update, there are many bugs.
@NeoRaider didn't we already lower the fq memory limit for the small devices in the master branch, which would be in conflict with what @edeso is reporting
rotanid
on 13 May 2018
@TomSiener, @rotanid maybe Tom's is a different issue alltogether. symptoms on my side were the all consuming kernel thread but still memory left according to top.
..ede
edeso
on 13 May 2018
with fq_memory_limit set few hours ago. No additional packages are installed.
 depressivum
on 13 May 2018
depressivum
on 13 May 2018
@depressivum can you check that the limit is still in effect?
cat /sys/kernel/debug/ieee80211/phy0/aqm
the 1h uptime suggests that the box rebooted inbetween. did you add the limit to /etc/rc.local to have it applied on every reboot?
edeso
on 13 May 2018
@edeso
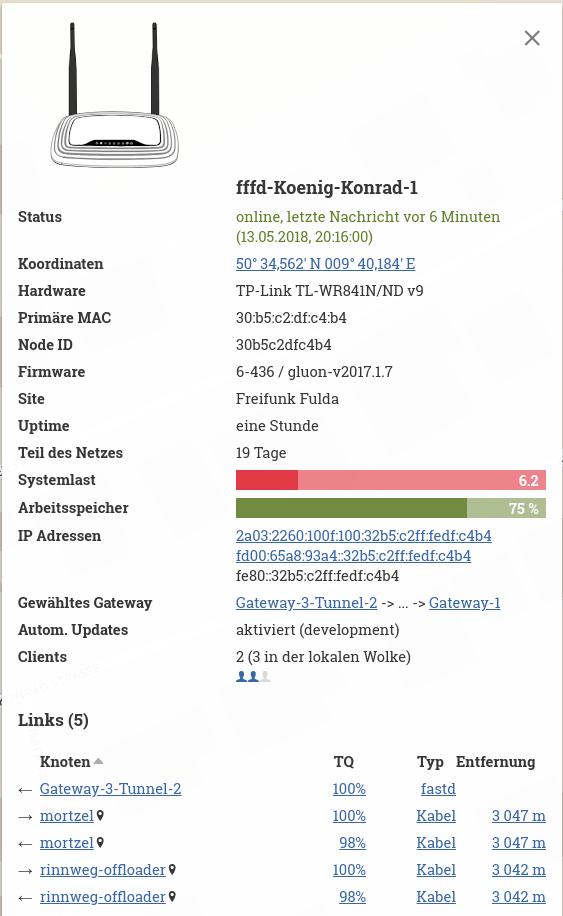
root@fffd-Koenig-Konrad-1:~# cat /sys/kernel/debug/ieee80211/phy0/aqm
access name value
R fq_flows_cnt 4096
R fq_backlog 0
R fq_overlimit 30
R fq_overmemory 42620
R fq_collisions 26224
R fq_memory_usage 0
RW fq_memory_limit 262144
RW fq_limit 8192
RW fq_quantum 300
Okay, looks like this was not the case. After setting the limit again, it shows up correctly. Will this settings persist over reboot?
depressivum
on 13 May 2018
@depressivum not if you do not apply it on every reboot via rc.local eg.
:~# cat /etc/rc.local
# Put your custom commands here that should be executed once
# the system init finished. By default this file does nothing.

echo fq_memory_limit 512 > /sys/kernel/debug/ieee80211/phy0/aqm
exit 0
my limit is a little higher but works reliably on a Loco M2 box.
btw. i seem to remember setting the limit during a high load event having an instant effect (not 100% sure though).
edeso
on 13 May 2018
@rotanid Made a new build from master and omitted all our addtional packages.
Maybe the cpu overload now comes up later but it still appears.
@edeso according to top there's still free memory on the node.
TomSiener
on 14 May 2018
@depressivum is that w/ or w/o the wifi limit setting? what does
cat /sys/kernel/debug/ieee80211/phy0/aqm
say? ..ede
edeso
on 14 May 2018
without any additional limit setting
Update: @depressivum sorry, seems there was no setting to 512) , was a mistake of me - setted the limit when cpu overload had already appeared.
TomSiener
on 14 May 2018
@depressivum seems to be lowered to 512 already. what happens if you lower it to 200 ?
edeso
on 14 May 2018
If a lower the limit after a certain runtime, the wifi stops working. Wifi-LED still blinking but no signal.
I'll try to lower it directly after boot or in rc.local.
But already tried this with gluon 2017.1.7 and had no effect.
TomSiener
on 14 May 2018
@depressivum how about limiting it further to 100? if wifi stops working after setting it you could try to restart wifi via wifi ?
just insisting because it works for me reliably on 2017.1.4.. didn't build any since then.
edeso
on 14 May 2018
restart via wifi didn't make it working again.
rebooted now with fq_memory_limit 100 (set in rc.local).
TomSiener
on 14 May 2018
@depressivum are you using a LAN or WAN port for meshing? never used LAN, maybe using WAN makes a difference? ..ede
edeso
on 14 May 2018
I' ve enabled mesh on lan only. No problems with load noticed since Yesterday. (Fq_memory_limit 200)
http://[2a03:2260:100f:100:32b5:c2ff:fedf:c4b4]
depressivum
on 14 May 2018
@depressivum thanks, good to hear it works for you w/ MeshOnLAN.. hence it should work for @TomSiener with a 200 limit as well, at least until a permanent fix is found. ..ede
edeso
on 14 May 2018
with a fq_memory_limit limit of 100, 200 or 512 , I cannot establish a wifi connection - neither client nor mesh(11s): (w actual master branch build)
With a limit of 2000, wifi connection are possible.. We will see what the cpu load will do with this setting.
TomSiener
on 14 May 2018
@TomSiener weird, as @depressivum is using a WR841v9 as well. maybe something in master and you should try v2107.1.7 again w/ limit 200? ..ede
edeso
on 14 May 2018
@edeso @TomSiener i have to admit that i havent testet the client side well enough: Now i noticed same behaviour as Tom described. The Client connects to the node but doesn't receive an IP. I set fq_memory_limit to 2048 and it works again....
depressivum
on 14 May 2018
@depressivum @edeso yes, same like me.
I just made a few further tests with the fq_memory_limit setting.
With 2000 I get an IP connection, but the speed is horrible (about 1Mbs),
with 5000 it's about 2Mbs, with 20 000 about 5 Mbs and with 200 000 it's about 20Mbs (same as without any manual setting).
So, I think decreasing the fq_memory_limit is not the right thing in my scenario.
TomSiener
on 14 May 2018
@TomSiener @depressivum wanted to check the speed of my Loco M2 and found that it too didn't give out IPs anymore. connecting was fine, but no IP.. raising limit as described by @TomSiener resolved this and also had the mentioned effect on throughput (using 512000 now, which is half of the default setting at least, waiting for the load to come back and will decrease then further).
funny though that i am sure when i applied the workaround by the end of last year it worked fine with a limit of 200. something must have changed in the network maybe the batman versions on the uplink nodes? ..ede
edeso
on 16 May 2018
No luck. After ~18 Hours with very little load, it increased to >1.5. Lowered limit form 20 000 to 10 000.
depressivum
on 16 May 2018
This bug really seems to be triggered by the WAN or LAN side. The test node of @MPW1412 ran fine for 4 days with the current master image and one wireless mesh node. As soon as he connected another node (running a master image too) by cable (so mesh on LAN), the load bug appeared shortly after.
flobeier
on 16 May 2018
Summary of what @NeoRaider and @H4ndl3 tested on the setup I provided: Best guess so far is, that there's a bug in the caching and paging algorithm in the newer kernel version, which might not reveal itself in standard OpenWrt or LEDE due to a much lower workload in the standard usecase as a router compared to handling of batman and vpn in the typical Freifunk setup.
Thanks for your work on this!
MPW1412
on 19 May 2018
Hi, we (pjodd.se) are experiencing this as well.
Most of our nodes are running older gluon, based on 2016.1.x releases, but we're beta testing later gluon (now from the master branch, commit f51eac7) on two nodes.
The two nodes are both tl-wr841nd, but one is v11 and the other is v8.4. The v8.4 does not suffer from this issue, but it also has no WLAN mesh neighbours, but it's connected to the mesh via one of our gateways over fastd and usually has up to 6 WLAN clients.
The v11 one has lots of neighbours, 6-7 direct WLAN mesh neighbours and more in the area around it. This one usually have a load of up to 0.4 for about 7 hours, then the load starts to climb for one to several hours until it reboots and start over.
The pattern here is ~7 hours of reasonable load before it starts to climb, even when there is little to no client traffic in the mesh, and only on the node with WLAN mesh neighbours.
I tried setting fq_memory_limit to lower values, 2048 and 4096, but that made it unusable for clients, 131072 gave significantly lower throughput, so I set it back to the default of 262144.
 omniuwo
on 25 May 2018
omniuwo
on 25 May 2018
@omniuwo How high does the load climb? Are you sure the devices are not running out of memory?
mweinelt
on 5 Jun 2018
There is a bounty collection on the way for this bug:
From the gluon mailing list:
probably everybody on this list knows about issue #1243, the high load
on many devices with firmware based on v2017.1.* or LEDE in general.
Progress seems to be stuck and probably implementing new features for
Gluon is much more fun then hunting this annoying bug.But this bug is a real blocker for the development of our Freifunknetz
here in Münsterland, North Rhine-Westphalia. For more than a year, we
couldn't roll out a stable release.As Gluon is FOSS it is of course in everybody's hand to enhance the
software continuously and so we tried to support Neoraider by setting up
a test system. This brought some new ideas, but no real breakthrough so
far. The only other way I can think of to support without having the
direct knowledge to hack the code, is giving financial support.So we, the Förderverein freie Infrastruktur e. V., the incorporated
association for Freifunk in Münsterland, were thinking about putting out
a bounty on this issue. But we're reluctant to do so, as we're unsure
how the main developer and maintainer community would react to such a
move. In other words, we just don't want to step into this and affront
this well working community.In the #gluon-irc someone said, that a winner-takes-it-all approach is
probably not the best way. So I was thinking about splitting the bounty
percentaged into three parts:
- 30% for implementing or fixing the dynamic tracing in the linux
kernel for the MIPS architecture: As far as I understood Neoraider, this
missing tool is the main obstacle to hunt this bug down.- 30% for actually finding the bug
- 40% for fixing it or other obstacles that come along the way
I will propose to the members of the association to provide 250 € as a
start and maybe other Freifunk associations will follow, so that we
might raise 1.500 to 2.000 €. If more money made a difference, we could
fill out an application for support for more funds on this at the
Staatskanzlei NRW, but that shouldn't be the first step in this new
approach.If the money could be raised, maybe someone is willing to fix the
dynamic tracing for MIPS for 450 to 600 €. Maybe that is illusionary,
maybe not. I don't know.To attract external developers, I was thinking about putting it up on
bountysource.com. But we'd be open to alternative suggestions.Please give your thoughts about this.
Regards,
Matthias
 rubo77
on 7 Jun 2018
rubo77
on 7 Jun 2018
I am hesitant to throw possibly unrelated issues into this discussion, but maybe OpenWrt's issue #1544 could be related?
Quick summary:
- affected device: Ubiquiti Nanostation M5 HP XM (this model is comparable to Nanostation M2)
- our community does not use any of the other models (TP-Link, ....) mentioned above, thus I cannot comment on those
- the problem started with LEDE 17.01 (Gluon v2017.1)
- it did not happen with Chaos Calmer (Gluon v2016.x)
- load climbs to (and persists at) 8 or higher
topshows multiple megabytes of free memory during the problem (out of 32 MB)- usage of the Wifi connection and/or the second ethernet port increases probability of the problem
- it looks like
workingset_refault(see /proc/vmstat) could be related
 sumpfralle
on 9 Jun 2018
sumpfralle
on 9 Jun 2018
Does this patch finally solve the issue?
rubo77
on 19 Jun 2018
No, it fixes a way to analyze the load issue on MIPS architecture.
mweinelt
on 19 Jun 2018
@rubo77
additionally i'll repeat what i wrote elsewhere:
there is not THE one and only issue!
"high load" can be the result of several issues and some were already fixed which solved the problem for several communities by running latest Gluon master branch and latest batman-adv on gateways.
so if you also have problems, maybe they would be already gone after updating nodes and gateways.
rotanid
on 19 Jun 2018
We just had an interesting (not reproducible) problem with a single Nanostation M2. Maybe helpful to demonstrate @rotanid's statement "there is not THE one and only issue!" even when everything looks the same:
- no clients attached
- didn't seem to see any other device via ibss0
- only Mesh-on-WAN active
- load was 3/4-14 (caused by respondd, multiple odhcpc6 and the dhcpv6 scripts, radv filter, ...)
- software reboot (done multiple times) didn't change the behavior
- removing client0 and ibss0 seemed to make the device more responsive (but this was not really measured - just noticed that I could enter commands via SSH better than before)
- installing 2018.1 image with reduced squashfs block size reduced load to ~1-2 (still more than expected and it was only measured a couple of minutes - so would maybe even reached 14 again)
Solution was: remove power from device, wait a couple of seconds and reattach it. I still don't know what caused it. Maybe a lot of ath9k HW resets caused by a currently unknown and insufficiently handled HW problem (which survives reboots)? Anyway, I can't turn back time and so I can not do a cat /sys/kernel/debug/ieee80211/phy0/ath9k/reset on the broken device.
 ecsv
on 7 Jul 2018
ecsv
on 7 Jul 2018
The load bug is a thrashing issue. When a node is in a low memory situation it constantly needs to reread blocks of flash memory which need to be decompressed. Using perf I tried to rule out other causes and found that the LZMA compression of SquashFS definitely causes the high load.
Thus the question arises what causes the low memory situation.
@ecsv I thought there was a ath9k issue, too, but I found out that when the load bug occurs the beacons just stuck as they don't get out in time and the chip is being resetted again and again. That's also the reason why the SSIDs of APs with the load bug are sometimes disappearing for a while.
CodeFetch
on 8 Jul 2018
I've noticed the kernel for ar71xx-tiny is currently compiled with USB support in place while we already exclude kmod packages for USB support. So it might be beneficial to remove USB support from the kernel altogether?
blocktrron
on 17 Aug 2018
I can well reproduce on 2018.1 (compared to 2016.2.x)
- 841v9 on L2TP-WAN, Wifi totally off, MoW disabled, MoL enabled. demand of >30MBit/s. load nearly constantly >2, uptime before crash hardly more than 30 minutes-1 hour.
- 841v9 on MoW, 2-3 APclients, but 5-6 Wifimeshlinks.
load 2-3 a day >2, then uptime before crash hardly more than 30 minutes-1 hour.
On a 64MB RAM devices it runs in nearly exactly the same setup flawlessly. I am really considering upgrading old devices with bigger RAM (since i understood that the bootloader is detecting that automatically).
Adorfer
on 17 Aug 2018
@mweinelt Sorry that I didn't reply earlier, I don't really remember but way above 1 (20-40 reported before crash/reboot).
We recently upgraded one of our gateways from Debian Jessie, and thus from batman v2014.x, and tried a v2018.1.x build on one of the nodes having the most frequent reboots (it was one of two running v2017.1.x) and didn't see this issue anymore. We ran the new build on those two nodes for a week and then pushed new stable images that most of our network now run.
omniuwo
on 19 Sep 2018
Alter we upgraded our gateways to batman 2018.2 a few weeks ago, I repeated the tests with a WR841v9.
The phenomena is easier to reproduce with a client connected to one of the lan ports (e.g. Nanostation or Unifi with stock fw). Then the cpu load rises within minutes or hours.
Without this, the node can run several days before the cpu-load rises. (or on some nodes never)
with gluon 2018.1 and WiFI enabled:
with gluon 2018.1 and WiFi disabled:

with gluon 2016.2.7 and WiFI enabled:
So, the high load bug ist still there, even with batman 2018.2 on the gateways and gluon 2018.1 on the node.
TomSiener
on 24 Sep 2018
We recently moved our first nodes into smaller domains and that resolved this issue on many devices as well. It's obviously a composite issue that's pretty hard to fix.
Both load and memory usage significantly drop:
The CPU is less busy because it sees far less packets:
Airtime gets freed up because less noise needs to be forwarded:
I have many of these examples. The gist is:
- don't let your mesh get too large
- drop unnecessary noise in your network
Besides this it's alot of guess work, like for example reducing the squashfs block size (https://github.com/freifunk-gluon/gluon/commit/2b208647f7b69499481c6977b4f6acabf22bb319).
In general I think we profit far more from tests of the master branch.
mweinelt
on 24 Sep 2018
@TomSiener thanks for the update.
So, the high load bug ist still there, even with batman 2018.2 on the gateways and gluon 2018.1 on the node.
sure, that's why we didn't close this issue/ticket...
@mweinelt also thanks for the information.
maybe this can be improved further if someone with deep knowledge of the systems involved uses the work done by @CodeFetch (dynamic ftrace etc) to get an insight into the "why"
rotanid
on 24 Sep 2018
As Freifunk Darmstadt now completed the migration of it's network, we now have domains with max. 70 Nodes per Domain.
We already see the problems regarding high load greatly improve, if not gone completely. 
Surely, this is not a fix. I would also go as far to say that there is probably no real fix. We should probably accept that those devices just do not have enough ram to fulfil their task (And even the split is probably only a temporary improvement).
Another example of a very problematic node: 
blocktrron
on 30 Sep 2018
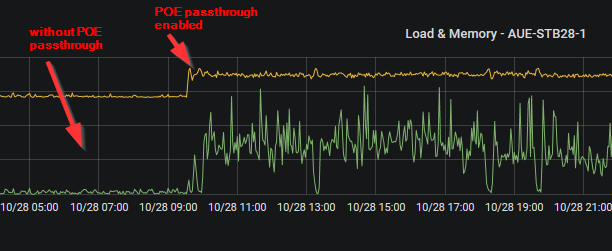
Same issue here on a Nanostation M2 (XM) with a webcam connected to the second ethernet port... without POE passthrough enabled, the device is running fine, POE passthrough activated causes the error to occur. the effect was previously reproducible at any time.
 hauetaler
on 29 Oct 2018
hauetaler
on 29 Oct 2018
@hauetaler: Can you try whether the same issue happens with PoE passthrough disabled and using a PoE-injector for the webcam instead? Does the same happen with PoE passthrough enabled but no webcam connected?
I'm wondering whether this is really an issue of PoE. Or whether this could be caused by the traffic the webcam generates instead.
Thirdly, do you have a scale for the y-axis?
T-X
on 17 Jan 2019
@hauetaler could you try to disable as many ebtables rules as possible for a test?
Adorfer
on 17 Jan 2019
I'm very sorry, but there's no PoE-injector availiable at the moment. Since gluon 2018.1.3 the Nanostation works again without any problems.
hauetaler
on 21 Jan 2019
@T-X Ok, today the problem occured again. PoE is disabled now, so you're right, it's not an issue of PoE.
40 minutes after connecting a raspberry pi to the second ethernet port (eth1) as a freifunk client, load increases from 0.31 to 3.0 and higher. memory usage increases at 15-25 percent. Disconnecting the raspberry pi has no effect in this case. Without connecting a device on the second port, the problem doesn't occur.
@Adorfer next time I'll try to disable ebtables rules
hauetaler
on 22 Jan 2019
@hauetaler Wow, 15-25% memory increase is really much. Can you please give me access to the router? My public key is ssh-rsa AAAAB3NzaC1yc2EAAAADAQABAAACAQDM8uhJ9Qin1Bnt1gVkhQEocIK+ziP4Ht0uCP1QPaTPza8hXxLrf5pizAxWpjM7Jnr3UFc/IpOMUII7B67MPlcUvlryQGESNQqGUDEoDbTww1wh79G86x4Q7xMS1q35H6E9KX0WUGMhdcHCOn4XQbIeNB6BY1NL27JgNE4I84oMhWbDdUnR36ZPCWvkm+7PKr92MacCZU/z7lBRHcW0zfCug4YuO3vOqtv1UQl3z2dsgK1VkyuDxyNXSeRufKyJJveqURzx1A5wZVQ3Qc7nIj00yx3GVsYMZH3oX6PuPiu+fu4nzvwiiWaqf/PFqa9Rfof1hQJy29Be8ggfbKZwEF4dCBGhydTF66hm729OzWry7XN49aZAmjHEe84ivDL16SjQjGWPFygMQdpQSovIT8t0vzfuNKRElhMEBAM4BxvLiWtaKFOhxXhMlK7rTmGBzouarFcR5ka1OFYD36z1rv8REEviUMv1QbFtIx1TD3HrliNt18lJE5d5AyDxadWy6Lf7WlPpVZnxydTneyE7UwtSt9vwx2zdNEOG6ygxOjY9JbiO12/kkyLeTyMq7+o0uY5oV2xo+I3aVYVS0jv3VHrTqtb/1nDWTb7Y9TTe8b0nOZOkOnnzOxWBvSms7MOh0NOA2I3ZpkIhKcWqdCvyKFfeUaita4sYKOrIwelYhyGQmQ== user@management.
CodeFetch
on 22 Jan 2019
@CodeFetch ...done - https://hannover.freifunk.net/karte/#/de/map/68725124e2fa
hauetaler
on 22 Jan 2019
@hauetaler: Could you check whether the issue also occurs if you swap the Pi with a plain, simple switch with nothing else connected to it?
T-X
on 25 Jan 2019
@T-X Just tested it, no problems at all. It seems there must be traffic for the error to occur.
hauetaler
on 25 Jan 2019
@hauetaler Can you flash the router manually in case it gets unresponsive? I'd like to test our nightly firmware as it uses OpenWrt and afterwards a firmware with tracing and profiling support. I have had installed vH11, but it seems you have downgraded the router to vH10 again?!
The strange thing with your router is that I almost freed 5 MB of RAM and the load bug still occured. BTW I've moved to Freifunk Hannover a few months ago...
CodeFetch
on 30 Jan 2019
@CodeFetch Flashing this router manually is no problem. Should I reconnect the raspberry again?
hauetaler
on 30 Jan 2019
@hauetaler Sorry for my late reply. I'd like to test it on sunday. It would be nice if you could plug in the raspberry then.
CodeFetch
on 1 Feb 2019
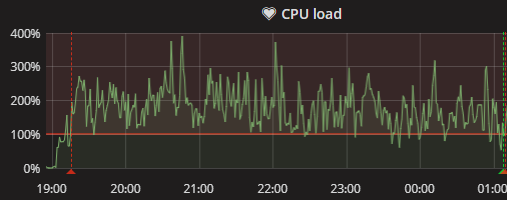
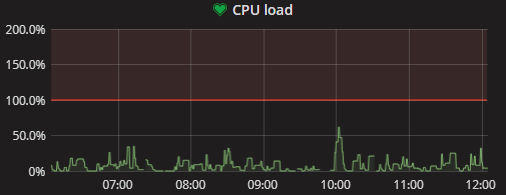
Using the Gluon master the load decreased from average 5 to 0.5. Which is still high as it did nearly nothing and routers with more RAM that actively serve clients have a load of average < 0.1. Between 22:10 and 22:30 you can see what happens, when I slowly fill the RAM (up to approximately 1MB). The load did go up to 3 and then the router rebooted due to a OOM.
Next step for me is to watch the inodes that are being decompressed to find out what files are being repeatedly read which causes the high load. The 32 MB RAM routers are definitely OOM. It's a matter of a few 100 KBs if the load bug appears or not. When it appears once it is hard to fix even if you free a lot of RAM. This is a thing I don't have an explanation for.
@hauetaler I've just flashed a firmware with SquashFS debug messages enabled. Unfortunately the router is not reachable since then. I suspect that it generates too many messages. Sorry, but you need to flash it manually now :(... Please use our nightly firmware: http://build.ffh.zone/job/gluon-nightly/ws/download/images/sysupgrade/
CodeFetch
on 4 Feb 2019
@CodeFetch thanks for your time and effort in further investigating this bug!
flobeier
on 4 Feb 2019
I've to unbrick it first by TFTP recovery. It's impossible to flash a new firmware at the moment. Hopefully the router will be back online in a few minutes.
hauetaler
on 4 Feb 2019
@hauetaler The node looks very good now. Load in average 0.1 like 64 MB devices and only 62% memory consumption. Did you unplug the raspberry? If not, please try to generate some traffic over LAN and then over WiFi. I've build a setup at home with which I can reproduce the load issue for further investigation now. Thank you very much for your help. We will release a firmware for Freifunk Hannover based on 2018.2 after we have checked if the 4 MB devices run as smoothly as yours or if the SquashFS block size needs to be reduced for them, too.
CodeFetch
on 4 Feb 2019
@CodeFetch load average seems to be ok at the moment, but memory consumption increases after connecting the node to vpn mesh again.

hauetaler
on 5 Feb 2019
The problem seems to be gone or at least mitigated for us (FF Münsterland) in 2018.2.x. Maybe even earlier, we never used 2018.1.*.
https://karte.freifunk-muensterland.de/map04/#!v:m;n:a42bb0d21ba4
I tested explicitly the wired mesh case, in which the problem occurred very often in 2017 based Gluons.
MPW1412
on 10 Feb 2019
@MPW1412 With 2018.1.4 the bug is easily reproducible. With 2018.2/switch to OpenWrt the router seems to reboot directly after the load begins to increase to about 3, but that only happens when I manually fill the memory. I'm happy to see that your 4 MB flash device also seems to have less memory pressure. Can you please post a dump of /proc/meminfo and /proc/slabinfo with the old and the new firmware?
CodeFetch
on 10 Feb 2019
This was the thread I've found on our issue:
https://lkml.org/lkml/2017/9/14/646
The question is: Did the thrashing detection really improve or do we just have more memory available due to more efficient packet handling by ath9k, different SquashFS cache sizes etc.?
For that we need a comparable dump of /proc/meminfo and /proc/slabinfo with 2018.1.4 and 2018.2 of an affected 4 MB flash node.
I've looked through all linux commits I could find that were related to thrashing and memory handling. There were many commits that could possibly have improved the situation, but I could be sure for none of them. I'd like to do some tests with https://github.com/torvalds/linux/commit/b1d29ba82cf2bc784f4c963ddd6a2cf29e229b33 and https://github.com/torvalds/linux/commit/95f9ab2d596e8cbb388315e78c82b9a131bf2928.
We should have a look at some of these commits, as they might be able to detect the SquashFS thrashing state or make it worse or better (these were all I've found that come into question):
https://github.com/torvalds/linux/commit/1899ad18c6072d689896badafb81267b0a1092a4
https://github.com/torvalds/linux/commit/a76cf1a474d7dbcd9336b5f5afb0162baa142cf0
https://github.com/torvalds/linux/commit/172b06c32b949759fe6313abec514bc4f15014f4
https://github.com/torvalds/linux/commit/c55e8d035b28b2867e68b0e2d0eee2c0f1016b43
https://github.com/torvalds/linux/commit/2a2e48854d704214dac7546e87ae0e4daa0e61a0
Please help me to exclude some of them. I'm not that much into kernel page cache handling and some of them might be obviously irrelevant. We should find out whether the load bug was just a cosmetic issue or whether we are near the OOM justifiably.
CodeFetch
on 11 Feb 2019
My high load scenario is still reproducable with 2018.2 or even with a build from master (7/2/2019)
on a 4/32 MB node with a few traffic on lan port:

Alter 2-3 hours the load raises.
If someone wants to do some tests with this node, there's no problem to add his key.
The node resides in a guest lan.
I would be glad if can help fixing this bug.
TomSiener
on 12 Feb 2019
Well, everything here is in the green. If anybody still sees this on v2019.1.x and newer please speak up.
mweinelt
on 3 Mar 2020
Related issues
rotanid
·
4Comments
mweinelt
·
3Comments
 Nurtic-Vibe
·
5Comments
Nurtic-Vibe
·
5Comments
 HACKER-3000
·
5Comments
Nurtic-Vibe
·
5Comments
HACKER-3000
·
5Comments
Nurtic-Vibe
·
5Comments
Most helpful comment
@CodeFetch ...done - https://hannover.freifunk.net/karte/#/de/map/68725124e2fa