Gluon-ts: Forecasting multiple time series targets (many-to-many)
Hi, I'm attempting to forecast multiple time series targets simultaneously (a many-to-many forecasting use case). I understand that most GluonTS models can accept a single target and multiple additional features, however the resulting output always appears to be a single target forecast. However, I'm looking to forecast multiple targets with a single model.
My data is as below:
| date | time series 1 | time series 2 | time series 3
| ------------- | ------------- | ------------- | ------------- |
| '2020-01-01' | 18 | 5 | 0 |
| '2020-01-02' | 31 | 12 | 2 |
| '2020-01-03' | 67 | 17 | 3 |
| '2020-01-04' | 23 | 5 | 1 |
Could someone kindly point me to the appropriate model and input formatting to achieve my many-to-many forecasting use case?
Thanks in advance for any assistance with this. It's greatly appreciated!
 dmartintucker
All 3 comments
Hello @dmartintucker,
there are two ways to approach this. You could use a univariate, but global model like DeepAR. DeepAR is trained on multiple time series and during inference you can produce forecasts for each single time series. Each forecast will only be conditioned on a single time series, but still, this would be forecasting "multiple targets with a single model".
You can use a ListDataset to use your data for this approach:
import pandas as pd
import numpy as np
from gluonts.dataset.common import ListDataset

indices = pd.date_range(start = "2020-01-01", end = "2020-10-30")
#creating some random data
target = np.random.randint(0, 100, size=(3,len(indices))) + np.linspace((1,10,50),(5,20,100), len(indices)).T.astype("int")

time_series_dicts = []
for time_series in target:
    time_series_dicts.append({"target": time_series, "start": indices[0]})
dataset = ListDataset(time_series_dicts, freq=indices[0].freq)
The second approach would be to use a multivariate model like DeepVAREstimator or GPVAREstimator, which learn multivariate distributions. Forecasts from this model will be many-to-many.
You simply have to set one_dim_target=False for the ListDataset, and provide your multi-dimensional target. Here is a toy example:
import pandas as pd
import numpy as np
from gluonts.model.deepvar import DeepVAREstimator
from gluonts.dataset.common import ListDataset
from gluonts.trainer import Trainer


indices = pd.date_range(start = "2020-01-01", end = "2020-10-30")

target = np.random.randint(0, 100, size=(3,len(indices))) + np.linspace((1,10,50),(5,20,100), len(indices)).T.astype("int")

dataset = ListDataset([{"start": indices[0], "target": target}], freq=indices[0].freq, one_dim_target=False)

target_dim = target.shape[0] # 3
trainer = Trainer(epochs=10)

prediction_length = 10

estimator = DeepVAREstimator(target_dim=target_dim,
                             prediction_length=prediction_length,
                             context_length = 20,
                             freq="d",
                             trainer=trainer)

predictor = estimator.train(dataset)

# evaluate your model (should be done on a test set!)
from gluonts.evaluation import MultivariateEvaluator
from gluonts.evaluation.backtest import backtest_metrics

agg_metrics, _ = backtest_metrics(
        test_dataset=dataset,
        predictor=predictor,
        evaluator=MultivariateEvaluator(
            quantiles=(0.1, 0.2, 0.3, 0.4, 0.5, 0.6, 0.7, 0.8, 0.9)
        ))
print(agg_metrics)

# draw some samples from the predicted multivariate distribution

from gluonts.evaluation.backtest import make_evaluation_predictions

forecast_it, ts_it = make_evaluation_predictions(
    dataset=dataset,
    predictor=predictor,
    num_samples=10,
)

forecasts = list(forecast_it)
tss = list(ts_it)

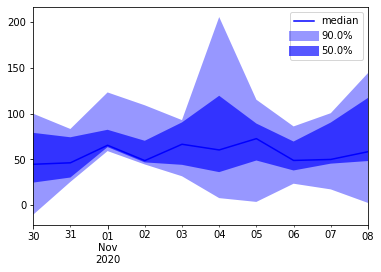
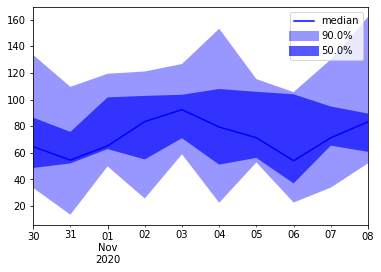
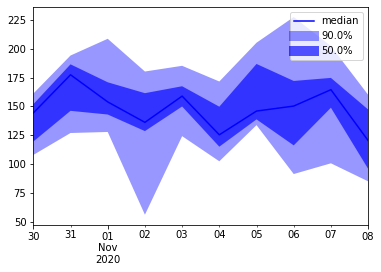
print(forecasts[0].samples.shape) # 10 samples for 4 timesteps from a 3 dim - multivariate distribution
Here is how you can plot the marginal, empirical distributions of the samples:
import matplotlib.pyplot as plt
from gluonts.model.forecast import SampleForecast

forecast = forecasts[0]

for i in range(target_dim):
    f = forecast.copy_dim(i)
    f.plot()
    plt.legend()
    plt.show()
Also, you can take a look at the gluonts.dataset.multivariate_grouper to turn univariate datasets into multivariate datasets easily.
Hope that helps!
 PascalIversen
on 19 Oct 2020
PascalIversen
on 19 Oct 2020
Closing this for now, feel free to reopen and let me know in case you have any further questions.
PascalIversen
on 24 Nov 2020
Hi, I'm attempting to forecast PM10 using temperature, wind speed, wind direction, etc., namely, the history data is the input feature (such as temperature, wind speed ...) and the target (PM10) time series used to train model, and using the future input feature time series to predict PM10. Could you point me to the appropriate model and input formatting to achieve the forecasting use case? Thanks so much! @PascalIversen
 bugsuse
on 2 Dec 2020
bugsuse
on 2 Dec 2020
Related issues
 MaximilianPavon
·
3Comments
MaximilianPavon
·
3Comments
 tm1611
·
5Comments
tm1611
·
5Comments
 AIAficionado
·
7Comments
AIAficionado
·
7Comments
 gjmulder
·
7Comments
gjmulder
·
7Comments
 jaheba
·
4Comments
jaheba
·
4Comments
Most helpful comment
Hello @dmartintucker,
there are two ways to approach this. You could use a univariate, but global model like DeepAR. DeepAR is trained on multiple time series and during inference you can produce forecasts for each single time series. Each forecast will only be conditioned on a single time series, but still, this would be forecasting "multiple targets with a single model".
You can use a
ListDatasetto use your data for this approach:The second approach would be to use a multivariate model like
DeepVAREstimatororGPVAREstimator, which learn multivariate distributions. Forecasts from this model will be many-to-many.You simply have to set
one_dim_target=Falsefor theListDataset, and provide your multi-dimensional target. Here is a toy example:Here is how you can plot the marginal, empirical distributions of the samples:
Also, you can take a look at the
gluonts.dataset.multivariate_grouperto turn univariate datasets into multivariate datasets easily.Hope that helps!