Gluon-ts: DeepAR + NegativeBinomialOutput performance degradation after upgrading from v0.4.2 to 0.5.0
Continuing the discussion started as a part of #872 regarding the experienced performance degradation of NegativeBinomialOutput (NB) with DeepAR after upgrading from v0.4.2 to v0.5.0, I thought to open a dedicated issue for this as I've conducted some extra steps to try to understand this without major success except narrowing the problem down to the convergence of the algorithm after the scaling change done in #719 .
With the data I am modelling with NB in 0.5.0, I tried various hyperparameter settings including changing the learning rate, but all of the trained models had the same issue of too high forecasts and poor convergence. This seems to be a problem especially for the time series in the data for which the scale of the series is high.
Today I tried to replicate the issue with some synthetic data, and managed to get similar behaviour rather easily. The code to replicate is attached below. Basically the algorithm with NegativeBinomialOutput doesn't seem to converge very well and I end up with forecasts that are way above the actuals. I compared this with e.g. the StudentTOutput and PoissonOutput which both work fine out of the box (the same is true for the real data I am working on).
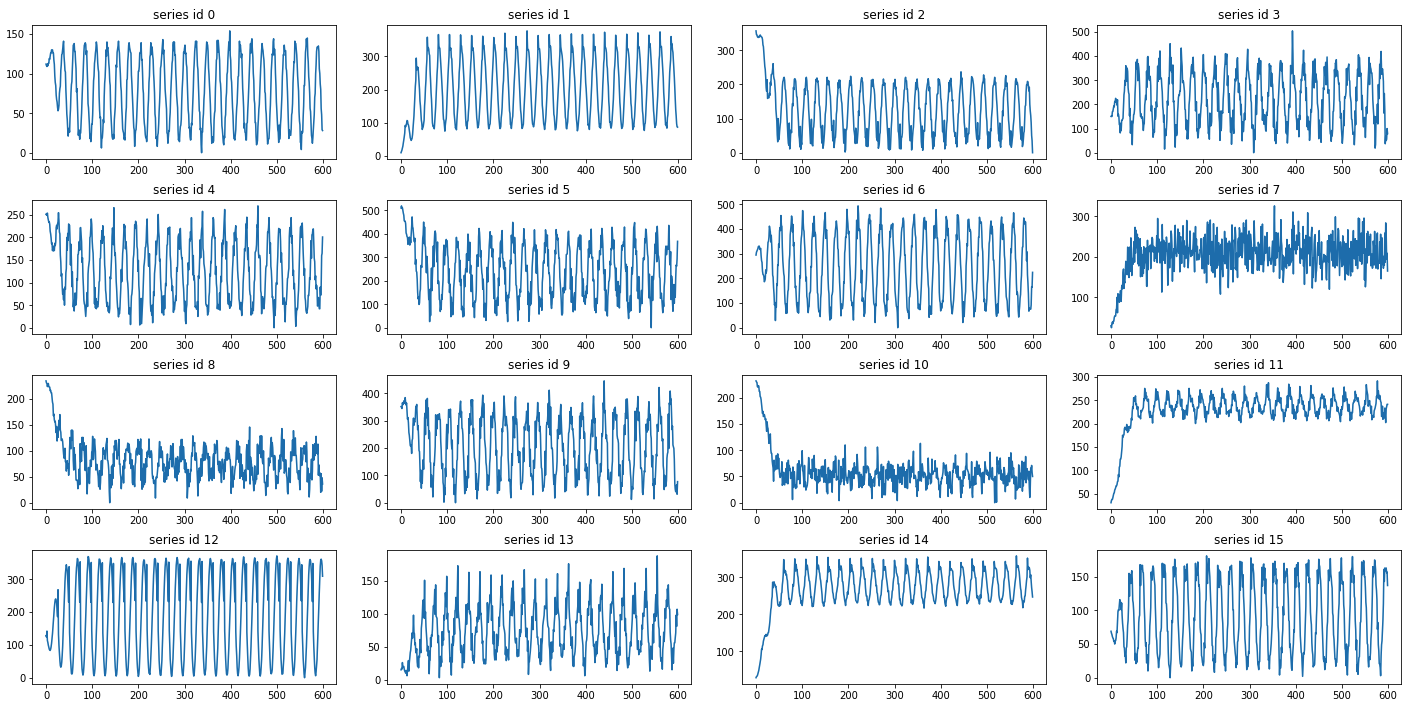
The created data (first 16 time series) look like this:
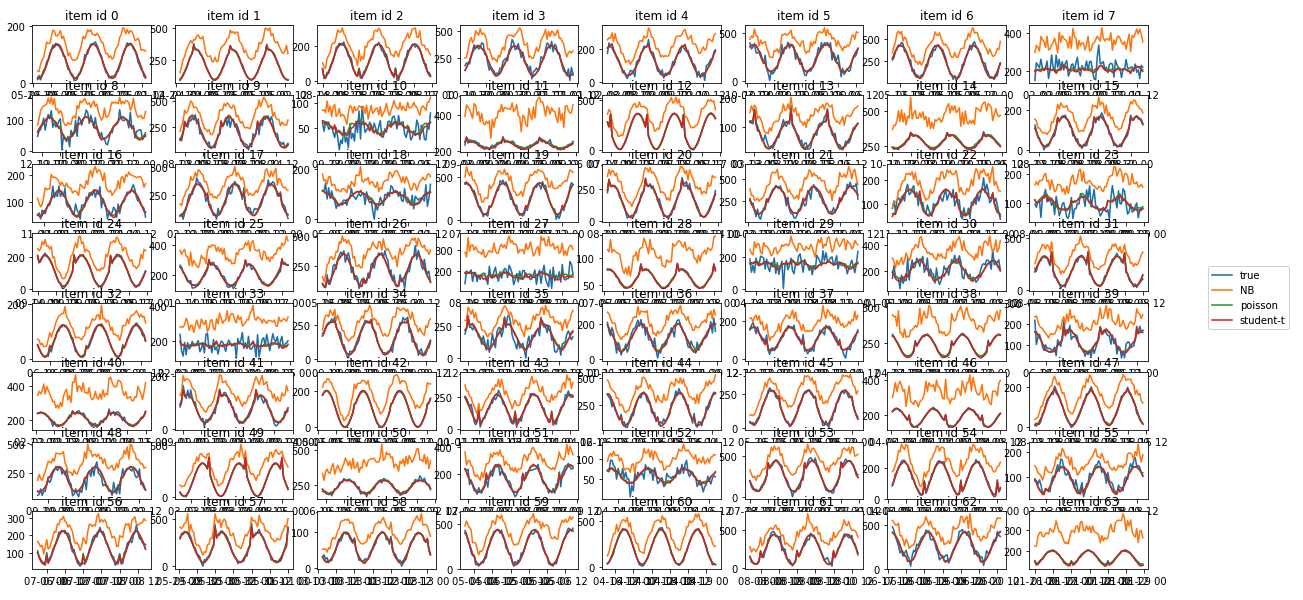
After training the models and comparing the forecasts on the test sets the results (first 64 series) look like this, the NB forecasts are way off even though the other forecasts are fine, and the only change in the model definition is the distr_output:
To try to isolate the problem, I tried changing the line that was changed in #719 for the NB back to what it was in 0.4.2 i.e. alpha = F.broadcast_mul(alpha, F.sqrt(scale + 1.0)), and with this I see better convergence and similar results to Student-t and Poisson outputs. So there seem to be some convergence/other issues with the new scaling that I have not managed to find a way to fix.
This really makes me wonder whether I am missing something important in the optimiser settings or if there is an issue somewhere else. Any help in understanding this is appreciated. In the meanwhile, I am using the Poisson/Student-t Outputs to give me comparable results in v0.5.0 to what I used to get with v0.4.2 and the NB.
The code to produce the results below:
import matplotlib.pyplot as plt
import numpy as np
import pandas as pd
import mxnet as mx

import gluonts
from gluonts.dataset.artificial import ComplexSeasonalTimeSeries
from gluonts.dataset.common import ListDataset
from gluonts.distribution import PoissonOutput, NegativeBinomialOutput, StudentTOutput
from gluonts.model.deepar import DeepAREstimator
from gluonts.model.predictor import Predictor
from gluonts.trainer import Trainer
from gluonts.evaluation.backtest import make_evaluation_predictions


# versions
print(gluonts.__version__)  # 0.5.0
print(mx.__version__)  # 1.6.0
print(pd.__version__)  # 1.0.3
print(np.__version__)  # 1.18.5


# create toy data
prediction_length = 72
dataset_length_min = 672  # 28*24
dataset_length_max = dataset_length_min + 1

artificial_dataset = ComplexSeasonalTimeSeries(
    num_series=75,
    prediction_length=prediction_length,
    freq_str="H",
    length_low=dataset_length_min,
    length_high=dataset_length_max,
    min_val=0,
    max_val=2000,
    is_integer=True,
    proportion_missing_values=0,
    is_noise=True,
    is_scale=True,
    percentage_unique_timestamps=1,
    is_out_of_bounds_date=False,
    seasonality=24,
)


# plot first 16 series
nrow = 4
ncol = 4
fig, ax = plt.subplots(nrow, ncol, figsize=(20,10))
fig.tight_layout(pad=2.0)
for i in range(nrow):
    for j in range(ncol):
        idx = i * ncol + j
        ax[i,j].plot(artificial_dataset.train[idx].get("target"))
        ax[i,j].set_title(f"series id {idx}")


# get train and test sets
train = ListDataset(artificial_dataset.train, freq="1H")
test = ListDataset(artificial_dataset.test, freq="1H")

print(f"train len: {len(train.list_data)}, train shape: {train.list_data[0].get('target').shape}")
print(f"test len: {len(test.list_data)}, test shape: {test.list_data[0].get('target').shape}")


# helpers for training and evaluation
def train_deepar(train_data, distr_output, epochs=100):
    estimator = DeepAREstimator(
        prediction_length=prediction_length,
        context_length=prediction_length,
        num_layers=1,
        num_cells=32,
        cell_type="gru",
        distr_output=distr_output,
        freq="1H",
        trainer=Trainer(
            ctx="cpu",
            epochs=epochs,
            learning_rate=1e-3,
            num_batches_per_epoch=100,
            batch_size=32,
        ),
    )
    predictor = estimator.train(training_data=train_data)
    return estimator, predictor


def get_forecasts(test_data, predictor):
    forecast_it, ts_it = make_evaluation_predictions(
        dataset=test_data,
        predictor=predictor,
        num_samples=100
    )
    forecasts = list(forecast_it)
    tss = list(ts_it)
    return forecasts, tss


# train models
mx.random.seed(42)
np.random.seed(42)

estimator_nb, predictor_nb = train_deepar(train_data=train, distr_output=NegativeBinomialOutput(), epochs=100)
estimator_poi, predictor_poi = train_deepar(train_data=train, distr_output=PoissonOutput(), epochs=100)
estimator_student, predictor_student = train_deepar(train_data=train, distr_output=StudentTOutput(), epochs=100)


# forecast
forecasts_nb, tss_nb = get_forecasts(test, predictor_nb)
forecasts_poi, tss_poi = get_forecasts(test, predictor_poi)
forecasts_student, tss_student = get_forecasts(test, predictor_student)


# plot first 64 series
nrow = 8
ncol = 8
fig, ax = plt.subplots(nrow, ncol, figsize=(20,10))

for row in range(nrow):
    for col in range(ncol):
        idx = row * ncol + col
        if idx < len(tss_nb):
            true = tss_nb[idx][-prediction_length:]
            nb = forecasts_nb[idx].mean_ts
            poi = forecasts_poi[idx].mean_ts
            student = forecasts_student[idx].mean_ts
            index = tss_nb[idx].index[-prediction_length:]
            ax[row, col].plot(index, true)
            ax[row, col].plot(index, nb)
            ax[row, col].plot(index, poi)
            ax[row, col].plot(index, student)
            ax[row, col].set_title(f"item id {idx}")
fig.legend(ax, labels=["true", "NB", "poisson", "student-t"], loc="center right")
 jsirol
All 10 comments
Before we do anything about this, I just want to point out that this is a formidable bug report: thank you for putting so much effort into preparing it
 lostella
on 2 Jul 2020
lostella
on 2 Jul 2020
The M5 13th place solution used gluonts==0.4.2 and mxnet==1.4.1.
We faced some issues getting newer versions of gluonts to work, so we just stuck with 0.4.2. We trained on GPU.
When I tried using negative binomial with M5 dataset on version 0.5, my results were much worse than poisson distribution (WSPL: 0.68 against 0.28).
 kaleming
on 2 Jul 2020
kaleming
on 2 Jul 2020
Before we do anything about this, I just want to point out that this is a formidable bug report: thank you for putting so much effort into preparing it
Thanks! I hope this is helpful in figuring out the issue. Also good to know I am not the only one experiencing this.
jsirol
on 3 Jul 2020
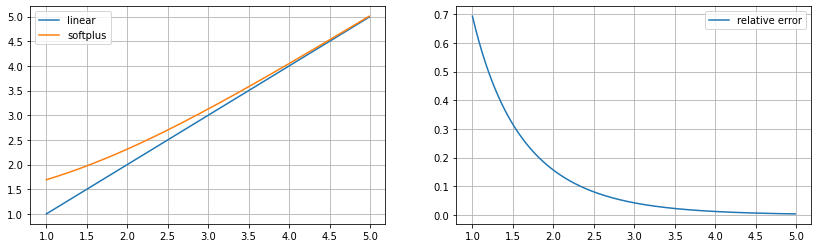
@lostella one minor issue is that when scale=1.0 the transformation https://github.com/awslabs/gluon-ts/blob/master/src/gluonts/mx/distribution/neg_binomial.py#L136
scale = 1.0 + softplus(scale - 1.0) sets the scale to 1.6 which seems which ends up changing the alpha and mu, ideally with scale=1.0 it shouldn't change anything...
 kashif
on 3 Jul 2020
kashif
on 3 Jul 2020
@kashif Good catch! In the interval [1, 5] the error is introduced by this is quite substantial. Have you tried changing that transformation to just clip at 1.0 (I see this was mentioned in the PR that introduced that change, but not compared/validated)?
 jgasthaus
on 3 Jul 2020
jgasthaus
on 3 Jul 2020
thanks @jgasthaus so i am checking with relu etc. I need to make food for the kids and will look again by tonight
kashif
on 3 Jul 2020
On the other hand, the series shown in the plots by @jsirol seem to have have scales in the hundreds (>> 5) where this shouldn't really be an issue.
jgasthaus
on 3 Jul 2020
ok so an alternative way, which i think is easier to think about, is that the NB is the discrete form of the Gamma(alpha, beta) in the sense that NB is just poisson with the rate sampled from a Gamma(alpha, beta) so the scaled rate say c*rate needs to be from Gamma(alpha, beta/c). Thus If I use the total_count and logit parametrizaton of the NB as I have it in pytorch then the scaling only means logit += log(c). This formulation is simpler code as well (without the need for the softplus etc.) and then the above works:
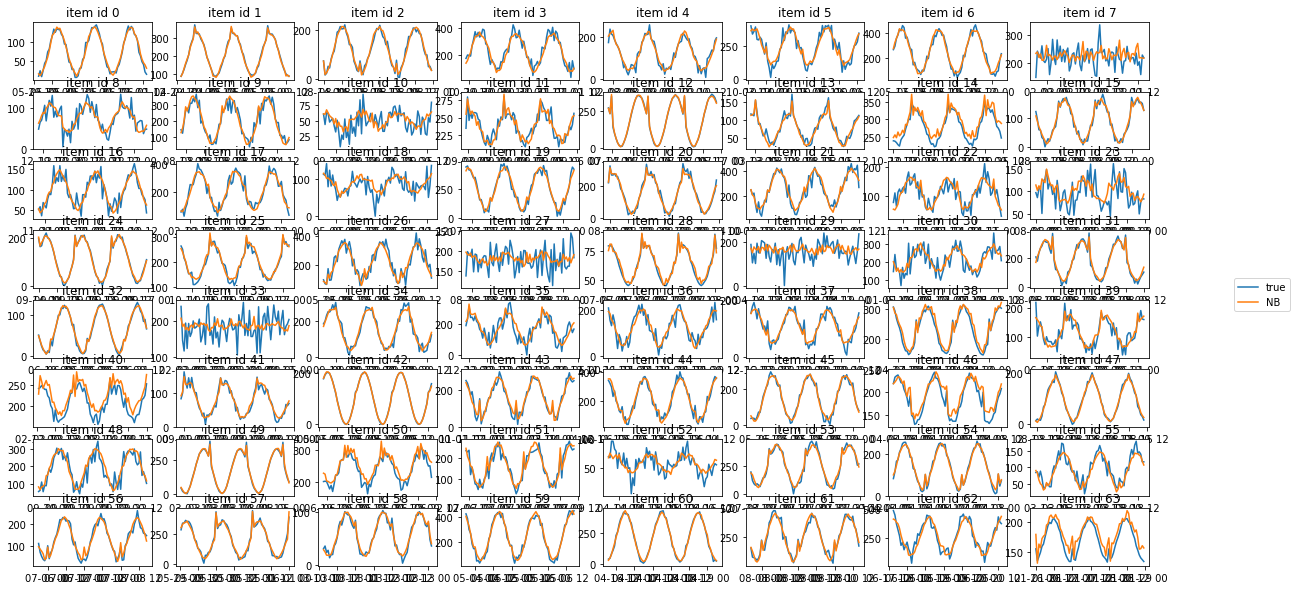
And more importantly the quantiles now seem reasonable:
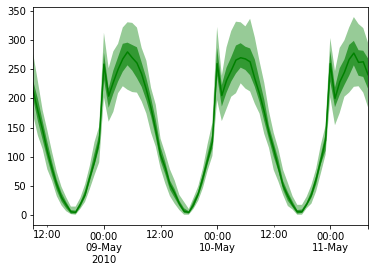
I can send a PR with this method. Here is how i did it on the pytorch side: https://github.com/zalandoresearch/pytorch-ts/blob/master/pts/modules/distribution_output.py#L193-L215
kashif
on 4 Jul 2020
@jsirol can you confirm that #909 fixes this?
lostella
on 12 Jul 2020
@lostella Looks to be working on the latest master, I get expected results with the toy dataset above and my real data which also contains timeseries of varying scales. Thanks @kashif for the fix and the comments on the issue, I think I got a better understanding of what the problem was :+1:
jsirol
on 12 Jul 2020
Related issues
 jaheba
·
4Comments
jaheba
·
4Comments
 gjmulder
·
7Comments
kashif
·
5Comments
jaheba
·
4Comments
gjmulder
·
7Comments
kashif
·
5Comments
jaheba
·
4Comments
 alexhallam
·
5Comments
alexhallam
·
5Comments
Most helpful comment
Before we do anything about this, I just want to point out that this is a formidable bug report: thank you for putting so much effort into preparing it