Gitpod: My workspace is very slow and has a high load average
Describe the bug
Dear Gitpod team, my workspace e892babb-xxxx-xxxx-xxxx-85e3e8236aeb is blocked in "stopping" state and I can't start it again (I have unpushed changes :(
I was developing and the workspace has been slow a few minutes before the block.
To Reproduce
- Start the workspace
- Develop as usual
Expected behavior
Developing all the night :)
 isontheline
All 12 comments
The workspace is now stopped :)
When live again I was able to push my commits :)
The workspace is so slow however...
isontheline
on 10 Sep 2019
Hi @isontheline! So sorry that your workspace was blocked in "stopping" state, and that it was slow. :(
Please re-open this issue if a workspace is blocked or slow again, there may be an underlying problem we need to fix.
@geropl could this somehow be related to our recent workspace manager changes?
 jankeromnes
on 11 Sep 2019
jankeromnes
on 11 Sep 2019
@jankeromnes It's difficult to work this night again :(
Check the load average linked to this picture :
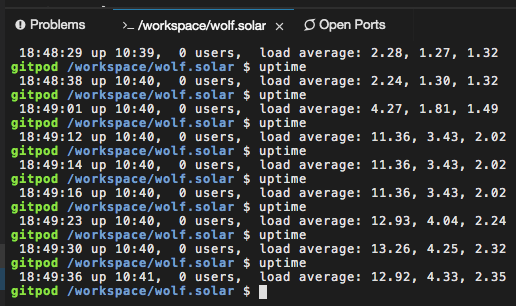
Sometimes load can grow up to 20-24
I'm here if you want I launch any tests on my workspace/container
isontheline
on 11 Sep 2019
Load is stabilized on average 1.5-2.3, so it's usable right now :)
isontheline
on 11 Sep 2019
Thanks a lot for reporting the repeated slowness, and since this seems to be a recurring issue, I think it's worth keeping the issue open until we learn more about it. Also, I'm very sorry that it is disrupting your work.
jankeromnes
on 12 Sep 2019
Looking at our monitoring, it seems indeed like last night there was unusually high CPU activity in one of our EU nodes (both in "user" and "system" CPU times, but not in "iowait" CPU time so it's probably not an I/O problem).
However, we don't really see the same spike in workspace pod CPU usage, so it's a bit puzzling what was taking all that CPU. We'll have a look a non-workspace pods & containers, to see if we find anything there during that time.
jankeromnes
on 12 Sep 2019
So, the good news is that we found two non-workspace containers that used up most of the node's CPU time during the time where your workspace got slow.
The bad news is that Grafana isn't able to tell us any info about these containers (apart from their CPU usage, and the fact that there were indeed on the node that got overloaded -- there is no container name, no pod name, not a single meta data item that could help us identify what these mysterious containers were all about).
jankeromnes
on 12 Sep 2019
We also found unusually high CPU load on the SSH service, and some unusually high network activity on that same node during the same time. I'm wondering if this could mean some sort of SSH attack.
@isontheline hopefully this is not a recurrent issue. But if it happens again, please report back here. That way we'll be able to further correlate the slowness to other monitoring data, and try to find the root cause of the high load. 🙂
jankeromnes
on 12 Sep 2019
No problem I will report any related issues there.
Thank you @jankeromnes and all your team for checking this issue !
Keep up the good work 👍
isontheline
on 12 Sep 2019
I think the fix of #789 have now resolved my issue too
The last 20 days my workspace loaded in 5 minutes (yes 5) and now it's less than 20 seconds.
Thank you Gitpod Team !
isontheline
on 1 Oct 2019
Hello folks,
Problem is here again since several weeks :
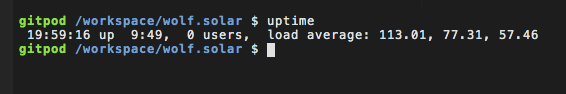
Launching my maven project (17 seconds before) take 4 to 6 minutes... I can't develop anymore on Gitpod (paid user) :(
isontheline
on 11 Dec 2019
Note for posterity: this happened again yesterday because of some crypto-miners we caught. (#993)
jankeromnes
on 12 Dec 2019
Related issues
 akosyakov
·
22Comments
akosyakov
·
22Comments
 geraldthedev
·
21Comments
geraldthedev
·
21Comments
 DaniilNapuda
·
37Comments
DaniilNapuda
·
37Comments
 hossein-pourbozorg
·
21Comments
hossein-pourbozorg
·
21Comments
 ricardorlg
·
20Comments
ricardorlg
·
20Comments
Most helpful comment
I think the fix of #789 have now resolved my issue too
The last 20 days my workspace loaded in 5 minutes (yes 5) and now it's less than 20 seconds.
Thank you Gitpod Team !