Ghidra: Analysis with a large PDB file: java.lang.OutOfMemoryError
Describe the bug
When analyzing a large exe file with a large pdb file, I got the error: java.lang.OutOfMemoryError: Java heap space. I have 32 GB of ram which is not so little.
To Reproduce
Steps to reproduce the behavior:
- Clone the Electron quick start repo and follow the steps:
git clone https://github.com/electron/electron-quick-start
cd electron-quick-start
npm install
npm start
- Load this file in Ghidra:
<dir>\electron-quick-start\node_modules\electron\dist\electron.exe. - Configure Ghidra to download the PDB file from
https://symbols.electronjs.org. - Analyze and see error.
Expected behavior
Analysis proceeds and finishes.
Screenshots
(I didn't make one, let me know if it's needed)
Environment (please complete the following information):
- OS: Win10
- Java Version: 11.0.7
- Ghidra Version: 9.2
Additional context
Electron.exe file size: 117 MB
Electron.exe.pdb file size: 1.94 GB
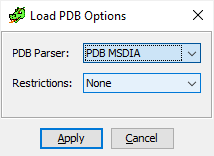
All settings are default. Universal PDB parser (not the MSDIA one) is used as per default.
 justanotheranonymoususer
All 12 comments
This is a known issue for the new PDB. It can currently consume a very large amount of memory with its current processing model. We will need to change the model of how records are read and dealt with, but this would take a bit of work.
For now, there are a couple of choices of how to proceed.
You can increase the amount of memory available to the JVM (though 32GB still might not be enough) using. One example is shown in issue #1997.
You can try to use the PDB MSDIA instead, though you might run into the issue shown in #1207, which also has a work-around.
 ghizard
on 16 Nov 2020
ghizard
on 16 Nov 2020
Thanks. Tried MSDIA, got the same error. But I see that it mentions "new parser" in the call stack. Could it be that the UI to select MSDIA doesn't work? I clicked on "download pdb" and then selected MSDIA.
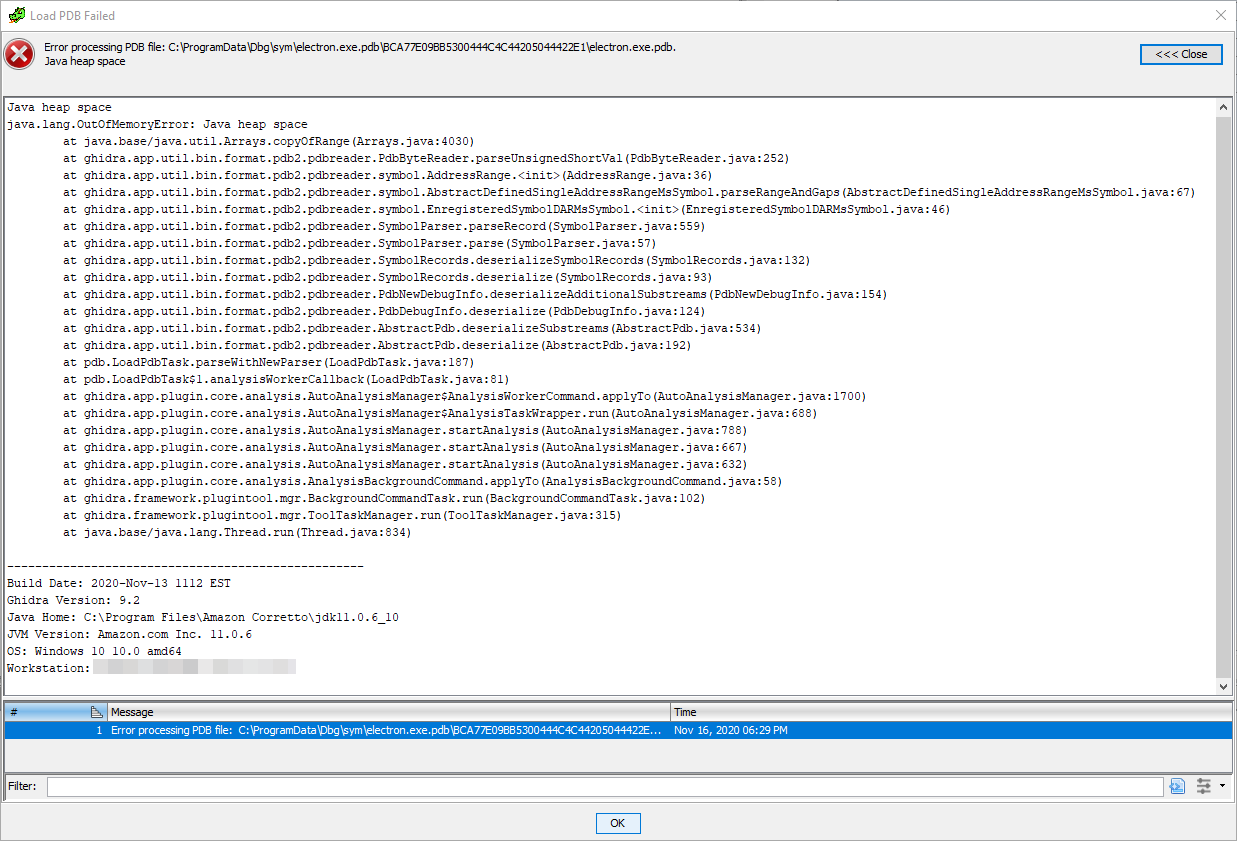
Edit: tried again and got an error without a stack trace: https://i.imgur.com/K2e8WBp.png
justanotheranonymoususer
on 16 Nov 2020
Sorry about that. Will put in to correct the PDB Parser selection problem.
 ghidra1
on 16 Nov 2020
ghidra1
on 16 Nov 2020
PDB Parser selection issue has been resolved in patch and master
ghidra1
on 16 Nov 2020
Thanks. So before the fix, was it the other way around, i.e. was the default actually MSDIA?
justanotheranonymoususer
on 17 Nov 2020
Before Ghidra 9.2, there was no new parser. Only the MSDIA version existed, so the options dialog that had this error was also new for 9.2.
ghizard
on 17 Nov 2020
I know the new parser appeared in 9.2. What I meant is:
In the released 9.2, before the fix, according to the commit, not only selecting MSDIA triggers the new parser, but also selecting the new parser triggers MSDIA. Am I right? That would mean that if I don't change any settings and choose the new parser because it's default, I'm actually using MSDIA. So people won't actually be using the new parser if they don't touch the settings.
justanotheranonymoususer
on 17 Nov 2020
That is correct. In the released 9.2 the effective PDB Parser choice was opposite the displayed choice. Early on, the old MSDIA PDB Parser was the default (i.e., option 0). Prior to release the new Universal PDB Parser was moved to index 0 as the default. However, the useMsDiaParser boolean checking for index-0 choice was not changed with the reversal.
ghidra1
on 17 Nov 2020
I'm asking because I tried both options with 9.2 with this issue. That means that the OutOfMemoryError exception happens for both Universal and MSDIA. i.e. this doesn't help:
You can try to use the PDB MSDIA instead, though you might run into the issue shown in #1207, which also has a work-around.
I tried again and here's the error I got (with MSDIA): https://i.imgur.com/ks3E95h.png
justanotheranonymoususer
on 17 Nov 2020
This is understandable since they both are collecting large amounts of data and organizing within memory (e.g., datatypes, symbols, etc.), Although, I would expect the newer parser may utilize more memory than the old since it is doing everything within the JVM and it tends to hang onto a lot of data until the very end. Have you attempted to increase the MAXMEM for ghidraRun?
ghidra1
on 17 Nov 2020
I tried with MAXMEM set to 28 GB and MSDIA. It went quite far, getting to 63%. Then, it stayed like this:
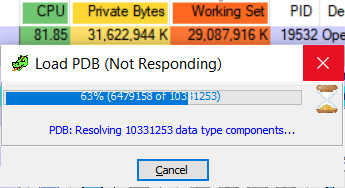
for hours, and seeing that all it does is spinning the CPU fans, I stopped it.
By the way, not sure if that's an issue, but it looks like one: if I open a green window, analyze or do other stuff, get to a large memory usage, and then close the window (while the red window is still open), the large memory usage persists until the Java process is no longer alive. Looks like a major memory leak, unless that's how the GC works or something. Should I create a new issue about it?
justanotheranonymoususer
on 18 Nov 2020
@justanotheranonymoususer re: memory usage... using the OS's view of a java process won't show java memory leaks. The JVM will keep any ram it has allocated from the OS (even after it isn't needed in the java program).
There is a "Show VM memory" on the Help menu of the Ghidra main window. This will show what the VM is allowed to grow to, what it currently has, and inside the VM what is being used, and what is free. The GC button will do a java gc, which will only change the balance between what is free vs used inside the VM. (ie. it probably won't release anything back to the OS)
If you see that used memory still stays high, even after closing the various Ghidra tools, and hitting the GC button, then it might be a Ghidra memory leak.
 dev747368
on 18 Nov 2020
dev747368
on 18 Nov 2020
Related issues
 CalcProgrammer1
·
3Comments
CalcProgrammer1
·
3Comments
 astrelsky
·
3Comments
astrelsky
·
3Comments
 ghost
·
3Comments
ghost
·
3Comments
 loudinthecloud
·
3Comments
loudinthecloud
·
3Comments
 awsaba
·
3Comments
awsaba
·
3Comments
Most helpful comment
@justanotheranonymoususer re: memory usage... using the OS's view of a java process won't show java memory leaks. The JVM will keep any ram it has allocated from the OS (even after it isn't needed in the java program).
There is a "Show VM memory" on the Help menu of the Ghidra main window. This will show what the VM is allowed to grow to, what it currently has, and inside the VM what is being used, and what is free. The GC button will do a java gc, which will only change the balance between what is free vs used inside the VM. (ie. it probably won't release anything back to the OS)
If you see that used memory still stays high, even after closing the various Ghidra tools, and hitting the GC button, then it might be a Ghidra memory leak.