Ghidra: Functions Tags plugin performance issue
Describe the bug
the 'Function Tags' windows take over 5 minutes to display. Resizing of that windows takes over 5m. even closing it takes forever. Usability is not good nor user friendly. Others GUI components like 'Symbols Trees' 'Data type Manager' 'Strings windows' and their filtering do works pretty fast & the responsiveness is good.
'Function Tags' windows do saturate CPU usage at 100%. no error nor stacks trace. and ~/.ghidra/.ghidra_9.2_DEV/application.log dont show errors only console outputs from scripts previously run.
Once opened 'Function Tags' window: the whole ghidra applications becomes unresponsive
To Reproduce
Steps to reproduce the behavior:
- Go and opens Function Tags
Expected behavior
better responsiveness & faster processing.
Environment (please complete the following information):
- OS: linux
- Java Version: OpenJDK 64-Bit Server VM Corretto-11.0.8.10.1 (build 11.0.8+10-LTS, mixed mode)
- Ghidra Version: 02-oct-2020
Additional context
- i have taged 80% of functions in a 150MB static binary with over 120k functions.
- i launch ghidra with the java vm with 8GB of heap. for months without any issue.
- desktop run fine no issue with memory. no memory being swapped. swap usage almost none.
 pabx06
All 6 comments
This should be easy to fix. Please run the jstack command while the window is unresponsive.
jstack <ghidra pid>
The output of this will tell us where the bottleneck resides. Please run this at least twice while the window is unresponsive.
 dragonmacher
on 14 Oct 2020
dragonmacher
on 14 Oct 2020
today : i had to say it is a bit faster . probably because i did saved the changes: so may be the database was defragmented ?
So here is the outputs while frozen:
1) While the windows was first opend :
1.txt
2.txt
3.txt
4.txt
5.txt
6.txt
7.txt
8.txt
2) when selecting an item in the list:
1bis.txt
2bis.txt
3bis.txt
4bis.txt
5bis.txt
6bis.txt
3) any idea on how to run a profiller from within eclipse IDE . i u used to be a java dev 10 years ago we used netbeans IDE witch integrated java profiler
pabx06
on 15 Oct 2020
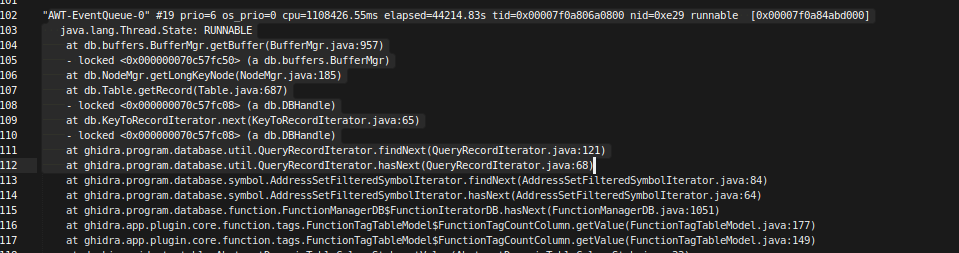
noticed that that hidra.program.database.util.QueryRecordIterator.findNext was inside the stack of "AWT-EventQueue-0"
i if remember well business logic/IO/long processing should be avoided inside UI threads... that might be what is causing the slowdown in the UI ?
pabx06
on 15 Oct 2020
The traces were helpful. I see the issue. You are correct in that any long running operation should not happen in the UI thread. In this case, the Function Tag table is accessing the DB to calculate the number of tags. This is fine for a small number of tags, but devastating when the tag count is large.
Our tables are threaded and designed to perform this type of calculation in the background. This was just an oversight. I will put in a fix.
dragonmacher
on 15 Oct 2020
To work around this issue, disable the 'Count' column. Open the Code Browser tool without opening a program. Open the Function Tags provider. Right-click on the 'Count' column header and select 'Add/Remove Columns'. From the dialog that appears, uncheck the 'Count' column to remove it from the table. This should fix the UI lockup while allowing you to still see the existing function tags.
dragonmacher
on 15 Oct 2020
To work around this issue, disable the 'Count' column. Open the Code Browser tool _without opening a program_. Open the Function Tags provider. Right-click on the 'Count' column header and select 'Add/Remove Columns'. From the dialog that appears, uncheck the 'Count' column to remove it from the table. This should fix the UI lockup while allowing you to still see the existing function tags.
it did that : it is faster down to couple of seconds... but there is no progress bar. so you wonder few sec what is going on... then data show up
pabx06
on 16 Oct 2020
Related issues
 CalcProgrammer1
·
3Comments
CalcProgrammer1
·
3Comments
 toor-de-force
·
3Comments
toor-de-force
·
3Comments
 Barakat
·
3Comments
Barakat
·
3Comments
 tambry
·
3Comments
tambry
·
3Comments
 Merculous
·
3Comments
Merculous
·
3Comments
Most helpful comment
The traces were helpful. I see the issue. You are correct in that any long running operation should not happen in the UI thread. In this case, the Function Tag table is accessing the DB to calculate the number of tags. This is fine for a small number of tags, but devastating when the tag count is large.
Our tables are threaded and designed to perform this type of calculation in the background. This was just an oversight. I will put in a fix.