Ghcide: Hover performance is still far too slow (and worse with multiple threads)
There have been previous issues about hover performance in big projects but so far no substantial progress has been made.
I tried again today on ghc/Main.hs with the wip/multi-rebased branch which is based on #457 and things seemed very bad still.
- With
optThreads = 1- Hover time was 2.2s - With
optThreads = 0- Hover time was 6.5s
I tried on the command line and in the editor and could reproduce similar numbers in both, so it's not entirely to do with the FileExists logic which previously closed #101.
Here is the profile of performing a single hover request.
https://gist.github.com/mpickering/c12db7d1b9c0724024259f8411189ca6
Load the JSON into speedscope.app in order to view it.
I can't believe that I am the only person who observes this or wants this fixed! But it seems like I am so far the only person to complain about it.
Also see #101 and #485
 mpickering
All 29 comments
Without profiling turned on the times are
optThreads = 1= 1.3soptThreads = 0= 2s
mpickering
on 23 Mar 2020
Can you share a Shake profile ?
 pepeiborra
on 23 Mar 2020
pepeiborra
on 23 Mar 2020
Now I have turned off (Haskell) profiling, after the first hover, it seems that the hover call is down to 0.7s which feels more acceptable. I wonder if this was fixed by #471
mpickering
on 23 Mar 2020
That is, 0.7s with optThreads = 1, optThreads = 0 is still too slow at over 1.5s.
mpickering
on 23 Mar 2020
Shake profile, it is not very useful imo: https://gist.githubusercontent.com/mpickering/25b13bf30f6558f18487501c3ec4f63b/raw/eff7933fba95d2f148a3ea5256a0a807ed3cecf3/ide-20200323-113440-00006-0.49.html
mpickering
on 23 Mar 2020
Shake profile, it is not very useful imo: https://gist.githubusercontent.com/mpickering/25b13bf30f6558f18487501c3ec4f63b/raw/eff7933fba95d2f148a3ea5256a0a807ed3cecf3/ide-20200323-113440-00006-0.49.html
It doesn't tell us the cause, but at least it rules out GetFileExists as the culprit, as the Shake profile shows the only invocations of this rule are for interface files, expected since they do not live in the workspace
pepeiborra
on 23 Mar 2020
Any chance of a normal .prof output? I'm used to reading those and have all the right tools to do so. While this profile view might (or might not) be better, I'd probably want to start with a simpler problem and build up to learning how it works, whereas with this code I'm totally lost.
The code appears to call getSrcSpanInfos which then calls evalGhcEnv multiple times. Why? I have no idea. I guess it's under runGhcEnv somewhere? But each call makes one call to runGhcEnv, so why multiple ones?
Another view has ioMsgMaybe taking all the time. That seems odd.
My guess is I'm not reading the profile right.
 ndmitchell
on 23 Mar 2020
ndmitchell
on 23 Mar 2020
@ndmitchell Nope, not easily because the .prof file is dominated by the initial loading of the project. This profile is for a single hover request which is not easy to isolate in a .prof file.
The first pane does not appear to be very useful here, that's shows an execution trace of the hover. The "left-heavy" pane is like the flamegraph output, similar to what is in a .prof file.
ioMsgMaybe is probably not taking up a lot of time, but there are also probably no cost centres underneath that. The whole call is underneath the getSrcSpanInfos cost centre though, so that will only happen on the first request so probably best to ignore that part of the profile. I would concentrate on the latter half of the left-heavy view, where there is 1s of internal computation which will happen on every hover request.
The other question which can't really be observed in the profile is why optThreads = 1 is so much faster than any other setting I tried.
mpickering
on 23 Mar 2020
Thanks @mpickering - looking at it with that information in my brain, I see:
- Would be good to get the second execution. The 1s of internal computation definitely includes things that are only run once, but very hard to figure out which such things they are. My guess is everything under
buildOneis a build only, and that subsequent runs don't rebuild - but if they did, that would be the root cause. If you exclude things not underbuildOneor the GHC call, you're down to about 100ms, which doesn't match what you are seeing. runKeycallsnubDepends. That's 161ms, which is awfully heavy. Would be great to get execution counts rather than just times. With that information I'd know how many calls there were to nubDepends and how many to insert. This should be something only called once, but entirely possible it isn't and that's a bug.- buildRunDependenciesChanged calls fmap which is taking a huge amount of time for an fmap. Would be again good to know how many times it changes, and whether this is on every run or just first time. I have no idea what that fmap is doing.
ndmitchell
on 23 Mar 2020
Here is the JSON for the second hover. Bare in mind again, that this is with optsThread = 1, which makes the performance close to acceptable.
The
fmapcomes fromsrc/General/Wait.hs, it would be good to know what function this is called with so I can insert more cost centres.Looking in the first pane of the profile, I found a call to
nubDependsand it is called a lot of times, lasting either 1-2 frames for each call.The calls to
fmapunderbuildRunDependenciesChangedseem to happen just after thenubDependscalls and last around 1-3 frames in general.
mpickering
on 23 Mar 2020
Trying on a smaller project (ghcide)
optThreads = 1- 0.05 hover responseoptThreads = 0- 0.35 hover response
Seems like I will be compiling my forks with optThreads = 1 for the foreseeable future.
mpickering
on 23 Mar 2020
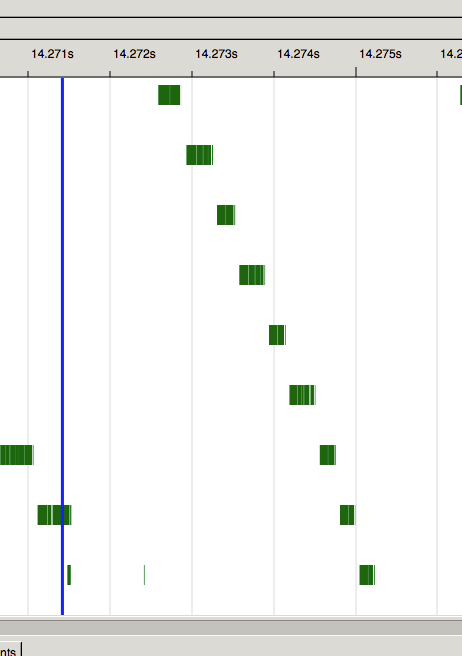
Looking in threadscope, it is clear that the work is not split across the available cores. There is barely any overlap between the different HECs which is why the single threaded version is much faster.
mpickering
on 24 Mar 2020
Just to add another data point, in our codebase at StanChart, on my Xeon Gold 6234 with 16 physical cores:
- 1 thread: boot time is 2m, hover time is 0.7s
- 16 threads: boot time is ~1m20s, hover time is 1.02s
- 15 threads: boot time is ~1m10s, hover time is 1s
- 4 threads: boot time is 1m30s, hover time is 1s
We know that Shake parallelizes real builds really well, but it seems clear the same strategy doesn't work so well for ghcide where some of the rules are very fast and the overheads of parallelizing them outweigh the benefits. @ndmitchell is there a way to make some rules sequential, like GetFileExists and GetModTime?
pepeiborra
on 24 Mar 2020
Thanks @pepeiborra, I can also observe in theadscope all cores being utilised during initialisation so your numbers make sense to me.
mpickering
on 24 Mar 2020
@pepeiborra Are those initial hover numbers or subsequent hover numbers after the hover information has been computed and cached?
mpickering
on 24 Mar 2020
Subsequent. The initial one is around 5-6 seconds.
pepeiborra
on 24 Mar 2020
I experimented with removing the shake scheduler, just forking threads and leaving it up to the GHC scheduler. This didn't seem to have any consistent negative impact on ghcide or hadrian performance(in fact building ghc became very slightly faster on my machine). After this, I modified the scheduler to use forkOn instead of forkIO to run actions on a fixed capability if their previous run took less time than a threshold value(currently 50ms). This seemed to bring hover performance in line with what @mpickering and @pepeiborra are seeing with the optThreads = 1 version, while still retaining some parallelism for the boot procedure and other expensive actions.
You can find my branch here.
 wz1000
on 29 Mar 2020
wz1000
on 29 Mar 2020
Here is an eventlog with the regular scheduler that shows hover taking ~0.2s: https://drive.google.com/open?id=1TkD6IAav3l2vSXECjdiNYCfYvLy-9a6y
Here is an eventlog with my branch that shows hover taking ~0.02s: https://drive.google.com/open?id=1fwnqtEj4dk7_ZTw3faeHRzGTCnq-0HqX
wz1000
on 29 Mar 2020
@wz1000, I would be very interested in seeing an eventlog of your branch without forkOn. Really forkIO should be the right choice here. Bound threads incur overheads that you really don't want (see GHC #18221).
 bgamari
on 24 May 2020
bgamari
on 24 May 2020
@bgamari the first eventlog linked above is the one without forkOn
wz1000
on 24 May 2020
Looking at your Shake profile, I see 12,140 calls to DoesFileExist, which will be responsible for about two thirds of the threads being spawned. However, the huge number of DoesFileExist was to cope with the fact that GHC used a flat hierarchy with lots of include directories (a very odd approach to Haskell code layout). If the compiler include path is set properly, I would expect 521 such calls. Can we rebenchmark with a GHC using proper hierarchy? And confirm the include paths have been adjusted appropriately?
ndmitchell
on 24 May 2020
As for whether making some rules like modtime/does-file-exist faster, yes, we could certainly have a flag that rules could declare they should be run on the existing thread, not spawn a new thread. That's how Shake used to work a few years ago, and then I generalised it, however, I'd be keen to see benchmarks showing what is slow, and thus measuring improvements, so we can make sure we are targeting the right place.
ndmitchell
on 24 May 2020
Using Ghcide HEAD, Windows, GHC 8.6.5, I wrote a benchmark that loads up Shake and does 1000 hover requests, with threaded/N4. It uses the root module which has about 100 dependencies. I hacked Ghcide to make sure I always took the doesFileExist fast-path. Benchmark code at https://gist.github.com/ndmitchell/11467985dbf1855e62035fa97248a585. I compiled in Shake (so I could get better profiling and experiment quicker) and took a look at what happened if I made certain changes (these are for 1K requests, so divide by 100 to see the real time):
- Running normally: 9.77s
- Switching to forkOn: 10.65s
- optThreads=1: 13.65s
- Avoid spawning threads for things I think will be cheap: 7.49s
- Avoid doing any Shake invalidation: 0.31s
The last of these is wrong, but a very useful lower-bound. Looking at the rules that I couldn't count as cheap, I got the list I've pasted in #583. A 25% performance increase would be nice, but it's hardly going to change the world, so I'm inclined to investigate more before adding spawn avoidance. Running profiling on the version that avoids spawning threads for things that I think will be cheap showed:
- 11% goes on getModTime.
- 10% to hash table manipulations
- A bunch of cost smeared out through Shake building stuff. Maybe 40%? Very hard to tell and I suspect profiling makes it even worse.
There seem several ways to go:
- Consider my benchmark wrong, because of some factor. Maybe the 5x modules in GHC gets us an algorithmic slowdown? Maybe 0.2s x 5 = 1s is just too high? (I agree, it's not a good number.)
- Figure our what is slow. We walk 1000 nodes, spawn some threads, do 100+ IO operations. But I don't have a good answer to where the time goes, beyond modtime, and that's only 10%. But we're at 0.10 seconds, which is a meaningful amount of time.
- Consider whether Shake is too heavy-weight. The way to approach that would be to merge all the long-lived branches, abstract out the Shake API, then consider a clean-room forward-mode implementation. Infeasible with so many patches in flight.
- Use stale versions to compute hover information. If we did that, we'd be at 30ms for hover requests, we wouldn't be linear in the size of the files, we wouldn't do any IO operations. Many performance concerns would just disappear in a flash and we'd have a lot more scope to get things wrong before users noticed.
ndmitchell
on 25 May 2020
Approach (4) is the one I've been pursuing at https://github.com/wz1000/ghcide/tree/hiedb
The idea is to aggressively reuse stale results, and rely on hiedb to answer queries. In this model, ghcide acts as a sort of indexing service for hiedb, generating .hi and .hie files which are indexed and saved in the database, available for all future queries, even across restarts. A local hot cache of .hie files/typechecked modules is maintained on top of this to answer queries for files of interest (the ones the user is currently editing). All information that is not in some sense "local" to a particular module is accessed through the database, and local information (like references of local variables and types) is available through these hot caches.
The invariant we try to maintain is that of eventual consistency and instant responsiveness, rather than 100% accuracy, which I think is more suitable for an IDE. The responses get progressively better as the index state catches up to the expected state, but in practice this often seems to be good enough.
The hover, go to (type) definition, references, document highlight and workspace symbols requests have been (re)written to fit in this model. This week I plan to finish my work on teaching hiedb to index .hi files, so that module imports, identifiers exported from modules, their types and their documentation is also stored in the database, which we can then use to serve completion requests.
I can indeed confirm that the IDE is extremely responsive with this branch, and can even answer many requests instantly on startup, even before the initial load and session setup has completed, provided that a previous run had saved an .hie file to disk.
wz1000
on 25 May 2020
@wz1000 the hiedb approach would also be scalable to large codebases, which is a big deal. Let's have this.
@ndmitchell did you measure allocations for any of the experiments? The unexplained time could be going into synchronization and gc pauses. The 'ShakeSession' approach achieves Shake invalidation avoidance for hovers and goto-definition, but not for completions - reading completions directly from the state seems the only way to go.
pepeiborra
on 25 May 2020
The approach sounds super amazing to me. I didn't measure allocations for the experiments, but my benchmark sends the messages sequentially, so there would have been no impact from the ShakeSession changes. Could have definitely been timings going into GC/synchronisation, but not obvious why.
ndmitchell
on 25 May 2020
The approach sounds super amazing to me. I didn't measure allocations for the experiments, but my benchmark sends the messages sequentially, so there would have been no impact from the ShakeSession changes. Could have definitely been timings going into GC/synchronisation, but not obvious why.
There would have been a very noticeable impact, as no Shake cache invalidation would have happened unless your benchmark makes any edit. So I would expect the benchmark to complete in 0.30s
pepeiborra
on 25 May 2020
There would have been a very noticeable impact, as no Shake cache invalidation would have happened unless your benchmark makes any edit.
Ah, I hadn't remembered that. Yeah, mine was before your changes, which I imagine will have a huge impact.
ndmitchell
on 25 May 2020
I measured again, after the impact of fixing hash collisions in #588. This time I took the approach of knocking things out, which are required for correctness, and seeing how much time remained. 100 hover runs was the benchmark. Some times vary by 0.5s between runs, so take it as indicative.
- Full run: 9.31s.
- Turn off running the Ghcide level-rules, making them all short circuit. 4.44s. I believe #583 is approximately what that measures, so a 50% speedup.
- As above, plus always use the same thread, so avoid the Shake thread pool: 3.84s. So any changes to the Shake thread pool (if this benchmark is to be believed) are likely to come in at < 15% improvement.
- Turn off all Shake operations: 0.31s. Suggests the overhead of Shake is 10x over doing just the hover operation.
My suggestion is we turn the benchmarking tools into real tools #582, or wait for telemetry, then solicit more repeatable and diverse benchmarks that either back up the initial results at the top of this thread, or show that enough has changed it is no longer true.
ndmitchell
on 28 May 2020
Related issues
 istathar
·
8Comments
istathar
·
8Comments
 googleson78
·
9Comments
googleson78
·
9Comments
 anka-213
·
5Comments
anka-213
·
5Comments
 bubba
·
4Comments
bubba
·
4Comments
 domenkozar
·
3Comments
domenkozar
·
3Comments
Most helpful comment
Approach (4) is the one I've been pursuing at https://github.com/wz1000/ghcide/tree/hiedb
The idea is to aggressively reuse stale results, and rely on
hiedbto answer queries. In this model,ghcideacts as a sort of indexing service forhiedb, generating.hiand.hiefiles which are indexed and saved in the database, available for all future queries, even across restarts. A local hot cache of.hiefiles/typechecked modules is maintained on top of this to answer queries for files of interest (the ones the user is currently editing). All information that is not in some sense "local" to a particular module is accessed through the database, and local information (like references of local variables and types) is available through these hot caches.The invariant we try to maintain is that of eventual consistency and instant responsiveness, rather than 100% accuracy, which I think is more suitable for an IDE. The responses get progressively better as the index state catches up to the expected state, but in practice this often seems to be good enough.
The hover, go to (type) definition, references, document highlight and workspace symbols requests have been (re)written to fit in this model. This week I plan to finish my work on teaching
hiedbto index.hifiles, so that module imports, identifiers exported from modules, their types and their documentation is also stored in the database, which we can then use to serve completion requests.I can indeed confirm that the IDE is extremely responsive with this branch, and can even answer many requests instantly on startup, even before the initial load and session setup has completed, provided that a previous run had saved an
.hiefile to disk.