Ggraph: Incorrect edge attributes depending on loops and end_cap
This seems related to #62, but that issue was closed and I'm seeing this in version 1.0.1.
The below example contains a loop and specifies end_cap for the edges, and one of the edges is the wrong color. The next examples show that it plots correctly when the loop is replaced with a non-loop edge, when the loop is listed after the other edges, and when end_cap is not specified.
The problem persists when using an undirected graph, when using geom_edge_link or geom_edge_arc instead of geom_edge_fan, and when omitting the geom_edge_loop call.
library(ggraph)
library(igraph)

## Incorrect when loop listed first
d <- data.frame(node1 = c('C', 'A', 'B'),
                node2 = c('C', 'B', 'A'),
                value = c('Y', 'X', 'X'))
g <- graph_from_data_frame(d, directed = TRUE)
ggraph(g, layout = 'nicely') +
  geom_edge_fan(aes(color = value),
                end_cap = circle(5, 'mm')) +
  geom_edge_loop(aes(color = value)) +
  geom_node_label(aes(label = name))

## Correct when no loop
d <- data.frame(node1 = c('C', 'A', 'B'),
                node2 = c('D', 'B', 'A'),
                value = c('Y', 'X', 'X'))
g <- graph_from_data_frame(d, directed = TRUE)
ggraph(g, layout = 'nicely') +
  geom_edge_fan(aes(color = value),
                end_cap = circle(5, 'mm')) +
  geom_edge_loop(aes(color = value)) +
  geom_node_label(aes(label = name))

## Correct when loop listed third
d <- data.frame(node1 = c('A', 'B', 'C'),
                node2 = c('B', 'A', 'C'),
                value = c('X', 'X', 'Y'))
g <- graph_from_data_frame(d, directed = TRUE)
ggraph(g, layout = 'nicely') +
  geom_edge_fan(aes(color = value),
                end_cap = circle(5, 'mm')) +
  geom_edge_loop(aes(color = value)) +
  geom_node_label(aes(label = name))

## Correct when no end_cap specified
d <- data.frame(node1 = c('C', 'A', 'B'),
                node2 = c('C', 'B', 'A'),
                value = c('Y', 'X', 'X'))
g <- graph_from_data_frame(d, directed = TRUE)
ggraph(g, layout = 'nicely') +
  geom_edge_fan(aes(color = value)) +
  geom_edge_loop(aes(color = value)) +
  geom_node_label(aes(label = name))
 daniel-munro
All 12 comments
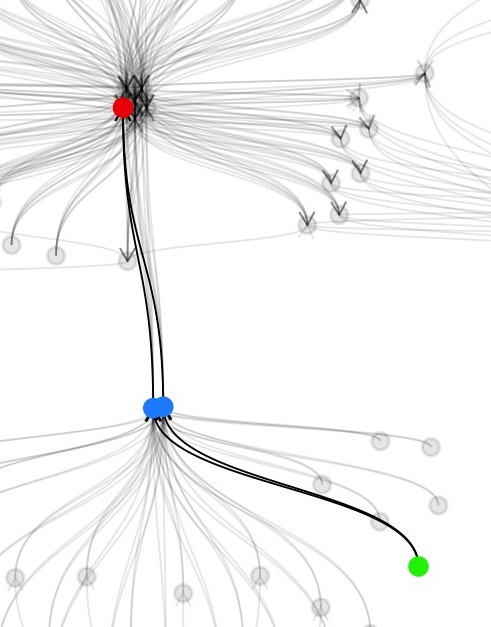
I am also having a problem with the edge attribute edge_alpha sometimes being misplaced when specifying end_cap or start_cap to anything besides 0. Below is the end_cap and start_cap set to 0 with the edges coming from the green node to the two blue nodes weighted correctly:
Below is the result of only changing end_cap and start_cap to 2. The red arrow points at the misplaced edge attribute:
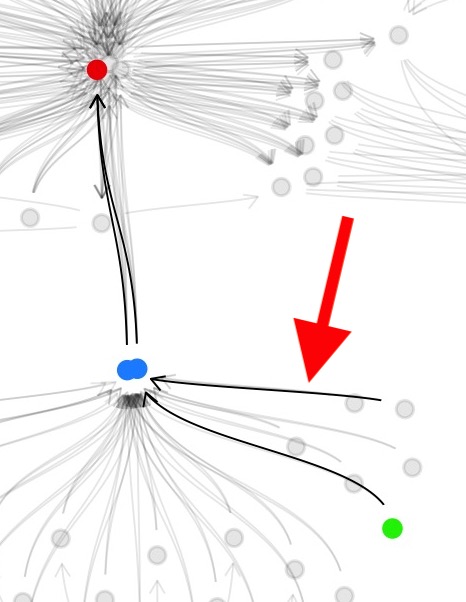
I can provide more detail if requested.
 jhrcook
on 12 Nov 2018
jhrcook
on 12 Nov 2018
I can confirm this. Seems to be related to #150. I'm using ggraph 1.0.2.
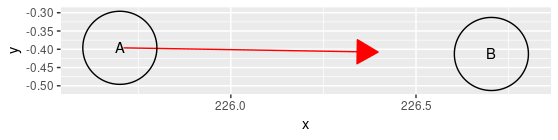
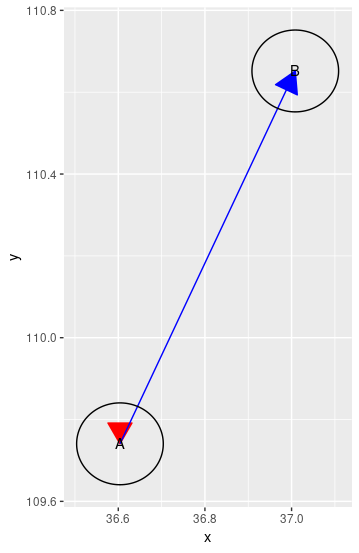
I can reproduce the bug with the code below. In this plot, loop A→A is missing; edge A→B is missing its start_cap, and A→B should be coloured blue.
library(tidyverse)
library(tidygraph)
library(ggraph)

edges <-
  tribble(
    ~from, ~to, ~effect,
    "A", "A", "red",
    "A", "B", "blue"
  )

set.seed(1)
ggraph(tbl_graph(edges = edges), layout = "nicely") +
  geom_edge_fan(
    aes(colour = effect),
    start_cap = circle(30, "mm"), end_cap = circle(30, "mm"),
    arrow = grid::arrow(type = "closed")
  ) +
  geom_node_circle() +
  geom_node_text(aes(label = name)) +
  scale_edge_colour_identity()
If I remove the self loop from the tibble, the bug does not occur.
edges <-
  tribble(
    ~from, ~to, ~effect,
    "A", "B", "blue"
  )

set.seed(1)
ggraph(tbl_graph(edges = edges), layout = "nicely") +
  geom_edge_fan(
    aes(colour = effect),
    start_cap = circle(30, "mm"), end_cap = circle(30, "mm"),
    arrow = grid::arrow(type = "closed")
  ) +
  geom_node_circle() +
  geom_node_text(aes(label = name)) +
  scale_edge_colour_identity()
If I remove the start_cap and end_cap, the problem also does not occur.
edges <-
  tribble(
    ~from, ~to, ~effect,
    "A", "A", "red",
    "A", "B", "blue"
  )

set.seed(1)
ggraph(tbl_graph(edges = edges), layout = "nicely") +
  geom_edge_fan(
    aes(colour = effect),
    arrow = grid::arrow(type = "closed")
  ) +
  geom_node_circle() +
  geom_node_text(aes(label = name)) +
  scale_edge_colour_identity()
 rcannood
on 16 Apr 2019
rcannood
on 16 Apr 2019
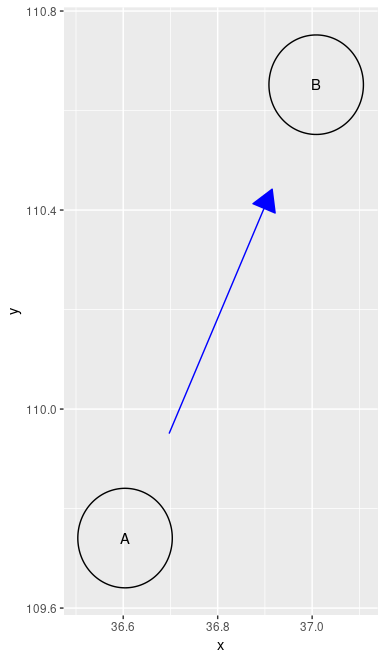
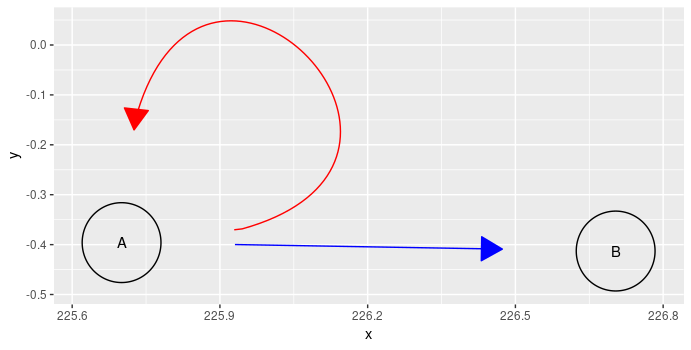
Here is a workaround, by filtering out self loops in geom_edge_fan() using the filter aesthetic (Thanks @zouter).
library(tidyverse)
library(tidygraph)
library(ggraph)

edges <-
  tribble(
    ~from, ~to, ~effect,
    "A", "A", "red",
    "A", "B", "blue"
  )

set.seed(1)
ggraph(tbl_graph(edges = edges), layout = "nicely") +
  geom_edge_loop(
    aes(colour = effect),
    start_cap = circle(30, "mm"), end_cap = circle(30, "mm"),
    arrow = grid::arrow(type = "closed")
  ) +
  geom_edge_fan(
    aes(colour = effect, filter = from != to),
    start_cap = circle(30, "mm"), end_cap = circle(30, "mm"),
    arrow = grid::arrow(type = "closed")
  ) +
  geom_node_circle(aes(r = .08)) +
  geom_node_text(aes(label = name)) +
  scale_edge_colour_identity()
rcannood
on 16 Apr 2019
@thomasp85 : I hope the example and the workaround shown above can help you get to the bottom of this.
rcannood
on 16 Apr 2019
I am not able to reproduce any of your problems, but the edge-capping stuff is pretty involved so maybe it's something on my end.
Can I get one of you to upgrade to the latest development version and see if you can provoke this bug to appear again and if so, post (another) reprex?
 thomasp85
on 12 Aug 2019
thomasp85
on 12 Aug 2019
I tried it in the latest development version and no longer see the bug, for any of the cases I had mentioned.
daniel-munro
on 12 Aug 2019
Thanks for confirming... I made a lot of fixes a year or so ago but apparently didn't close all affected issues. Will close this
thomasp85
on 12 Aug 2019
@thomasp85 This problem still occurs on the CRAN version of ggraph. When are you planning to push these fixes to CRAN?
rcannood
on 15 Aug 2019
Yes they do... I'm currently working on a new release which will include this fix. I can't give you an ETA, but soon... In the meantime just install from GitHub
thomasp85
on 15 Aug 2019
I'm currently working on a new release
Alright thanks! :+1:
In the meantime just install from GitHub
I can't seem to convince CRAN to let me include Remotes: thomasp85/ggraph in my packages, so this is a little difficult :wink: I'll just wait a little until the update hits CRAN.
rcannood
on 15 Aug 2019
Ah, yes — if you are waiting because of a package release of your own you'll just have to be patient
thomasp85
on 15 Aug 2019
I noticed the new release of ggraph on CRAN. Thanks for your hard work! :)
rcannood
on 5 Sep 2019
Related issues
 jalapic
·
3Comments
jalapic
·
3Comments
 jas1
·
14Comments
jas1
·
14Comments
 mbojan
·
6Comments
mbojan
·
6Comments
 balthasarbickel
·
3Comments
balthasarbickel
·
3Comments
 zephyris
·
4Comments
zephyris
·
4Comments