Gekko: StratRunner page missing crucial info
Unable to see if this is a Live or Paper trader
Unable to see what candle size and warmup were specified

 rcoenen
All 5 comments
Very good points, I want to redesign this page and have been working on some sketches. What do you think of the following:
(list of what I want to show on this page)
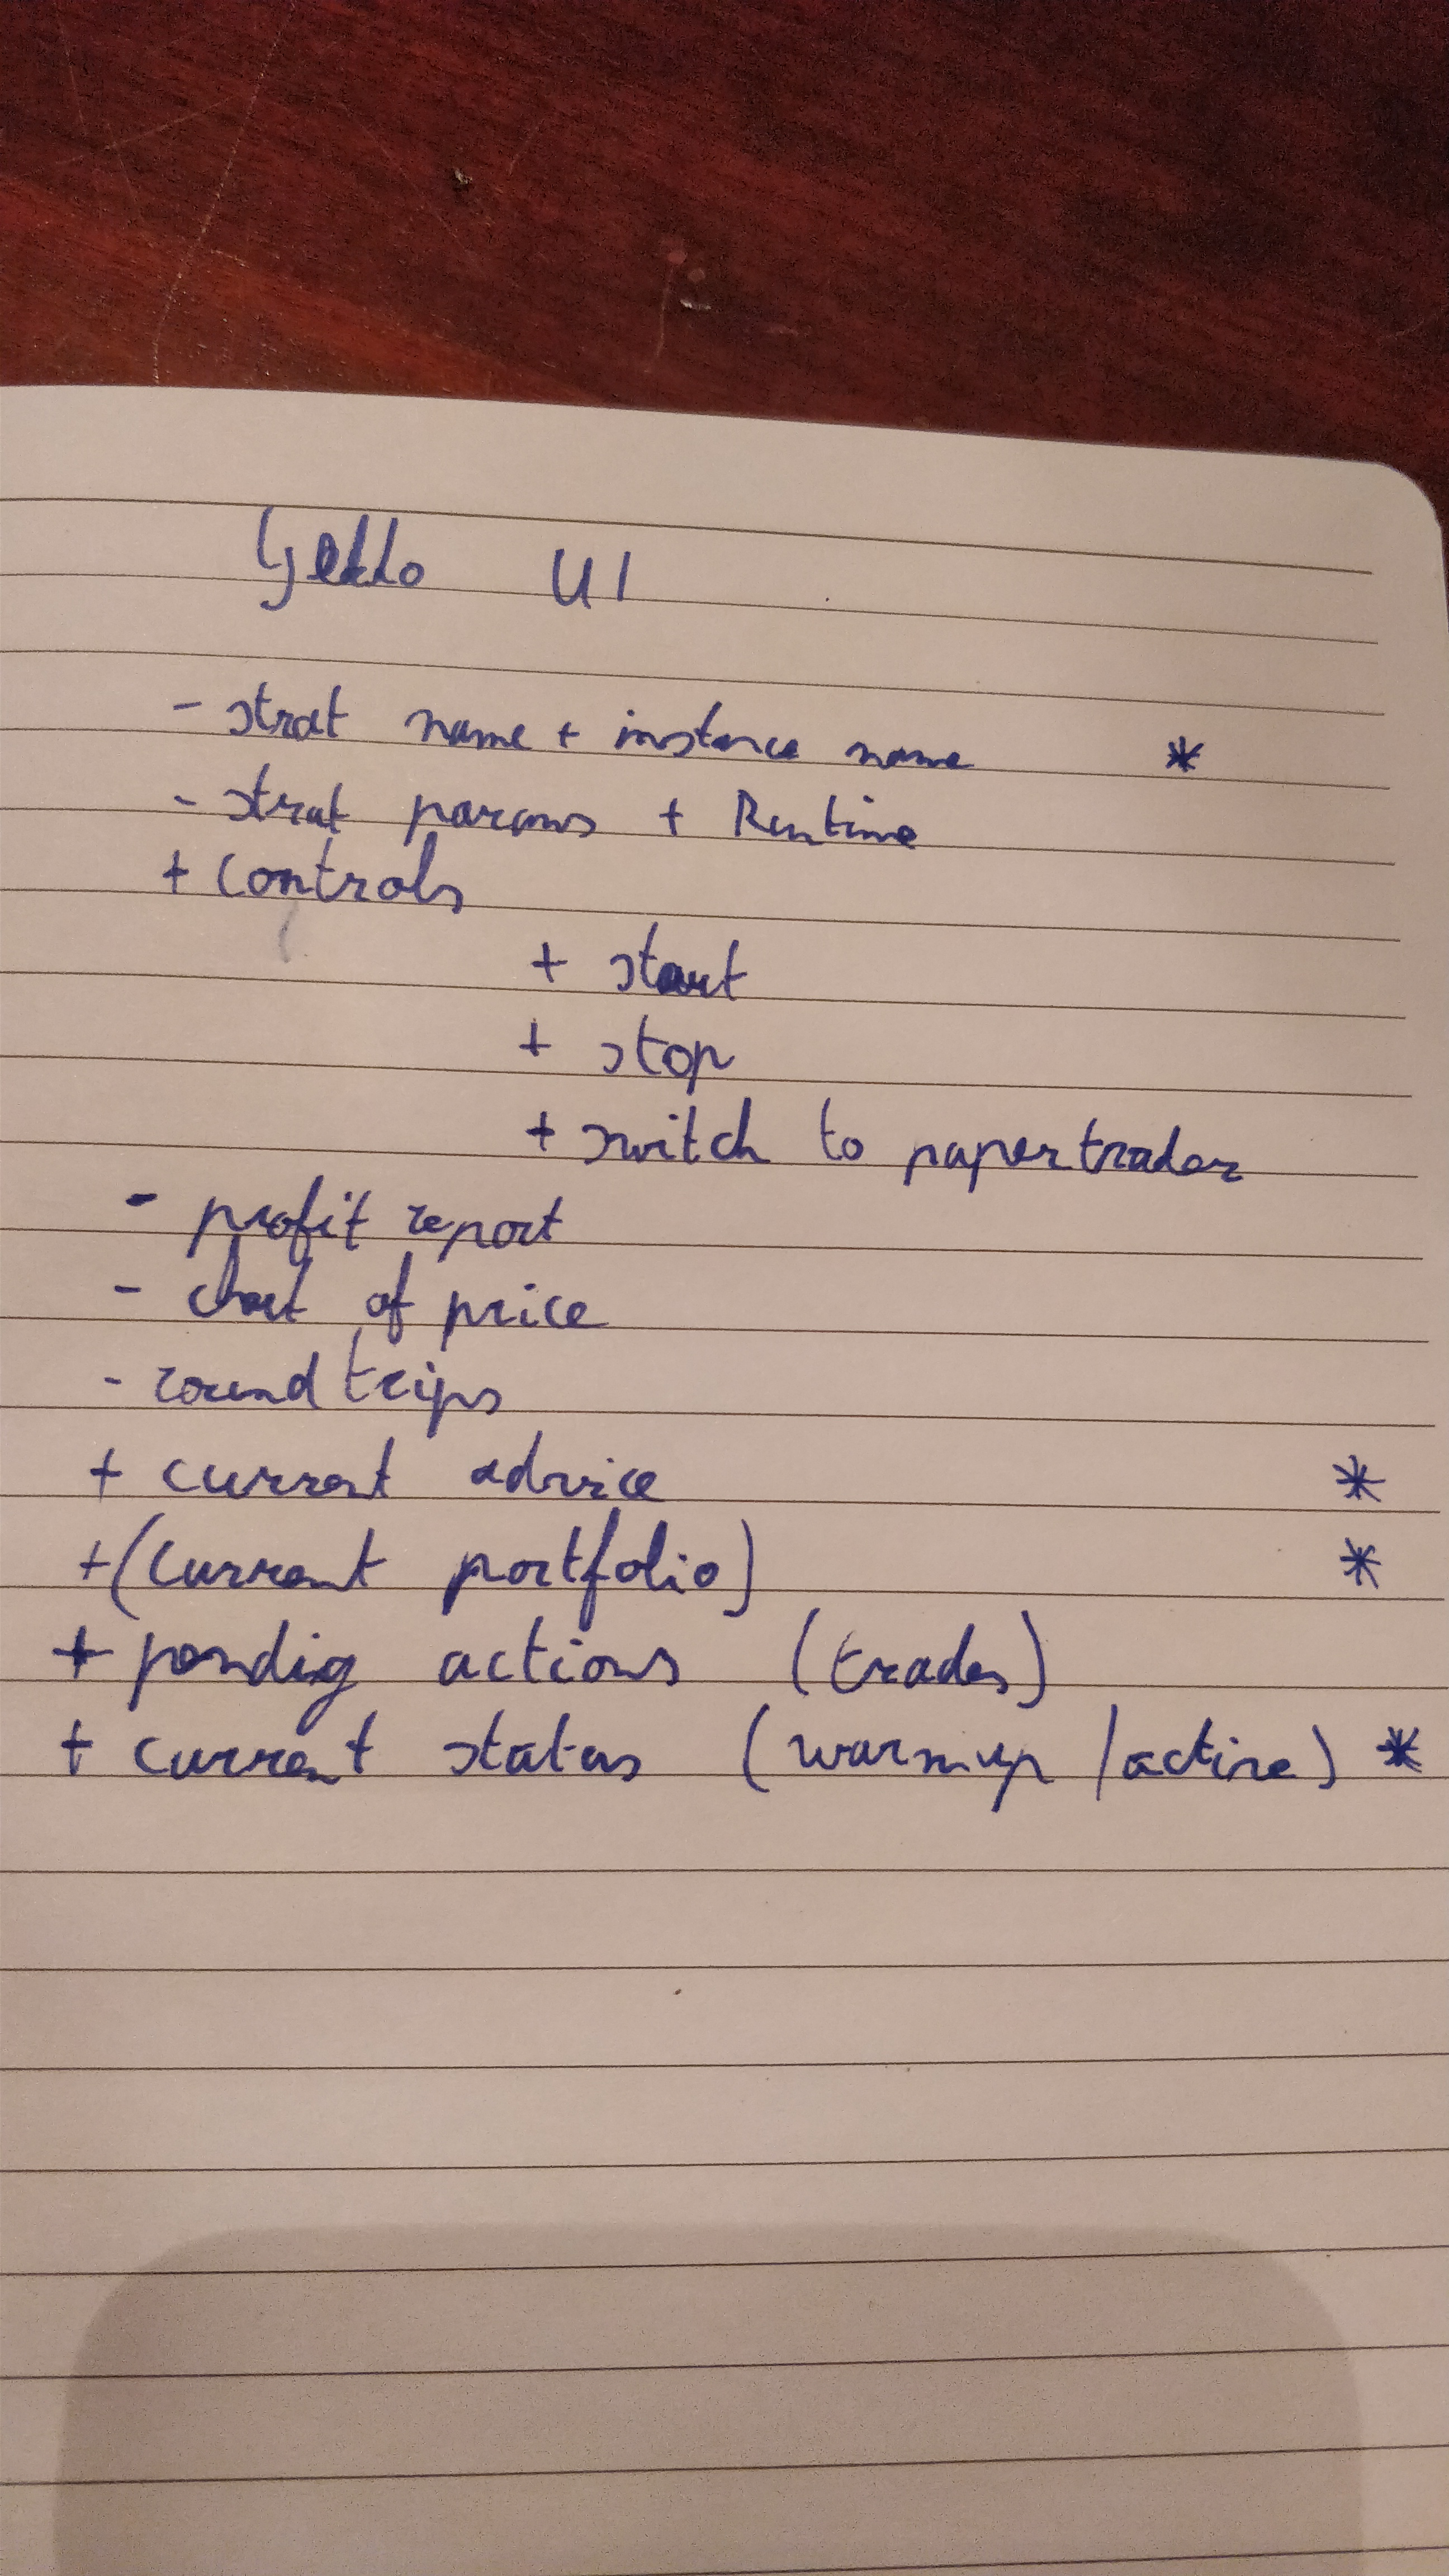
(sample sketch of how that might look)

 askmike
on 23 Jan 2018
askmike
on 23 Jan 2018
Yeah that makes a lot of sense. The start-stop feature is pretty crucial too indeed!
try getting a free license of Balsamiq to sketch some wireframes out perhaps? ( https://balsamiq.com/free/ )
rcoenen
on 23 Jan 2018
Haha yea the paper sketching wasn't meant for sharing directly. Even though the UI is pretty straightfoward, this requires an overhaul of the API logic. I'll work on this over the next few weeks, so don't expect this soon.
askmike
on 23 Jan 2018
@askmike i like the redesign. Related: it would also be cool to have a 'update' button on the import page/local data after each data-set where you can specify what date range to add to your local data. After clicking this button and filling in the parameters it will re-import for you. Maybe add 'market' as a column there?
Partially it relates to my pull request; https://github.com/askmike/gekko/pull/1726
Is it also going to be possible to 'graph' the indicators in the charts? e.g. RSI etc?
 gvdhoven
on 23 Jan 2018
gvdhoven
on 23 Jan 2018
@Webunity that is definitely functionality we want, I'll look at your specific implementation asap (apologies for the delay, I am way behind on Gekko).
@rcoenen thanks for this issue, it's a very valid suggestion. I want to improve this. Because the redesign requires more than just writing some code I've posted a topic in the Gekko forum, might I suggest we use that to discuss a new design for the UI?
Here is the link: https://forum.gekko.wizb.it/thread-65.html
(closing this to move the discussion to the forum)
askmike
on 23 Jan 2018
Related issues
 ChadTaljaardt
·
5Comments
ChadTaljaardt
·
5Comments
 GuyPaddock
·
5Comments
GuyPaddock
·
5Comments
 yacindou
·
3Comments
yacindou
·
3Comments
 godfrey68
·
3Comments
godfrey68
·
3Comments
 thegamecat
·
4Comments
thegamecat
·
4Comments
Most helpful comment
Haha yea the paper sketching wasn't meant for sharing directly. Even though the UI is pretty straightfoward, this requires an overhaul of the API logic. I'll work on this over the next few weeks, so don't expect this soon.