Gatsby: Debugging Gatsby TypeScript in v2
What is the correct way to debug a __v2__ Gatsby project made in TypeScript?
I've managed to get the debugger running, thanks to debugging-the-build-process guide.
But it only worked for .js files, like gatsby-node.js, both in Chrome and VSCode.
Are there additional steps for TypeScript, or is it even possible?
 azdanov
All 23 comments
It should just work, though you need to enable sourceMaps in your tsconfig.json otherwise it will just debug the transpiled js.
 ascorbic
on 21 Jul 2018
ascorbic
on 21 Jul 2018
I have sourceMaps enabled.
tsconfig.json
{
"compilerOptions": {
"allowJs": true,
"allowSyntheticDefaultImports": true,
"jsx": "preserve",
"lib": ["dom", "es2015", "es2017"],
"module": "commonjs",
"noEmit": true,
"noUnusedLocals": true,
"noUnusedParameters": true,
"outDir": "./dist/",
"preserveConstEnums": true,
"removeComments": false,
"sourceMap": true,
"strict": true,
"target": "esnext",
"typeRoots": ["src/types", "node_modules/@types"]
},
"include": ["./src/**/*"]
}
What happens when you try to debug TypeScript then?
ascorbic
on 21 Jul 2018
azdanov
on 21 Jul 2018
Does it work in the browser?
ascorbic
on 21 Jul 2018
Same. Only reacts to .js.
azdanov
on 21 Jul 2018
In the browser dev tools, can you see the ts files?
ascorbic
on 21 Jul 2018
I can. And do set breakpoints there. Skips through .ts files.
azdanov
on 21 Jul 2018
If you put a console.log in the TypeScript file, what filename does it show in the console, and if you click through, what file does it show? Does putting a debugger; statement work?
ascorbic
on 21 Jul 2018
console.log shows original .tsx file.
debugger does work! But the code is transpiled. And it works even with gatsby develop.
azdanov
on 21 Jul 2018
This situation usually means the source map is being messed up somehow, either by TypeScript, Babel or Webpack. I can't see anything immediately wrong with your project, but you could try enabling inlineSourceMaps in the tsconfig.
ascorbic
on 23 Jul 2018
Sadly setting inlineSourceMap to _true_ doesn't work.
Really appreciate your help in trying to resolve this issue.
azdanov
on 23 Jul 2018
Right now I'm not sure if there's easy way to do this - we use webpack to create bundle that is used when rendering to html files, so this step probably messes up breakpoints - because we don't use source files directly. That debugging guide was mainly to debug gatsby-node code (either in your site or in plugins) and gatsby core code, but if we could figure out how to debug html rendering with it - it would be 💯
 pieh
on 23 Jul 2018
pieh
on 23 Jul 2018
I think for now we should clarify this information in guide and mention the debugger; trick.
pieh
on 23 Jul 2018
It works in my project though, so it is possible.
ascorbic
on 23 Jul 2018
@ascorbic Could you post a link? I'd like to compare the configuration files.
azdanov
on 23 Jul 2018
Sure: https://github.com/aerian-studios/aerian-site-rebuild/
You can see it live too. Go to https://beta.aerian.com/ and open up your dev tools. Find src/components/ShowcaseCarousel.tsx and set a breakpoint in the handleChange method. Then scroll the window.
ascorbic
on 23 Jul 2018
Oh, I've just noticed something. I've been working in Firefox, which works fine. I just tried beta.aerian.com in Chrome and it didn't hit the breakpoint. Have you tried your site in Firefox?
ascorbic
on 23 Jul 2018
I've managed to get some results with production build on __Firefox__, but for some reason with all variables _undefined_. Same with __Chrome__. At least debugger was stopping on the breakpoints.
Could it be that development strips down the necessary sourcemaps?
@ascorbic It does work on Chrome. I couldn't make it work on Firefox, it kept stopping at compiled code.
__Edit:__
It appears some variables are defined, others are not.
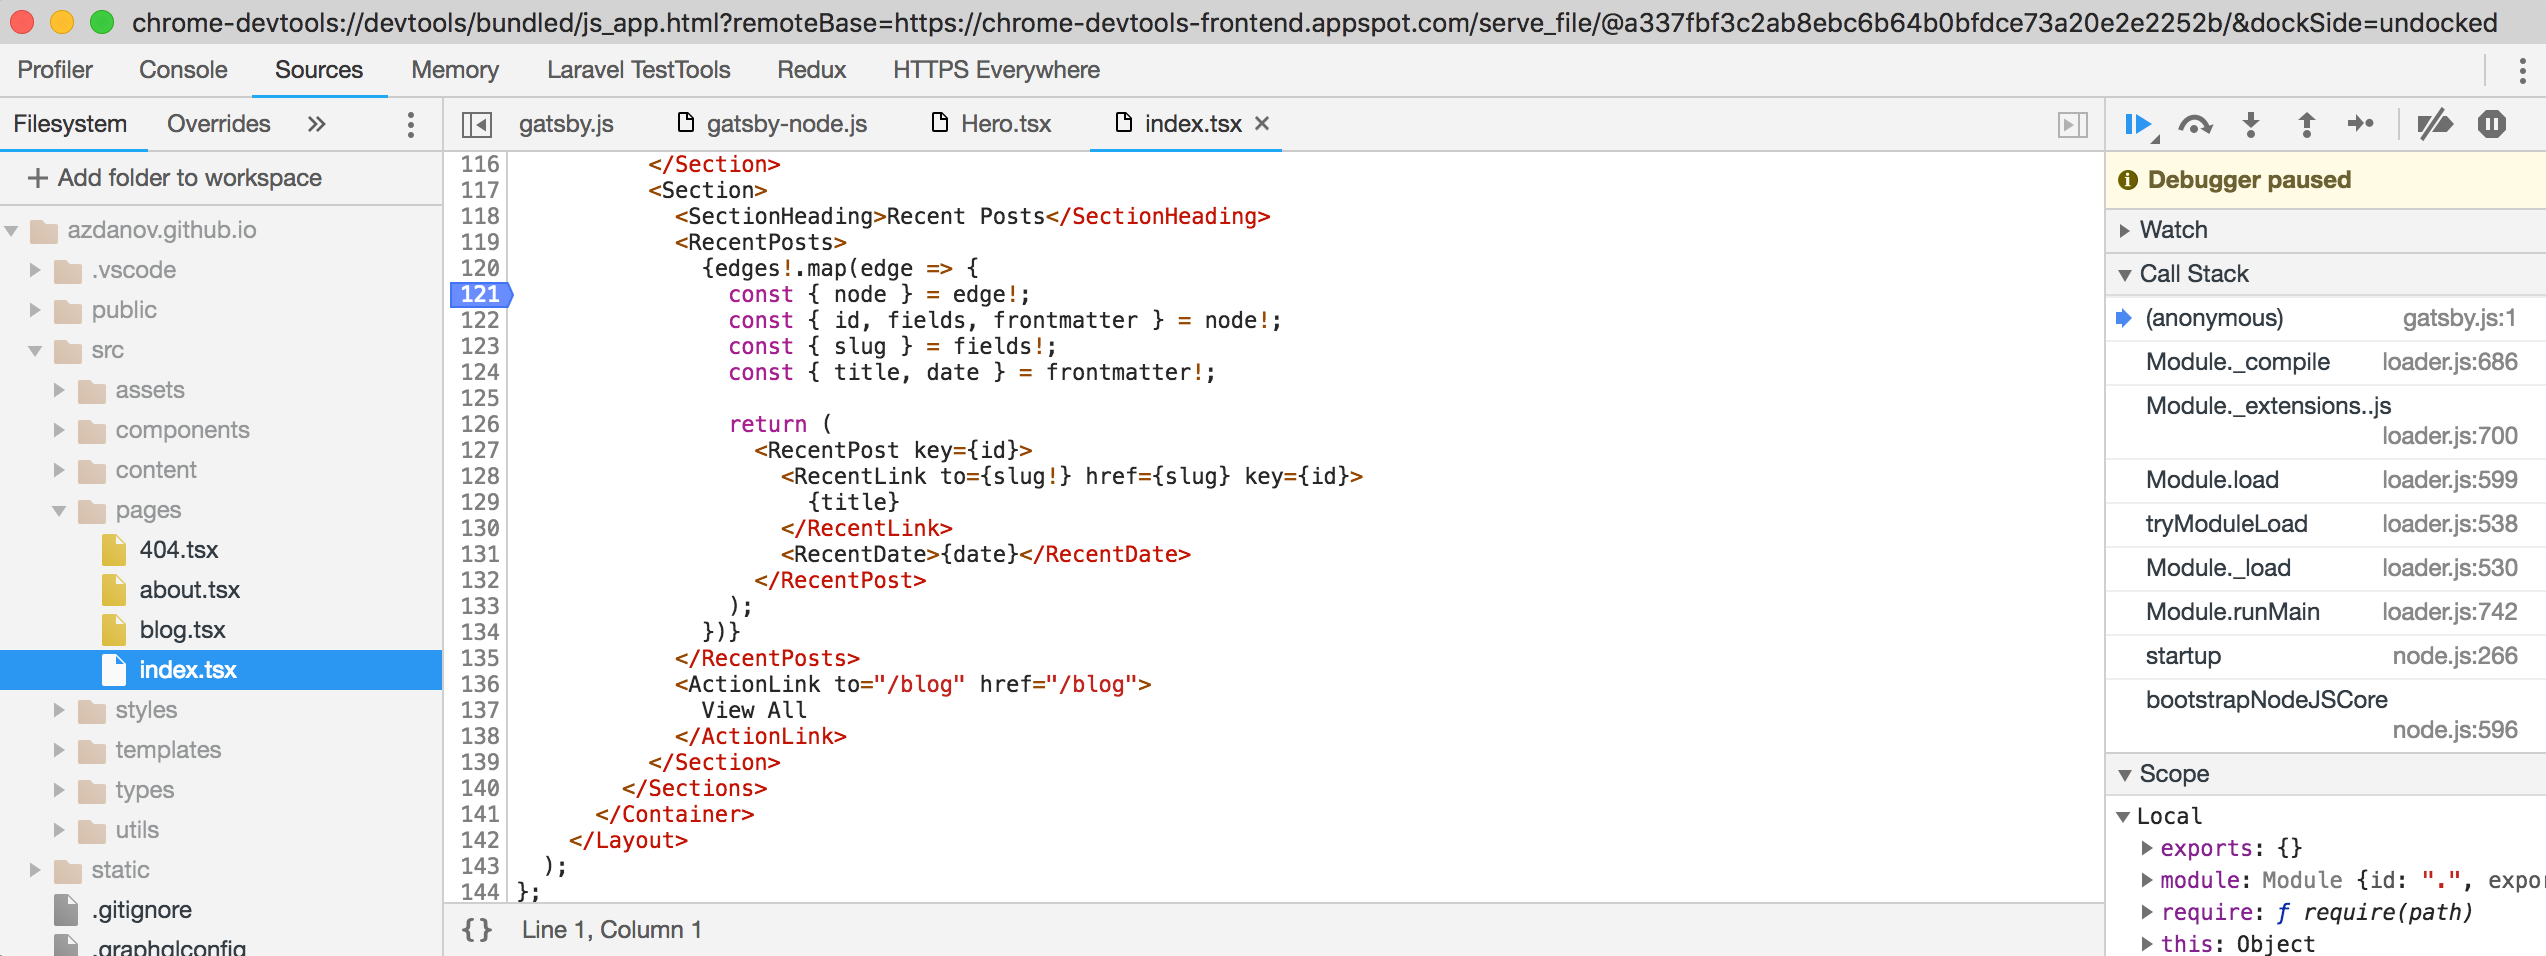
For example here: https://azdanov.js.org/
If on Chrome you open Sources, webpack:// -> . -> src -> components -> Hero.tsx.
Set a breakpoint on line 13, it will show correct size from calculation by typography.rhythm().
But setting a breakpoint on line 135 shows that selection is undefined.
azdanov
on 23 Jul 2018
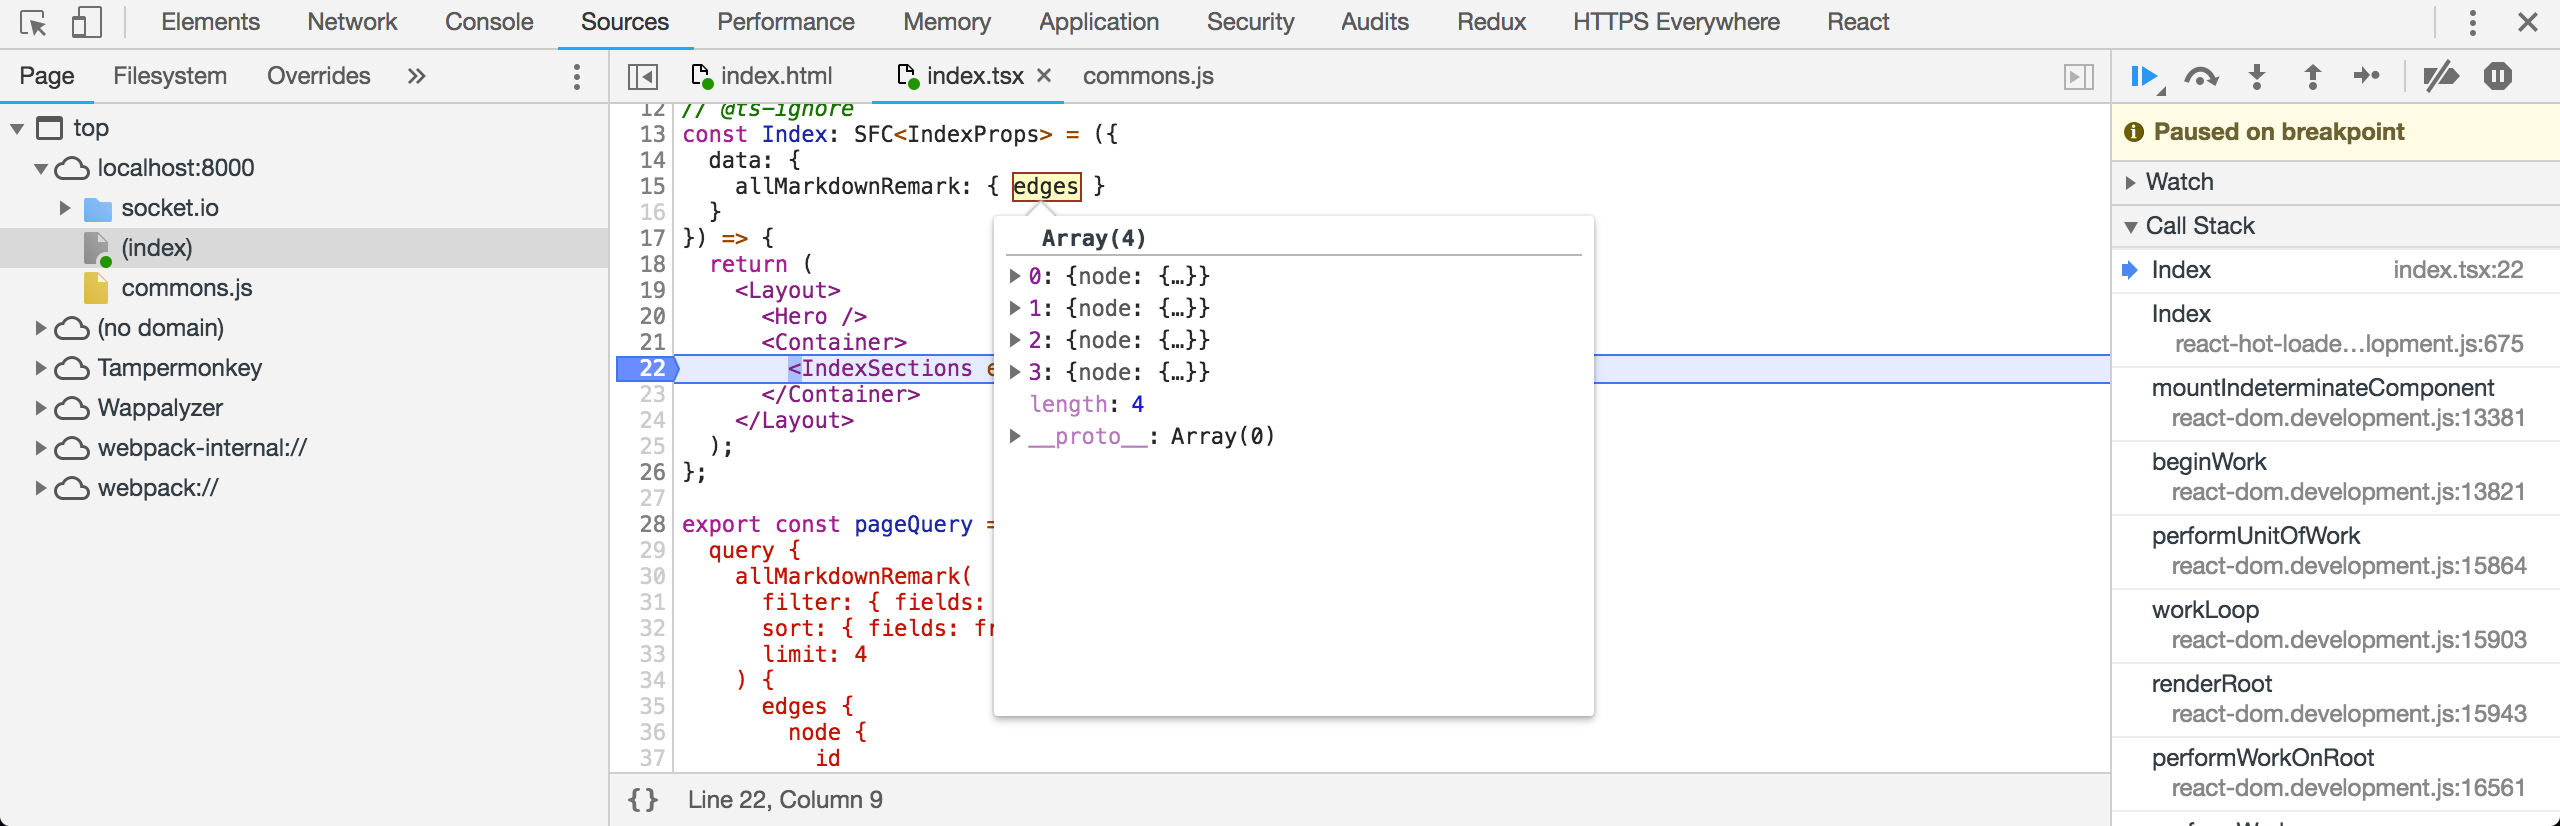
I've found a way to debug components with TypeScript in a web browser.
Add to gatsby-node.js
exports.onCreateWebpackConfig = ({ actions }) => {
actions.setWebpackConfig({
devtool: "eval-source-map"
});
};
As mentioned in other thread:
https://github.com/gatsbyjs/gatsby/issues/6877#issuecomment-410581050
This will add webpack-internal:// with src/ files where breakpoints work.
azdanov
on 8 Aug 2018
By using source-map-loader webpack plugin I've managed to sync sourcemaps, before there were similar issues as here.
@m-allanson Should it be included by default in gatsby-plugin-typescript?
module.exports.onCreateWebpackConfig = ({ actions }) => {
  actions.setWebpackConfig({
    devtool: "source-map",
    module: {
      rules: [
        {
          test: /\.js$/,
          use: ["source-map-loader"],
          enforce: "pre"
        }
      ]
    }
  });
};
Need to figure out how to make it work for incline-source-map.
azdanov
on 17 Aug 2018
Old issues will be closed after 30 days of inactivity. This issue has been quiet for 20 days and is being marked as stale. Reply here or add the label "not stale" to keep this issue open!
![gatsbot[bot] picture](https://avatars2.githubusercontent.com/in/12849?v=4&s=40) gatsbot[bot]
on 23 Dec 2018
gatsbot[bot]
on 23 Dec 2018
This issue is being closed due to inactivity. Is this a mistake? Please re-open this issue or create a new issue.
gatsbot[bot]
on 3 Jan 2019
Related issues
 magicly
·
3Comments
magicly
·
3Comments
 KyleAMathews
·
3Comments
KyleAMathews
·
3Comments
 timbrandin
·
3Comments
timbrandin
·
3Comments
 dustinhorton
·
3Comments
dustinhorton
·
3Comments
 kalinchernev
·
3Comments
kalinchernev
·
3Comments
Most helpful comment
By using
source-map-loaderwebpack plugin I've managed to sync sourcemaps, before there were similar issues as here.@m-allanson Should it be included by default in
gatsby-plugin-typescript?Need to figure out how to make it work for
incline-source-map.