Gardener: Seed Grafana failed to load Extensions dashboard
How to categorize this issue?
/area monitoring
/kind bug
/priority normal
What happened:
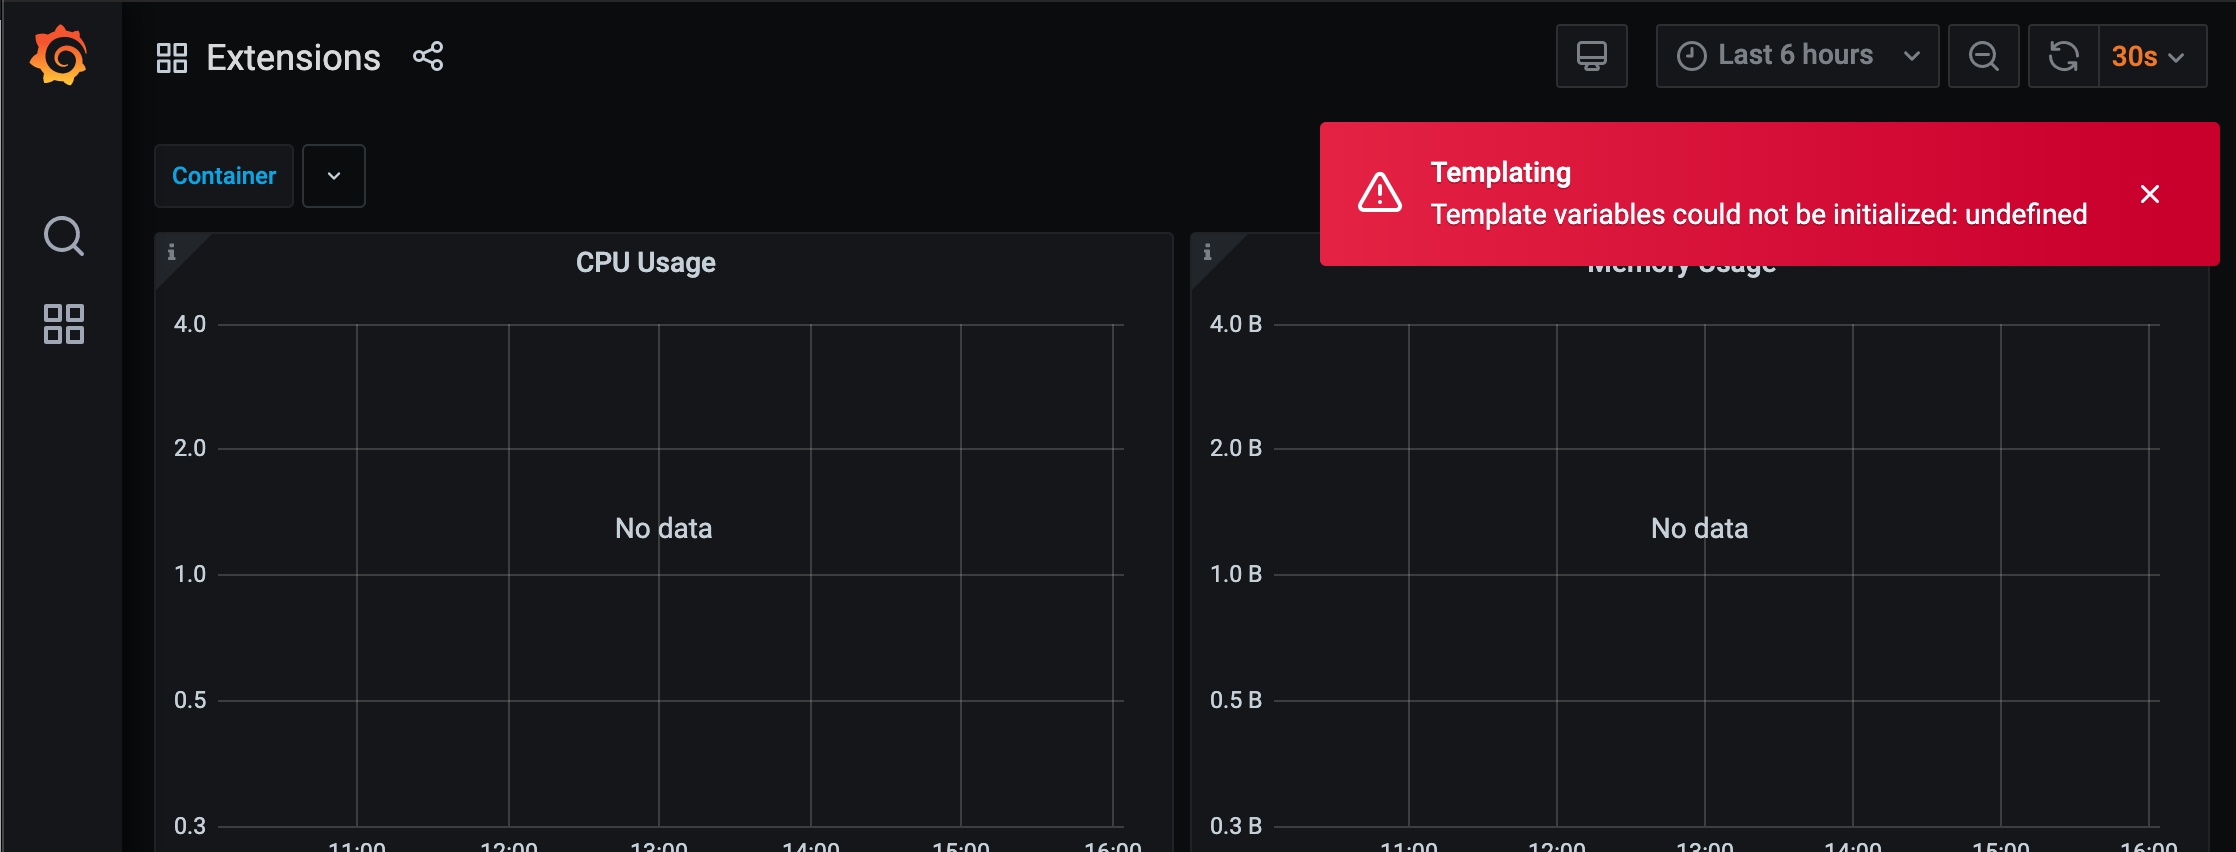
Seed Grafana failed to load "Extensions" dashboard (see screenshot). I was able to reproduce it on multiple seed clusters. It worked occasionally when I reloaded the page several times.
How to reproduce it (as minimally and precisely as possible):
- Open Seed Grafana via
grafanaIngress ingardennamespace. - Click on
Extensionsdashboard.
/cc @wyb1
Environment:
- Gardener version: v1.12.3
 timuthy
All 4 comments
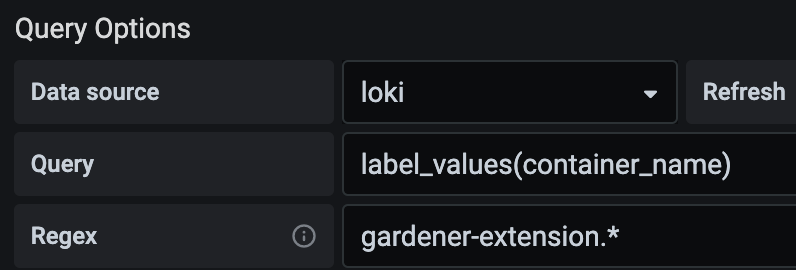
Seems to be related to the datasource. Whenever the datasource is loki, the CPU and Memory usage panels are broken.
Whenever the datasource is changed to prometheus and the label is adjusted then the CPU and memory panels work but the logs from loki no longer exist.
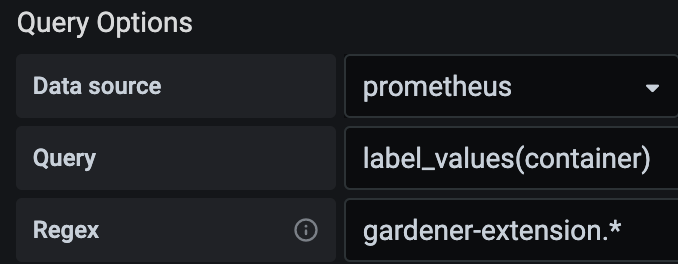
@Kristian-ZH any suggestions on how to get loki working with the Prometheus labels?
 wyb1
on 6 Nov 2020
wyb1
on 6 Nov 2020
ping @Kristian-ZH @vlvasilev
 rfranzke
on 11 Jan 2021
rfranzke
on 11 Jan 2021
Hmm i checked and can not see any issues at the moment. We had an issue before, where the Loki was constantly scaled-up/down because of the misconfigured hvpa. This issue was fixed and currently the dashboards are looking fine.
Can you please recheck if everything is working as expected @timuthy @wyb1 ?
 Kristian-ZH
on 11 Jan 2021
Kristian-ZH
on 11 Jan 2021
I don't experience the issue at the moment, either. Thanks for checking @Kristian-ZH.
/close
timuthy
on 12 Jan 2021
Related issues
 ialidzhikov
·
4Comments
ialidzhikov
·
4Comments
 stoyanr
·
4Comments
rfranzke
·
3Comments
rfranzke
·
3Comments
timuthy
·
3Comments
stoyanr
·
4Comments
rfranzke
·
3Comments
rfranzke
·
3Comments
timuthy
·
3Comments