Galaxy: optimize the main page loading process
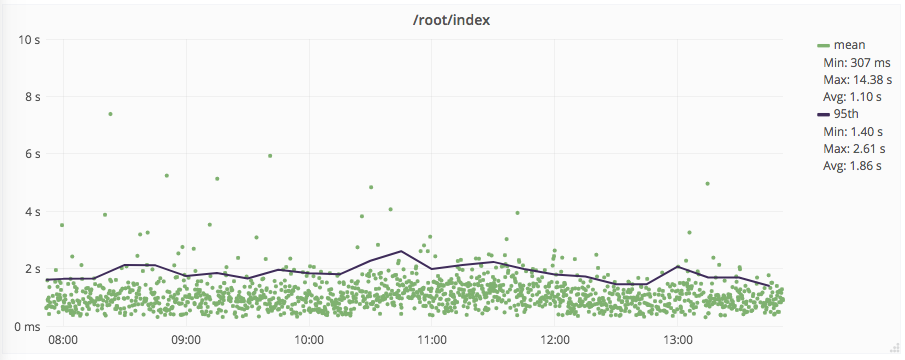
Currently on Main every load of the root analysis page is delayed by ~2s because that is how long it takes us to deliver root/index to even start fetching other things.
I suspect that at least a part of this is that we fetch the whole tool panel as part of the json app dump which results in 42k lines / 2mil characters of 'configuration' in that html.
We should probably deliver the first html with basic configuration ASAP and let other things load in an async manner.
 martenson
All 7 comments
We also seem to be including the toolpanel config literally twice https://github.com/galaxyproject/galaxy/blob/dev/lib/galaxy/webapps/galaxy/controllers/root.py#L58
martenson
on 19 Feb 2018
We dicsussed improvements for this a few months back, but much of it depended on the refactoring and architecture improvements going on. I can't find an issue for it, though. @guerler, do you remember this?
It's definitely the plan, though, to strip the initial client shipment to the bare minimum and progressively load details like the toolbox, etc.
 dannon
on 19 Feb 2018
dannon
on 19 Feb 2018
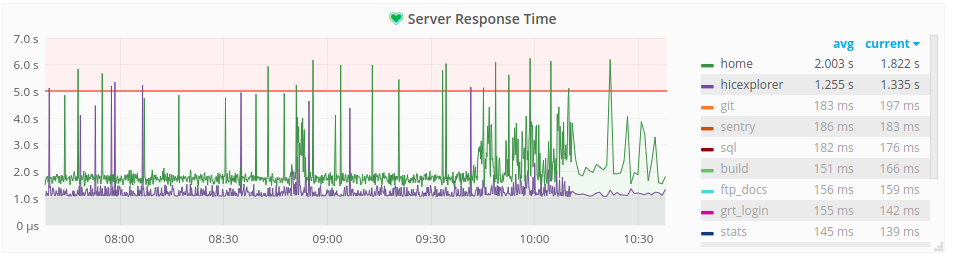
We recently started running a subdomain with a limited toolbox, the full toolbox adds somewhere between .75 and 3 seconds to the load time (but it's pretty variable.) Here's the graph.
 hexylena
on 20 Feb 2018
hexylena
on 20 Feb 2018
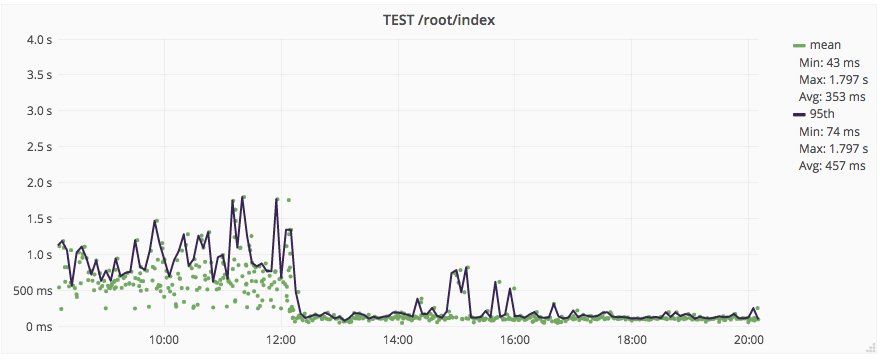
with #5570 in place
martenson
on 21 Feb 2018
This is fantastic @martenson. Particularly considering the large number of tools and many page reloads we still have on main. Never experienced the left tool panel box as critical in local tests (which is not surprising). Shows that its even more important that we quickly create a large test sqllite db for local tests.
 guerler
on 21 Feb 2018
guerler
on 21 Feb 2018
<3 can't wait til this supports our filters.
hexylena
on 21 Feb 2018
I think we improved this a lot with https://github.com/galaxyproject/galaxy/pull/5616 and related PRs
martenson
on 7 Mar 2018
Related issues
 blankenberg
·
4Comments
blankenberg
·
4Comments
 tnabtaf
·
4Comments
tnabtaf
·
4Comments
 MoHeydarian
·
4Comments
MoHeydarian
·
4Comments
 natefoo
·
4Comments
natefoo
·
4Comments
 scholtalbers
·
5Comments
scholtalbers
·
5Comments
Most helpful comment
with #5570 in place