Fsharp: SRTP with large overload sets and errors leads to very high compilation load
EDIT (22 May): A repro that exhibits the likely cause of this bug (albeit not exactly the described sluggish behavior), was finally found by me after a week or so and 70+ helpful comments and traces. Instead of reading all, new visitors should probably just go to https://github.com/dotnet/fsharp/issues/9201#issuecomment-632894904. Please try the repro, I'm very curious whether it's reproducible.
A project that takes roughly 1 min to compile, after loading it in VS 2019, I first compiled it and then decided to measure how long it took for coloring, tooltips etc appear:
- After about 5 minutes, coloring appears
- About 10 or so minutes, the first type-tooltip appears
- About 20 or so minutes, the first error (I had only the file open that would show the first error shown in the build output window)
- Moving from one identifier to another, it takes between 30s and 2 minutes before a type popup appears
- Similarly, the "Error list" window very slowly builds up with errors long known from compiling (just now, 42 minutes after opening, it shows 8 of 10 errors it should show).
GIF animation of first 30-something minutes, click to start from the beginning, and grab some crisps and 3 beers before you start ;).

Repro steps
Reproducible with my project and possibly with other large projects, I'd be interested if others have seen similar behavior.
At 34 minutes, it showed 22 tasks in background queue
At 53 minutes, it showed 19 tasks in background queue
At 56 minutes, it showed 0 tasks (finished) and mouseovers were responsive again (until I edit anything, one letter took another 5+ minutes with 6 tasks in queue ...).
Expected behavior
While I can understand that building up the IDE can take a bit longer than a simple rebuild-all, I don't expect it to take the same time I'd normally tend to fall asleep in a Vin Diesel movie. Making the screen-capture was just about similarly entertaining ;).
Actual behavior
As described above. Slooooow. For fair comparison, I opened only one VS IDE, and disabled most, but not all, 3rd party extensions.
In the Task Manager I can see devenv.exe at 4% CPU, which is effectively one CPU core on my machine. Memory for devenv.exe in those 40+ minutes went from 1.4GB to 1.6GB. Traditionally, I only notice extreme sluggishness after it reaches 2.8GB or higher.
Known workarounds
Strangely, I don't _always_ see this behavior, though it has been like this for a few weeks now. I'm now going to restart, remove any auxiliary files, clean everything and start afresh, see if it still happens. As it is now, it is absolutely unworkable.
Related information
I'd be very interested in getting to the bottom of this, if you need any traces (I assume you do) or anything else, I'm more than willing to provide those.
- VS 2019 non-preview, most recent.
 abelbraaksma
All 84 comments
Few hours later, I have submitted a trace (took long, because, well, typing one character takes 20 minutes at least...). I made the trace after: restart computer, removed *.user files, clean solution. I then waited for all background processes to stop (over 30 minutes this time around) and started the trace.
The trace collected data for another 35 minutes or so (the time it took to type one character and wait for the again-started background processes to stop and VS to become responsive again). I added comments in the trace for actions I did.
The trace is attached to https://developercommunity.visualstudio.com/content/problem/1034777/typing-in-an-f-solution-takes-minutes-to-get-type.html and most likely only viewable to MS employees (@KevinRansom, @dsyme, @cartermp, I assume you are able to access this?).
All fun and pun aside, as it is now I cannot develop anything seriously anymore... :S (though, gotta admit, if you type one char per 30 minutes, your code quality greatly improves! As does my coffee addiction).
My next steps: disabling everything in VS that could hog the CPU, installing latest previews to see if that improves things etc etc (I severely hope it is some extension I overlooked). Somehow I need to be able to get back to work ;).
abelbraaksma
on 15 May 2020
@abelbraaksma I'm looking at the trace, and it's ... weird. I'm not sure if I can say anything at his point, but in the trace, literally _nothing_ is showing as being allocated until 24 minutes into the trace. After that, there's data about allocations. When looking at CPU stacks, it's not until 29 minutes into the trace that anything is registered.
This is pending some more investigation, but the CPU and memory usage items actually look fairly normal if I slice the sample to a period where there's actually data. Though it would be indicate of the compiler simply having to process _a lot_ of F# code, since top allocations are from strings and tuples used deep in the guts of the compiler. CPU stacks show a similar story.
What's most telling about something being _off_ here is that 1.4GB is nowhere near enough memory usage for devenv.exe to go haywire due to exceeding memory limitations, and 4% CPU is also not a whole lot of work going on. It's almost as if there's some enormous Thread.Sleep() getting called somewhere.
 cartermp
on 16 May 2020
cartermp
on 16 May 2020
Ok, bunch of tests further and a bit wiser (and a bit more confused). I did the following things:
- Really turned off all extensions, incl. the ones that shouldn't interfere. Restarted, and instead of 20-40 min background time, it went down to 2-5 minutes (still way too long, but a clear improvement).
- Turned back on all extensions: the times stayed at 2-5 minutes (background tasks time after each edit) and ~20s for tooltips to appear. This was the confusing bit, apparently disabling and re-enabling all extensions (of one in particular, I don't know which) has cleared some kind of cache or setting that was persistent through restarts, Clean Build etc.
- Turned of all F# options that could have some influence on performance, including scrollbar-as-map, guidelines etc. This had a huge impact, after restarting VS, same code showed tooltips in 2-4s first time, and henceforth immediate. Red squigglies in 7 sec after restart. Coloring and tooltips in opening other files was almost instantenous. At least this showed that the issue wasn't with my own code or edits per se.
- Turned options on one by one. This showed that the following option (_Enable in-memory cross-project references_) was causing all problems:

I repeated this a few times to be sure. I know that in the past this setting was set to 200 and enabled and that it caused a lot of performance problems. Several issues on github were reported on it and @cartermp (iirc) showed me back then to lower the number to 3 or 4. It has since been 3 and until recently this didn't give me real problems.
I thought that if I disabled this option, that tooltips wouldn't work on types that are not defined in the current project, but in a project-to-project reference (at least that is how I remembered it: disabling completely was a bad idea in the past). But I seem to have been wrong, or behavior has changed. I couldn't (yet) find any behavior difference with caching on or off, except for extreme (200-500x) performance degradation. And let's be fair, "caching" suggests speed-up, not speed-down.
If you read my reports thus far, I'll summarize the remaining questions:
- The extreme performance degradation mentioned in the original report (and with the trace), what could cause this and how can we prevent it? One additional observation: the solution had an added project which lies in-between in the references-chain. If anything, that's the only "big" change from recent weeks, perhaps this confused this feature?
- How is this feature supposed to work and shouldn't it improve performance (until memory gets in the way, but here we saw memory between 1.2Gb and 1.6Gb, nothing extreme)? And if its only effect is to downgrade performance 400x, what feature does it enable or improve that warrants such perf timings?
- Conversely: what will stop working if this feature is disabled? (so far it's the opposite, I have my supercool F# experience back and it's faster than ever!!!!)
Until it happens again, I won't be able to get the 40-minutes start-up performance and 20-minutes per-edit performance back, as my actions seem to have changed it, hopefully forever. Hopefully the report, however, can help analyze what happened here and prevent it from happening to others.
abelbraaksma
on 16 May 2020
and 4% CPU is also not a whole lot of work going on
@cartermp, thanks for looking at this! You may read/interpret this wrong (if you got it from the trace), because I could see clearly in Process Explorer that a single thread was running 100% on a single CPU Core. Since I have 24 cores over 2 physical CPUs, that comes down to 4% (since part are virtual cores, sometimes it is reported as 8%).
Bottom line: of the list of threads, there was one that was doing all the work, the rest was sitting idly by (I would assume the busy thread was not a background thread, because these should be independent of the rest, but I couldn't verify, they were all _CorExeMain).
I'm looking at the trace, and it's ... weird. I'm not sure if I can say anything at his point, but in the trace, literally nothing is showing as being allocated until 24 minutes into the trace.
Somehow this doesn't surprise me, as I was also looking live at the CLR traces (again: Process Explorer) and the allocations were very, very low for such a big application and all that CPU.
My gut told me there's a wait-loop somewhere and the thing it is waiting on gets released, but only very slowly. And this happens often. This could mean a (semi-) race-condition, a file on disk that is shared and not released properly, a memory mapped file, mutex etc etc.
Though I don't think it is caused by something in memory (well, not from the start). The behavior survived restarts of the computer, updates of Windows and basically over a week of doing all sorts of stuff. Only until I disabled (not removed) all extensions, the behavior changed (to 2-4 minutes). This behavior is reproducible with my current code and settings. The previous behavior isn't.
I've read online that there were some issues with Live Share. I am not using it, not even logged in, but the extension was enabled. Could the extreme delay been caused by waiting on network services or even a log-in that never happened and has to time out several times?
abelbraaksma
on 16 May 2020
@abelbraaksma , can you share some details of the project/solution that you have loaded. Does it have a lot of projects or is it a single project? Is it netsdk or dotnet framework project? Is it on github somewhere that we can load?
Thanks
Kevin
 KevinRansom
on 16 May 2020
KevinRansom
on 16 May 2020
@KevinRansom, I can certainly share the project in confidence, or we can set up a remote call with shared screens if that helps (it is mostly closed source, but they won't be too fuzzy sharing it under conditions). The solution I tested this with and used for the trace has 11 projects. Since I had issues with performance in F# long before as well, I have split the "big solution" into a bunch of smaller ones, depending on what part I am working on. I rarely work on my all.sln, because it's too slow, generally anyway.
The main solution has 34 projects (not all of which are very significant).
I've estimated the LOC at some 150k lines, but depending on how you count you may find a different number.
All projects are (unf.) still legacy projects. There was something in the new project format that blocked me from changing (we tried), atm. I can't remember what that was. However, there aren't any really fancy things going on: each project is .NET Framework 4.6.1 (we build libraries and cannot update to latest all the time), each compiles to a library, three compile to an EXE. There is a handful of C# projects, but these are comparatively small.
There are two "heavy" projects: lots of source lines, quite a bit of SRTP-style inline (but again, nothing out of the ordinary, I think) and compiled binary size of all builds up to ~13MB Release Build (only counting DLLs, not counting test projects). Those 2 "heavy" projects are 5.5MB and 2.7MB resp. after compilation.
A clean build takes around 2-3 min (dep. on whether or not tests are included) on my system.
I think this all counts as "big" but not "huge" or "extreme". Another C# project I manage has 110 projects in the main solution, with 10 min clean build time.
abelbraaksma
on 16 May 2020
Well looky here:

26% of CPU time in the sample is spent checking if a file exists. Ooof.
I'm still not quite confidence in the trace data I'm looking at since there's such a massive gap of time before there's anything going on here. However, the data I'm looking at doesn't look abormal. So I'm not terribly surprised with what I'm seeing, especially if your codebase makes use of a lot of assembly references @abelbraaksma
cartermp
on 16 May 2020
Does it use typeproviders? And I would really appreciate if you could remember what blocked the conversion, because we are no longer shipping legacy project format templates. They will still load and edit, but we don't really want new projects created using that format if we can avoid it.
KevinRansom
on 16 May 2020
but we don't really want new projects created using that format if we can avoid it.
I know. But this project has been in development for > 7 years, and has some MSBuild dependencies baked in. I'm sure it can all be converted eventually and we really should. But we spent a few days trying and gave up. It is not a trivial conversion (and so much even MS admits on the pages dedicated to moving over to the new format).
But there's a big upside with conversion that we certainly recognize: multi-targeting. Currently, that's a mess and we really want to target .NET Framework and .NET Core (reason: customers ask for it), which currently isn't easy to do.
Does it use typeproviders?
Nope, none. There are some quotations though (test prj with UnQuote).
abelbraaksma
on 16 May 2020
So ... perfectly straightforward medium sized solution ide goes super slow .... eek. Did you ever see this type of behaviour with our oss VisualFSharp solution ?
KevinRansom
on 16 May 2020
@abelbraaksma Regarding in-memory cross-project references: when the number of projects held in the cache is only 3 (which is small) and there are a lot of project references, this can actually lead to more memory and CPU consumption over time since the IDE is constantly recomputing things u necessarily. I'd be curious about your experience if you turned it back on and then set the value to something high like 200.
cartermp
on 16 May 2020
26% of CPU time in the sample is spent checking if a file exists. Ooof.
@cartermp If so much time is spent there, and there's probably IO involved which doesn't show in the CPU trace, that can surmount together as "was virtually doing nothing" for a long time, right?
This suggests that it was looking for a file that wasn't there, was corrupted or otherwise time-consuming to retrieve. Since the whole performance changed dramatically after I changed the extensions (disable, re-enable), I doubt it is the extensions themselves that cause the strange performance, but what if (thinking out of the box) the MS extensions share a file with (binary) settings that in turn cause this file-checking to go so slow?
Btw, the full ist of assemblies include a bunch of System.XXX, FParsec, Netwonsoft, NodaTime, FSharp.Core. The majority being System, which is a lot of files, but only 3.3MB.
abelbraaksma
on 16 May 2020
PS: since we're all online debating this, would it perhaps be more efficient to set up a call?
However, the data I'm looking at doesn't look abormal. So I'm not terribly surprised with what I'm seeing, especially if your codebase makes use of a lot of assembly references
@cartermp I don't understand this, because:
- Editor used to show near-direct responsiveness when typing (this was different in 2015, but your efforts have really paid off and I am generally very, very happy with the improved performance). Some exceptions could be observed if editing the most-common reference, and then swapping to the least-common (i.e., the final exe). Other than that, performance has been really very good recently.
- The whole project is not absurdly large (I think), and doesn't do any crazy stuff (afaik)
- The total number of references is not that much for the project I profiled. Here's the list, the ones starting with
Exseltare project-to-project references:

- Nothing is anywhere near "normal", I think, when you needed to wait 10-20 minutes after each keystroke... Right? I'm not sure why the trace doesn't show it, do you have the full 35-or-so minutes?
Which begs the question, how can it spent so much CPU time in that method if there aren't that many files to load? Or: these files it tries to load have nothing to do with F# or my project? Some inner process going berserk? ;)
abelbraaksma
on 16 May 2020
@abelbraaksma phillip was referring to the trace .. your experience is actually scary.
KevinRansom
on 16 May 2020
ah, got it! :+1:
Yep, it was scary indeed ;). So scary it got funny, and then scary again :P
abelbraaksma
on 16 May 2020
@cartermp, how can I access my own trace? I'm quite good at performance analytics, maybe I spot something.
If you guys wanna call or chat, my Skype handle is the same as my name here, but a dot between first and last name. Or any other app, or actual phone, is also fine.
abelbraaksma
on 16 May 2020
Regarding in-memory cross-project references: when the number of projects held in the cache is only 3 (which is small) and there are a lot of project references, this can actually lead to more memory and CPU consumption over time since the IDE is constantly recomputing things u necessarily
Hmm, but that suggests that I wouldn't be able to see mouse-overs of types, modules, functions from cross-project refs? I verified this, and I can see everything, even if I haven't done a build (if the option is switched off). When on, well, tooltips appear after minutes at start-up or after an edit.
I'd be curious about your experience if you turned it back on and then set the value to something high like 200.
I'll try this
abelbraaksma
on 16 May 2020
So ... perfectly straightforward medium sized solution ide goes super slow .... eek.
@KevinRansom Rectification on LOC. The F# part of the traced solution had ~126,500 non-empty lines in *.fs files. The full solution (not traced) has ~245,000 LOC. There's about 35k LOC in the C# parts.
But still within the bounds of "medium sized" or what I like to call "rather big" solution ;).
Did you ever see this type of behaviour with our oss VisualFSharp solution
Not so extreme, no. Though that solution generally behaves a bit slower than my own in regular code-editing stuff. But since 90% of my time is spent in my own project and I've only occasionally done editing in the OSS VisualFSharp solution, it is not a fair comparison.
I've seen extreme degradation before a few times (though not as extreme as these days). It usually happened when there were a lot of errors, i.e., there's a type I basically use everywhere. Change that type, and the there'll be thousands of errors. Try then to edit something at the far end in the solution, this is dead slow. But that is not typical, and since I split the solution in smaller sub-solutions, such large refactorings are now done in phases.
In this case, there are 10 errors spread over two or three files. But even without the errors, it was dead slow.
abelbraaksma
on 16 May 2020
@abelbraaksma I cleaned, built and loaded the OSS solution in vs, rebuilt. And still I am not seeing classification and tooltips. classification is the phase that shows the cyan TypeNames.
CPU is doing little to no work, Working set is 766,000 K so ... really not stressed.
KevinRansom
on 16 May 2020
@KevinRansom this call is the one where all of the CPU time is being spent checking if a file exists: https://github.com/dotnet/fsharp/blob/master/src/fsharp/CompileOps.fs#L3013
The IsSystemAssembly assembly property is what I suspect the most, but there's no data in the trace indicating that it's this one specifically. However, this is where the actual call to File.Exists ultimately happens.
Is it necessary to have that exists call in there, given that we're already wrapping this in a try..with block?
Let's not discuss the F# OSS solution in this thread. The issues seen here don't surface in our codebase after the numerous times we've profiled this one.
cartermp
on 16 May 2020
@cartermp throwing an exception is hugely more expensive than checking a file exists. So this call would be way more expensive if we relied on the exception. The exception exists for cases where the reason the file is inaccessible has nothing to do with its presence. For example permissions to access the file is not granted.
KevinRansom
on 16 May 2020
Right, but was that ever measured? That is, have we measured how expensive it is to do these things when a file doesn't exist is relative to the time spent checking if it exists (an expensive operation on Windows)?
cartermp
on 16 May 2020
I'd be curious about your experience if you turned it back on and then set the value to something high like 200.
@cartermp: you may be on to something (CPU time, not wall-clock time):
- with the setting set to 200 (and a restart), initial start-up is 1m20s, after that system is responsive, background processing stops. When doing minor editing. Tooltips appear near-immediate. I see the background-tasks icon flicker only for a few seconds
- with the setting back to 3 (and a restart), initial startup is 3m40s, after that mouseovers work and background processing stopped. Doing a minor edit, it takes another 3min before it is normally showing tooltips again. This is reproducible. Background-tasks icon spins for ~3min after each edit.
Note: with the setting disabled, initial startup is 7 sec (after first screen appears), and 2 sec before mouseover work, almost no delay whatsoever between edits. So I'm still not getting the "caching" bit and why the mouseover should wait for the background task to finish if the info is already there (the "stale" setting is enabled).
I think something operates in the wrong order here.
abelbraaksma
on 16 May 2020
@cartermp Can I access my own trace somehow? I'd like to see what you see
The IsSystemAssembly assembly property is what I suspect the most, but there's no data in the trace indicating that it's this one specifically. However, this is where the actual call to File.Exists ultimately happens.
Perhaps it makes sense to create a "clean" trace, because the extreme situation has not re-appeared and I suspect the cause is really in some kind of deadlock that may not readily show in the CPU-bound or memory-bound traces.
A new trace would reveal perhaps _why_, with "caching" enabled, it is still so slow, or, even if we accept that it can be slow, what is causing it and warn users against using such settings-combinations.
abelbraaksma
on 16 May 2020
I'd also be interested in _why_ these background processes appear to mostly act synchronously, as I keep seeing one thread doing all the work.
Also: even when doing nothing (like when typing this), not having focus on VS IDE and background tasks finished, devenv.exe still spins at 100% for a single thread (1 core at 100%, 8% overall).
abelbraaksma
on 16 May 2020
Ok, my last comment may point to what @cartermp was already hinting at: (almost) nothing is happening. Meaning, if, when doing nothing, the CPU slice it takes is 9%, and when running background tasks it is _also_ 9%, the difference is so small that my money is on some rogue thread that blocks the rest from running efficiently.
Is there a way I can detect this thread is the UI thread or something else? Notice the cycles delta for 16108, this one is consistently on top (when I do nothing in the IDE). Again, 8% here means 100% on a single CPU core.

abelbraaksma
on 16 May 2020
Strike that, sorry for the noise. It makes no sense. I just tried the theory, but the hogging thread above, 16108, disappears completely (ends) when I edit something, ergo, it cannot be the UI thread. While editing, it shows a more logical slicing. Though it is beyond me why the numbers don't spread over the different cores and together add up to something closing to 100% when it's busy. There seems to be too much waiting-between-threads going on:

abelbraaksma
on 16 May 2020
The massive wait times with nothing going on smells like race condition or deadlock or something going on in the VS process. F# _does_ use multiple threads, but only for operations that rely strictly on parse data. It could be that we're messing with something else here, but I've never observed this with daily usage of VS in lots of F# codebases...VS threading, on the other hand, is immensely complicated and there's a lot of stuff happening outside of F# all the time in the VS process. So my intuition is that there's a bug somewhere else, but I couldn't say way.
Regarding this:
Note: with the setting disabled, initial startup is 7 sec (after first screen appears), and 2 sec before mouseover work, almost no delay whatsoever between edits. So I'm still not getting the "caching" bit and why the mouseover should wait for the background task to finish if the info is already there (the "stale" setting is enabled).
I think something operates in the wrong order here.
Tooltips rely on typechecked information, and due to the design of the F# compiler service and the nature of type inference, requests for that data are serialized and placed in a queue. This could be made a lot better in theory, but it'd be a huge amount of work.
cartermp
on 16 May 2020
requests for that data are serialized and placed in a queue
@cartermp That sounds like how I remember it, but there are two things that don't add up, or I don't understand them:
If cross-project setting is on, regardless of the caching setting, there's a noticeable and measurable delay in the tooltips, and thus the type inference to complete.
If cross-project setting is off, it is near-instantaneous.
Here's how I think it works:
- With the cross-project off, if I change something in a referenced project, it won't show in the top project until a recompile, or a restart of the solution.
- with the cross-project on, the system makes sure that such changes are propagated from referenced projects to referencing projects. This leads to additional CPU processing, but only when you change something in a referenced project.
And that's the thing: the behavior described here happens when I edit something in one file, in the top-project. It still appears to rebuild everything (the 3 min delay), as opposed to using stale data (I haven't seen this setting working, ever), or simply using the cached file (after all, there was no change in referenced projects).
If you need to rebuild all each time anyway, the caching-option ~makes little sense to me~ edit: wait, it means it keeps the fs files and other stuff in memory, may be I got it now ;). That's why it is faster when I set it to 200.
Also somewhat surprising: clean + rebuild all takes less time than waiting for tooltips to appear. I'd expect the other way around, since optimizations don't have to kick in.
So my intuition is that there's a bug somewhere else, but I couldn't say way.
yeah, my intuition was leaning that way too, alas... ;)
abelbraaksma
on 16 May 2020
@cartermp
Here is some code, it grabs a bunch of files, and then for each of them checks if it exists.
Unfortunately that is so fast I loop that a bunch of times so that if I blink I can tell it's still working.
I have two different commented out lines of code.
- Does a file exists and updates a counter.
- raises an exception, the counter is updated in the try block
````
open System
open System.IO
open System.Timers
[
let main argv =
let directory = new System.IO.DirectoryInfo(@"C:\kevinransom\fsharp\")
let files = directory.GetFiles("*.fs", SearchOption.AllDirectories)
let mutable count = 0

let st = DateTime.UtcNow
for loop in 1 .. 100 do
    for file in files do
        try
            if file.Exists then count <- count + 1
            //raise (new Exception("Some text"))      //if file.Exists then count <- count + 1
        with | _ -> count <- count + 1

let en = DateTime.UtcNow
let duration = en.Subtract(st)
printfn "%A - %A = %A Checked: %A" st en duration count

0 // return an integer exit code
````
So, this first result is for an outer loop of 100 loops of exceptions:
5/16/2020 12:50:01 AM - 5/16/2020 12:50:06 AM = 00:00:05.5101554 Checked: 454100
So thats pretty great 5.5 seconds for half a million exceptions ... groovy I'm excited.
This second result is for FindFile:
5/16/2020 12:51:27 AM - 5/16/2020 12:51:27 AM = 00:00:00.0044857 Checked: 454100
Oh bugger that's way to small a number to be snarky about.
Thats about a 1/2 a hundredth of a second half a million checks
Lets increase the outer loop to 175000
5/16/2020 12:54:07 AM - 5/16/2020 12:54:13 AM = 00:00:05.3581701 Checked: 794675000
So we get 794675000 File.Exists in about the same time as 454100 exceptions
KevinRansom
on 16 May 2020
@KevinRansom unfortunately this isn't quite what I'm asking. I'm not curious if we tested that File.Exists is faster than an exception. It always is (unless it also throws an exception). In the code I linked (and lots of other places File.Exists is called), it would seem really, really odd to me if the file being checked _didn't exist_. In other words, consider the following:
- Amortized time of raising exceptions in an IDE session due to files not existing
- Amortized time of checking
File.Existson files that are nearly always present
Which is higher in cases like what I linked to? Has this been tested?
cartermp
on 16 May 2020
So we get 794675000 File.Exists in about the same time as 454100 exceptions
This also suggests that this is not likely to be the cause, because I doubt my project, or any project, has 794,675,000 assemblies, and 5sec is not much on 40 min. Unless of course an outer loop is accidentally nested that leads to exponential performance of the mentioned code segment in IsSystemAssembly.
I also noted that FileSystem.SafeExists actually seems to use a cache underneath, which suggests that multiple calls shouldn't be too CPU or I/O intensive (though the backing dictionary is _not_ a concurrent dictionary...). I didn't check carefully, but it seemed to refer to this definition:
f#
        member __.SafeExists(fileName) =
            files.ContainsKey(fileName) || defaultFileSystem.SafeExists(fileName)
abelbraaksma
on 16 May 2020
I'm about to hit the hay (3.30AM here). Many thanks for your support and looking into this so far, it's really appreciated! I understand it is possible we won't be able to get to the bottom of this. Though it might help if I made a new trace of the current situation, which might shed some light on where time is being spent in the now faster-but-still-slower-than-expected situation.
It is not unlikely the situation will reoccur at some point, in which case I could try to make a different kind of trace that better shows any stalls (if that is possible).
abelbraaksma
on 16 May 2020
My theory about that big number in the trace, is that because IO was going on that is where the GC may have got control and memory collected. Except I half recall that gc is supposed to not suspend threads any more. So I suppose my theory is wrong too.
In a decently working dotnet sdk project I would expect IsSytemAssembly to only be called a few hundred times, and in a net framework project less than half that. But again I could be wrong.
What is bothering me, is that I am not seeing classification for VisualFSharp.sln on my machine and I feel like that must be due to my environment because someone should have complained about by now.
KevinRansom
on 16 May 2020
@abelbraaksma A new trace with:
- All extensions disabled
- in-memory cross-project references turned on
- project check cache set to 200
When memory/CPU usage is fairly high and things seem slow (or even slow-ish) could be interesting, it might yield some data pointing at other things that are not working as well as they could be.
cartermp
on 16 May 2020
If the "30 minutes until I get IntelliSense" problem shows up again we'll want to loop in some folks from the VS side to investigate further. That's an utterly absurd amount of time to get any feedback from the system and we'll want to get to the bottom of that.
cartermp
on 16 May 2020
is that I am not seeing classification for VisualFSharp.sln on my machine
Oh, you mean you don't see it all anymore? Odd... (or you hit the same issue I had: classification came in after a loooong time, just wait 1hr or so for it and meanwhile work in a different IDE instance).
abelbraaksma
on 16 May 2020
If the "30 minutes until I get IntelliSense" problem shows up again we'll want to loop in some folks from the VS side to investigate further. That's an utterly absurd amount of time to get any feedback from the system and we'll want to get to the bottom of that.
Meaning: I shouldn't "fix" it right away such that the repro disappears, but wait until you guys can have a peek. Np.
abelbraaksma
on 16 May 2020
A new trace with:
I'll prepare that tomorrow, if that's ok with you (I might otherwise fall asleep while waiting and staring at the mouseover not responding :P)
abelbraaksma
on 16 May 2020
@abelbraaksma If the issue shows up again when you're comfortable checking it out, we'll definitely want to investigate. But if you can live without your extensions for a while (since that seems to be the primary issue), then just working without them is ideal. Definitely don't want you to do work having to wait 30 minutes every time you type a character :)
Do you have a list of all your extensions you could share?
cartermp
on 16 May 2020
But if you can live without your extensions for a while (since that seems to be the primary issue),
@cartermp: you may have misunderstood, it was NOT the extensions, at least not by themselves. What happened was: I disabled all extensions, the behavior disappeared partially, then enabled them again and expected to find the rogue extension. But that never happened. The behavior remained the same.
abelbraaksma
on 16 May 2020
Except I half recall that gc is supposed to not suspend threads any more. So I suppose my theory is wrong too.
I think you mean this behavior? If I read that correctly, it is only true for Gen2 collections.
Do you have a list of all your extensions you could share?
Coming up
abelbraaksma
on 16 May 2020
@cartermp in the case of probing the file mostly doesn't exist, it is being searched for. However, 794675000 file exists costing 5 seconds I doubt that many programs search that many programs would search for a file 794 million times. although I could be wrong
KevinRansom
on 16 May 2020
Do you have a list of all your extensions you could share?
I installed an extension to export the extensions, I hope a JSON file is OK (it can be imported into a VS IDE using this extension, if you need to test a scenario or something). There's no private data in the file.
One extension isn't shown here, and that is NCrunch. That's a big one in terms of resource hogging, but it was disabled for all my tests and traces anyway. I only enable it when I work with the test projects.
Oh, and I still had a screenshot from extensions I installed the last time, just after I moved to a new instance of VS Community Edition:

abelbraaksma
on 16 May 2020
@cartermp, I've added a new trace through this VS Community issue: https://developercommunity.visualstudio.com/content/problem/1035124/trace-of-editing-experience-with-in-memory-cross-p-1.html.
Noticeably:
- The delay between typing and tooltips to come back was down to ~5-7s, which is workable
- Background tasks spun for about 5-10s, I think, between some edits
- Generally, the combined settings as you suggested are workable, as long as I edit a project that is at the end of the references-chain. But that is expected in the current situation (i.e., editing the Common project, shared by all, and large by itself, it expectedly takes some time before all projects are caught up).
Since this trace was done on the same solution with the same source and the same windows open, and I did by en large the same actions (typing a little, waiting for tooltips), it can be used to compare with the original trace.
My guess: this new trace shows what the Compiler Services are actually doing in terms of CPU-bound actions and the 20-40 min delay seen earlier, with a spinning devenv.exe, was held up by _something_, plus it had the mem-cache setting at 3 which caused many recalculations. You mentioned that you saw _almost nothing_ in the trace. That makes sense, seeing that the new trace is much, much shorter (1 min compared to 35 min and more edit actions done in that 1 min than in the 35 min in the other trace).
Big question remaining: what could it have possibly been that held the process so long?
When memory/CPU usage is fairly high and things seem slow (or even slow-ish) could be interesting, it might yield some data pointing at other things that are not working as well as they could be.
It appears that devenv.exe with the present settings doesn't spin with a single thread at 100% CPU for that thread (as shown in earlier screenshots). The difference between that moment and this moment are the disabled extensions. Arguably, there's at least one extension that runs rampant (but not so much that it caused the 20-40 min delay, we still don't know that). I'll investigate this further and try to single out an extension.
abelbraaksma
on 16 May 2020
@cartermp, @KevinRansom, the issue is back, it was not a fluke, and it's in a different file, different project, same solution. I'm recording again. While I type this from mobile, no coloring whatsoever has appeared, nor any tooltips, and I'm waiting for 15 minutes.
You wanted me to alert when it happened again, so that the VS team could have a look. Anything besides recording you'd like me to do?
I haven't yet tried the "magic fix" that worked before: disabling all extensions and reenabling them again. Cross prj caching is set to 200. Memory is at 1Gb. "Big" extensions are disabled.
abelbraaksma
on 18 May 2020
_still recording, ~30 min now~ ~60 min now~ ~1h20m now~ 2hrs now, 15 background tasks still running since starting recording. Still no coloring of any kind, seems hanging_
I'll let it run for another 15 min, if nothing changes, I'll stop recording and send the results, then I'll attach a debugger, maybe that'll shine some light to this.
EDIT: @cartermp & @KevinRansom, trace is here: https://developercommunity.visualstudio.com/content/problem/1036876/hitting-perf-issue-again-new-trace-for-issue-9201.html
And this is for fun, SleepEx, of course!!!:

abelbraaksma
on 18 May 2020
After a short search it looks like taskbardockappintegration32.dll belongs to a product named bins: http://www.1upindustries.com/bins/
It seems to load itself into any running process, probably using hooks.
Could you try to disable / uninstall that?
 0x53A
on 18 May 2020
0x53A
on 18 May 2020
@0x53A, that's a good one to try, never even occurred to me (used it for years without giving it another thought)! It doesn't, however, seem to relate to 100% CPU on one thread (Sleep doesn't cost CPU afaik, and it gives resources to other threads, if anything). I'll def. try switching it off though.
Meanwhile, most breaks while debugging (and just now when I tried to quit the process) seem related to FSharp. Any idea how to get symbols loaded of ni (native image) dll files?

abelbraaksma
on 18 May 2020
Hmm, this time, restarting VS IDE helped, and after opening the same solution again, same files etc etc, just appeared responsive after some 30 sec. (sorry @cartermp, I couldn't keep it open much longer, until VS IDE team could have a look, I need to go for some groceries soon, we'll try that session next time it happens again ;).
abelbraaksma
on 18 May 2020
There is ngen.exe createpdb https://stackoverflow.com/questions/23775844/how-to-get-the-pdb-file-for-mscorlib-ni-lib-net-framework-3-5
0x53A
on 18 May 2020
@0x53A, yeah, I know, wonder if that'll work with existing native images. Preferably I'd create the native images with pdb at install. Also, I'd have to dig into all linked dlls that need to be removed, then readded to the native cache. Certainly, I can't do that in the midst of a debugging session (at least, not that I know off).
abelbraaksma
on 18 May 2020
As far as I know it does exactly that - create a pdb for an existing native image, not recreate the image.
0x53A
on 18 May 2020
Cool! I'll set it up so that it's ready next time I hit this strange behavior.
abelbraaksma
on 18 May 2020
Actually, if that's true, it should even work during a session, as I can always load symbols after the fact. That'll help in many scenarios where I hit on ni.dll files.
abelbraaksma
on 18 May 2020
@abelbraaksma regarding the huge delay, @sharwell suspects it may be related to the Solution Error Visualizer plugin requesting information from closed files. It could be that the F# tools can't provide this data efficiently and it ends up taking forever, _and_ this ends up hogging the F# "reactor thread", which is the main vehicle for IDE tooling features to get the data they need to display things to the user. What do you think?
cartermp
on 19 May 2020
it may be related to the Solution Error Visualizer plugin
@cartermp That could certainly explain the first case. Though the second case (from yesterday) happened in a solution that didn't have any errors. Did you notice anything different in that trace?
Though I assume that "no errors" can still mean there are informational messages, and in fact, the C# projects showed several IDEXXX messages on missing translations of resources. Could that have gotten in the way?
abelbraaksma
on 19 May 2020
I can't speak to how the solution error visualizer works, but if it is requesting diagnostics from all closed files then it wouldn't matter if there are errors or not. Requesting diagnostics is an expensive feature since it involved calling the typechecker, which will then serialize each request.
cartermp
on 19 May 2020
@cartermp is correct. The extension has been known to be slow whether or not there were errors.
 sharwell
on 19 May 2020
sharwell
on 19 May 2020
I should emphasize that the original problem, at the time, occurred always in that particular solution, regardless of restarting the OS, cleaning the solution etc. There were errors in the solution then. The behavior disappeared after I disabled all extensions and re-enabled them. This suggests an issue with an extension, even though the behavior itself suggests an (almost) hanging F# background process (it did finish its bg processing eventually).
The reappearance of the issue, see latest trace, did even less than before: even after 2 hours, there wasn't even basic syntax coloring. This time it reset to normal behavior after restarting VS.
I may be able to find something in the traces myself, but I don't know where they are. I sent them to MS, but don't know where they are stored locally. Any ideas, @cartermp, @sharwell?
Issues like these are tricky to pin down, and I realize that the first step should be to try to repro without any extension, but that would slow down my development significantly.
Just now it may have been happening again (waited 5 min), but I restarted VS as there are, unfortunately, also some deadlines to catch ;). If there's someone I could message directly if it happens again, and give him or her remote access, would that help?
abelbraaksma
on 19 May 2020
@abelbraaksma did the problem still occur when you disabled _just_ the Solution Error Visualizer feature?
If you want to manually record and analyze the behavior, you can use the General Purpose scenario listed here and analyze the result with PerfView. 😄
sharwell
on 19 May 2020
disabled just the Solution Error Visualizer feature?
I haven't tried that yet, I'll check how to do that age see how that goes.
you can use the General Purpose scenario listed here and analyze the result with PerfView.
@sharwell, thanks, but I was actually hoping to be able to load those etl.zip files that I sent to MS. The problem doesn't happen all the time, having an offline trace to work with would be great. I know how to work with perfview, just don't know whether the bug report and trace feature stores the sent data in some local temp location (I would expect it does).
abelbraaksma
on 19 May 2020
@cartermp, I didn't think this was related previously, but since it just happened now again and, just before there was again no tooltips, coloring etc, I figured why not make another trace: this time the VS IDE hang on unloading the solution, stopping at "Unloading project 11 of 11". Posting it here, though it may or may not be related, as there are some differences:
- Prior to the odd behavior I had a debugging session that threw a
StackOverFlowException. During the break on the exception, the system was responsive (albeit with the usual caveats of debugging an SOE). - After debugging stopped, I lost coloring, tooltips, and after a few minutes decided to close the IDE.
- It should be noted that this time I had NCrunch _enabled_, and although it runs out-of-process for running tests, the SOE happened in a test and may have something to do with it
- One BIG difference with before: of 3 min trace, there's 2GB of trace data. Compared to previous posts, that's a lot more in much less time. Hopefully it shows where it's hanging (and yeah, I'm still suspecting extensions).
Also, @sharwell, I found where "Visual Studio Feedback" stores its data. It's partially in %TEMP% (the user-folder) and partially in %TEMP%\Microsoft\VSFeedbackCollector, the latter holding the ETL trace. Found it by checking what file-handles vs_installershell.exe had open, though I'm a little surprised this isn't common knowledge ;).
I'll post a link to the trace once the upload is complete.
abelbraaksma
on 20 May 2020
@cartermp: Link to the issue having the latest trace: https://developercommunity.visualstudio.com/content/problem/1038954/visual-studio-hanging-on-closing-the-ide-possibly.html (though it looks like the reporting tool is still uploading, but not too fast, at 250kB/s, for ~380MB or something)
abelbraaksma
on 20 May 2020
@cartermp, I did notice the following in the latest trace:
but not entirely sure what to make of it:
- CPU activity only shows in log after first 2m20s, and that's opposite of what task manager showed, which showed 100% all the time for the same IDE instance. This 2m20s moment may coincide with the moment, while tracing, I tried to click in the solution, behind the "unloading solution" messagebox.
- It is inside
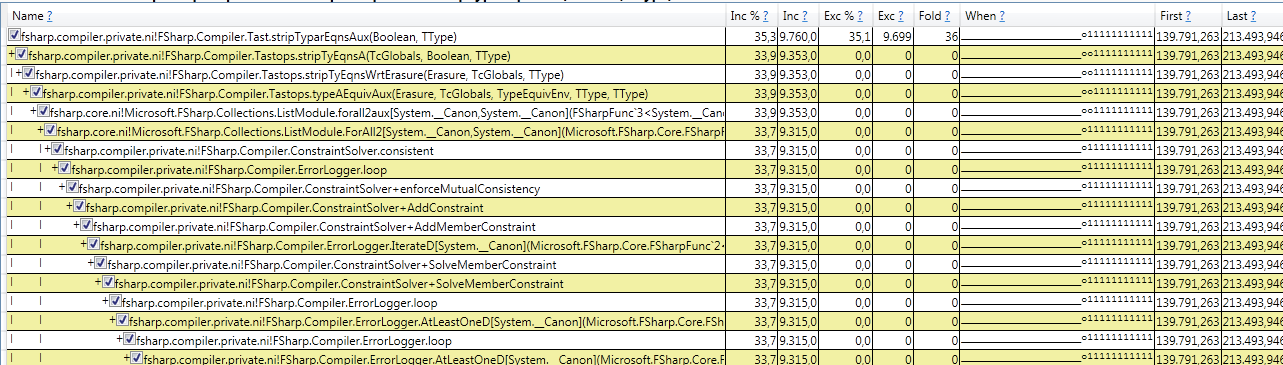
ErrorLoggerLoop, but (1) there were no compile-time errors, (2) this suggests a relation with @sharwell's comment on the error visualizer (still on in this trace) - Hotspot detecting is one thing, but all these situations seem to come down to threads waiting on each other and I'm not sure how to detect a hot waiting point (yet).
abelbraaksma
on 20 May 2020
CPU activity only shows in log after first 2m20s
Checking ETW events for Windows Kernel/PerfInfo/Sample shows that for some reason, the first samples only start after 139s. Hmm. Maybe something similar happened with the first trace where you said that there was almost nothing happening for a long time. It would also explain why that first trace file was way too small for 40 min of system-wide sample-based tracing. Maybe the reporting tool caps the max tracing amount and removes CPU traces except for the last minute or so?
If that's true, I need to change my reporting strategy. @sharwell, do you know more about this perhaps? It feels a bit like the same way PerfMon works and by default only shows 2 min CPU history and never more.
abelbraaksma
on 20 May 2020
The traces are recorded in a circular buffer. When the buffer runs out of room, old events are discarded to make room for new. Since there are multiple buffers involved internally, the phenomenon might not happen at exactly one point in time - each event type and view might start showing data at a different time in the trace.
sharwell
on 20 May 2020
@sharwell, thanks, that's what I suspected. That also explains @cartermp's surprise that he didn't see any activity until the very last moment.
I indeed saw that some other event traces did log during the whole time.
An important thing to know in analyzing this.
abelbraaksma
on 20 May 2020
Based on all the new information, and since the VS IDE kept hanging on closing the IDE, I did:
- Disable all extensions from VS's own Extension Manager
- Force-close the IDE (it was hanging again)
- Reopen the same IDE, same solution (it did have some errors in the code)
- Wait 3 or so minutes, try to close: it was hanging again
I then made a 1 min trace, which is reported here: https://developercommunity.visualstudio.com/content/problem/1041761/same-as-before-hanging-on-closing-vs-ide-with-an-f.html (still uploading, looking at the tcp/ip traffic).
@sharwell, @cartermp, @KevinRansom I hope this new trace allows to do a more to the point analysis, as it rules out extensions this time. The hanging does suggests, to me at least, that the cause may not be solely F# related.
abelbraaksma
on 20 May 2020
We'll want to dig into this one, assuming I'm reading it right.

That's nearly 12GB of allocations in 97.5 seconds, coming from 112.3k calls to AddConstraint,
It's also 87% of all CPU time in the sample:

I'm thinking something is horribly wrong, since that is an absurd amount of allocations and CPU time.
cartermp
on 21 May 2020
FYI @cartermp @abelbraaksma
When the project cache is set lower than the amount of projects than you actually have and have Enable in-memory cross-project references turned on, you will experience cache thrashing and it will tank everything. Per target framework is considered one project, therefore one project with 3 TFMs is like three projects and in VS, everytime you type it will try to update the three versions of the project at one time which can slow things down.
Honestly, we should just stop allowing anyone to set this number when in-memory cross projects turned on, it simply does not work and has not worked ever.
 TIHan
on 21 May 2020
TIHan
on 21 May 2020
That's nearly 12GB of allocations in 97.5 seconds, coming from 112.3k calls to AddConstraint,
@cartermp Wow! That's indeed extreme!
ATM the extreme behavior happens to all solutions except one, making it, unf., impossible to work.
I may also have found something else that appears to be related to the coloring, tooltips etc coming very, very late. I left it on overnight and found this:
- Next morning, coloring was there "as normal", as long as I didn't type anything
- CPU time of the process was 3h20min (!!!).
- Peak mem of devenv.exe 700MB, current mem 445MB
- Process started at 19:08, and at 22:54, I noticed this in the eventlog:
Application: devenv.exe
Framework Version: v4.0.30319
Description: The process was terminated due to an unhandled exception.
Exception Info: System.AccessViolationException
   at System.Runtime.InteropServices.Marshal.ReadInt32(IntPtr, Int32)
   at FSharp.Compiler.AbstractIL.Internal.RawByteMemory.ReadInt32(Int32)
   at FSharp.Compiler.AbstractIL.ILBinaryReader.seekReadCustomAttributeRow(ILMetadataReader, Int32)
   at FSharp.Compiler.AbstractIL.ILBinaryReader+customAttrsReader@2348-1.Invoke(Int32)
   at FSharp.Compiler.AbstractIL.ILBinaryReader.seekReadIndexedRows$cont@739[[System.__Canon, mscorlib, Version=4.0.0.0, Culture=neutral, PublicKeyToken=b77a5c561934e089],[FSharp.Compiler.AbstractIL.ILBinaryReader+TaggedIndex`1[[FSharp.Compiler.AbstractIL.Internal.BinaryConstants+HasCustomAttributeTag, FSharp.Compiler.Private, Version=10.8.0.0, Culture=neutral, PublicKeyToken=b03f5f7f11d50a3a]], FSharp.Compiler.Private, Version=10.8.0.0, Culture=neutral, PublicKeyToken=b03f5f7f11d50a3a],[System.__Canon, mscorlib, Version=4.0.0.0, Culture=neutral, PublicKeyToken=b77a5c561934e089]](Microsoft.FSharp.Core.FSharpFunc`2<Int32,System.__Canon>, Microsoft.FSharp.Core.FSharpFunc`2<System.__Canon,System.__Canon>, Int32, Microsoft.FSharp.Core.FSharpFunc`2<System.__Canon,TaggedIndex`1<HasCustomAttributeTag>>, Microsoft.FSharp.Core.FSharpFunc`2<TaggedIndex`1<HasCustomAttributeTag>,Int32>, Microsoft.FSharp.Core.Unit)
   at FSharp.Compiler.AbstractIL.ILBinaryReader.seekReadIndexedRows[[System.__Canon, mscorlib, Version=4.0.0.0, Culture=neutral, PublicKeyToken=b77a5c561934e089],[FSharp.Compiler.AbstractIL.ILBinaryReader+TaggedIndex`1[[FSharp.Compiler.AbstractIL.Internal.BinaryConstants+HasCustomAttributeTag, FSharp.Compiler.Private, Version=10.8.0.0, Culture=neutral, PublicKeyToken=b03f5f7f11d50a3a]], FSharp.Compiler.Private, Version=10.8.0.0, Culture=neutral, PublicKeyToken=b03f5f7f11d50a3a],[System.__Canon, mscorlib, Version=4.0.0.0, Culture=neutral, PublicKeyToken=b77a5c561934e089]](Int32, Microsoft.FSharp.Core.FSharpFunc`2<Int32,System.__Canon>, Microsoft.FSharp.Core.FSharpFunc`2<System.__Canon,TaggedIndex`1<HasCustomAttributeTag>>, Microsoft.FSharp.Core.FSharpFunc`2<TaggedIndex`1<HasCustomAttributeTag>,Int32>, Boolean, Microsoft.FSharp.Core.FSharpFunc`2<System.__Canon,System.__Canon>)
   at FSharp.Compiler.AbstractIL.ILBinaryReader+customAttrsReader@2345.Invoke(Int32)
   at FSharp.Compiler.AbstractIL.IL+ILAttributesStored.GetCustomAttrs(Int32)
   at FSharp.Compiler.CompileOps.GetCustomAttributesOfILModule(ILModuleDef)
   at FSharp.Compiler.CompileOps+TcImports.PrepareToImportReferencedILAssembly(CompilationThreadToken, range, System.String, ImportedBinary)
   at FSharp.Compiler.CompileOps+RegisterAndPrepareToImportReferencedDll@4502-1.Invoke(Microsoft.FSharp.Core.FSharpOption`1<IRawFSharpAssemblyData>)
   at FSharp.Compiler.AbstractIL.Internal.Library+CancellableModule+bind@706[[System.__Canon, mscorlib, Version=4.0.0.0, Culture=neutral, PublicKeyToken=b77a5c561934e089],[System.__Canon, mscorlib, Version=4.0.0.0, Culture=neutral, PublicKeyToken=b77a5c561934e089]].Invoke(System.Threading.CancellationToken)
   at FSharp.Compiler.AbstractIL.Internal.Library+CancellableModule+bind@706[[System.__Canon, mscorlib, Version=4.0.0.0, Culture=neutral, PublicKeyToken=b77a5c561934e089],[System.__Canon, mscorlib, Version=4.0.0.0, Culture=neutral, PublicKeyToken=b77a5c561934e089]].Invoke(System.Threading.CancellationToken)
   at FSharp.Compiler.AbstractIL.Internal.Library+CancellableModule+catch@764[[System.__Canon, mscorlib, Version=4.0.0.0, Culture=neutral, PublicKeyToken=b77a5c561934e089]].Invoke(System.Threading.CancellationToken)
   at FSharp.Compiler.AbstractIL.Internal.Library+CancellableModule+bind@706[[System.__Canon, mscorlib, Version=4.0.0.0, Culture=neutral, PublicKeyToken=b77a5c561934e089],[System.__Canon, mscorlib, Version=4.0.0.0, Culture=neutral, PublicKeyToken=b77a5c561934e089]].Invoke(System.Threading.CancellationToken)
   at FSharp.Compiler.AbstractIL.Internal.Library+CancellableModule+each@734-1[[System.__Canon, mscorlib, Version=4.0.0.0, Culture=neutral, PublicKeyToken=b77a5c561934e089],[System.__Canon, mscorlib, Version=4.0.0.0, Culture=neutral, PublicKeyToken=b77a5c561934e089]].Invoke(ValueOrCancelled`1<Microsoft.FSharp.Collections.FSharpList`1<System.__Canon>>, System.__Canon)
   at Microsoft.FSharp.Collections.SeqModule.Fold[[System.__Canon, mscorlib, Version=4.0.0.0, Culture=neutral, PublicKeyToken=b77a5c561934e089],[System.__Canon, mscorlib, Version=4.0.0.0, Culture=neutral, PublicKeyToken=b77a5c561934e089]](Microsoft.FSharp.Core.FSharpFunc`2<System.__Canon,Microsoft.FSharp.Core.FSharpFunc`2<System.__Canon,System.__Canon>>, System.__Canon, System.Collections.Generic.IEnumerable`1<System.__Canon>)
   at FSharp.Compiler.AbstractIL.Internal.Library+CancellableModule+each@732[[System.__Canon, mscorlib, Version=4.0.0.0, Culture=neutral, PublicKeyToken=b77a5c561934e089],[System.__Canon, mscorlib, Version=4.0.0.0, Culture=neutral, PublicKeyToken=b77a5c561934e089]].Invoke(System.Threading.CancellationToken)
   at FSharp.Compiler.AbstractIL.Internal.Library+CancellableModule+bind@706[[System.__Canon, mscorlib, Version=4.0.0.0, Culture=neutral, PublicKeyToken=b77a5c561934e089],[System.__Canon, mscorlib, Version=4.0.0.0, Culture=neutral, PublicKeyToken=b77a5c561934e089]].Invoke(System.Threading.CancellationToken)
   at FSharp.Compiler.AbstractIL.Internal.Library+CancellableModule+bind@706[[System.__Canon, mscorlib, Version=4.0.0.0, Culture=neutral, PublicKeyToken=b77a5c561934e089],[System.__Canon, mscorlib, Version=4.0.0.0, Culture=neutral, PublicKeyToken=b77a5c561934e089]].Invoke(System.Threading.CancellationToken)
   at FSharp.Compiler.AbstractIL.Internal.Library+CancellableModule+bind@706[[System.__Canon, mscorlib, Version=4.0.0.0, Culture=neutral, PublicKeyToken=b77a5c561934e089],[System.__Canon, mscorlib, Version=4.0.0.0, Culture=neutral, PublicKeyToken=b77a5c561934e089]].Invoke(System.Threading.CancellationToken)
   at FSharp.Compiler.AbstractIL.Internal.Library+CancellableModule+bind@706[[System.__Canon, mscorlib, Version=4.0.0.0, Culture=neutral, PublicKeyToken=b77a5c561934e089],[System.__Canon, mscorlib, Version=4.0.0.0, Culture=neutral, PublicKeyToken=b77a5c561934e089]].Invoke(System.Threading.CancellationToken)
   at FSharp.Compiler.AbstractIL.Internal.Library+CancellableModule+bind@706[[System.__Canon, mscorlib, Version=4.0.0.0, Culture=neutral, PublicKeyToken=b77a5c561934e089],[System.__Canon, mscorlib, Version=4.0.0.0, Culture=neutral, PublicKeyToken=b77a5c561934e089]].Invoke(System.Threading.CancellationToken)
   at FSharp.Compiler.AbstractIL.Internal.Library+CancellableModule+catch@764[[System.__Canon, mscorlib, Version=4.0.0.0, Culture=neutral, PublicKeyToken=b77a5c561934e089]].Invoke(System.Threading.CancellationToken)
   at FSharp.Compiler.AbstractIL.Internal.Library+CancellableModule+bind@706[[System.__Canon, mscorlib, Version=4.0.0.0, Culture=neutral, PublicKeyToken=b77a5c561934e089],[System.__Canon, mscorlib, Version=4.0.0.0, Culture=neutral, PublicKeyToken=b77a5c561934e089]].Invoke(System.Threading.CancellationToken)
   at FSharp.Compiler.AbstractIL.Internal.Library+CancellableModule+bind@706[[System.__Canon, mscorlib, Version=4.0.0.0, Culture=neutral, PublicKeyToken=b77a5c561934e089],[System.__Canon, mscorlib, Version=4.0.0.0, Culture=neutral, PublicKeyToken=b77a5c561934e089]].Invoke(System.Threading.CancellationToken)
   at FSharp.Compiler.AbstractIL.Internal.Library+CancellableModule+catch@764[[System.__Canon, mscorlib, Version=4.0.0.0, Culture=neutral, PublicKeyToken=b77a5c561934e089]].Invoke(System.Threading.CancellationToken)
   at FSharp.Compiler.AbstractIL.Internal.Library+CancellableModule+bind@706[[System.__Canon, mscorlib, Version=4.0.0.0, Culture=neutral, PublicKeyToken=b77a5c561934e089],[System.__Canon, mscorlib, Version=4.0.0.0, Culture=neutral, PublicKeyToken=b77a5c561934e089]].Invoke(System.Threading.CancellationToken)
   at FSharp.Compiler.AbstractIL.Internal.Library+CancellableModule+bind@706[[System.__Canon, mscorlib, Version=4.0.0.0, Culture=neutral, PublicKeyToken=b77a5c561934e089],[System.__Canon, mscorlib, Version=4.0.0.0, Culture=neutral, PublicKeyToken=b77a5c561934e089]].Invoke(System.Threading.CancellationToken)
   at FSharp.Compiler.AbstractIL.Internal.Library+CancellableModule+bind@706[[System.__Canon, mscorlib, Version=4.0.0.0, Culture=neutral, PublicKeyToken=b77a5c561934e089],[System.__Canon, mscorlib, Version=4.0.0.0, Culture=neutral, PublicKeyToken=b77a5c561934e089]].Invoke(System.Threading.CancellationToken)
   at FSharp.Compiler.AbstractIL.Internal.Library+CancellableModule.runWithoutCancellation[[System.__Canon, mscorlib, Version=4.0.0.0, Culture=neutral, PublicKeyToken=b77a5c561934e089]](Cancellable`1<System.__Canon>)
   at FSharp.Compiler.SourceCodeServices.BackgroundCompiler.TryGetLogicalTimeStampForProject(TimeStampCache, CompilationThreadToken, FSharp.Compiler.SourceCodeServices.FSharpProjectOptions, System.String)
   at <StartupCode$FSharp-Compiler-Private>.$Service+projectReferences@292-1.FSharp-Compiler-CompileOps-IProjectReference-TryGetLogicalTimeStamp(TimeStampCache, CompilationThreadToken)
   at FSharp.Compiler.CompileOps+TimeStampCache.GetProjectReferenceTimeStamp(IProjectReference, CompilationThreadToken)
   at <StartupCode$FSharp-Compiler-Private>[email protected](TimeStampCache, CompilationThreadToken)
   at FSharp.Compiler.IncrementalBuild.checkStamp@623[[System.__Canon, mscorlib, Version=4.0.0.0, Culture=neutral, PublicKeyToken=b77a5c561934e089]](TimeStampCache, CompilationThreadToken, PartialBuild, Microsoft.FSharp.Core.FSharpFunc`2<Action,Microsoft.FSharp.Core.FSharpFunc`2<System.__Canon,System.__Canon>>, VectorBuildRule, System.String, VectorBuildRule, Id, Microsoft.FSharp.Core.FSharpFunc`2<TimeStampCache,Microsoft.FSharp.Core.FSharpFunc`2<CompilationThreadToken,Microsoft.FSharp.Core.FSharpFunc`2<System.Object,System.DateTime>>>, Int32, System.__Canon, Int32)
   at Microsoft.FSharp.Collections.ListModule.Fold[[System.Int32, mscorlib, Version=4.0.0.0, Culture=neutral, PublicKeyToken=b77a5c561934e089],[System.__Canon, mscorlib, Version=4.0.0.0, Culture=neutral, PublicKeyToken=b77a5c561934e089]](Microsoft.FSharp.Core.FSharpFunc`2<System.__Canon,Microsoft.FSharp.Core.FSharpFunc`2<Int32,System.__Canon>>, System.__Canon, Microsoft.FSharp.Collections.FSharpList`1<Int32>)
   at FSharp.Compiler.IncrementalBuild.visitVector@537-1[[System.__Canon, mscorlib, Version=4.0.0.0, Culture=neutral, PublicKeyToken=b77a5c561934e089]](TimeStampCache, CompilationThreadToken, PartialBuild, Microsoft.FSharp.Core.FSharpFunc`2<Action,Microsoft.FSharp.Core.FSharpFunc`2<System.__Canon,System.__Canon>>, System.Collections.Generic.Dictionary`2<Id,Boolean>, Microsoft.FSharp.Core.FSharpOption`1<Int32>, VectorBuildRule, System.__Canon)
   at FSharp.Compiler.IncrementalBuild.visitVector@537-1[[System.__Canon, mscorlib, Version=4.0.0.0, Culture=neutral, PublicKeyToken=b77a5c561934e089]](TimeStampCache, CompilationThreadToken, PartialBuild, Microsoft.FSharp.Core.FSharpFunc`2<Action,Microsoft.FSharp.Core.FSharpFunc`2<System.__Canon,System.__Canon>>, System.Collections.Generic.Dictionary`2<Id,Boolean>, Microsoft.FSharp.Core.FSharpOption`1<Int32>, VectorBuildRule, System.__Canon)
   at [email protected](Microsoft.FSharp.Core.Unit)
   at FSharp.Compiler.AbstractIL.Internal.Library+CancellableModule+delay@746[[System.__Canon, mscorlib, Version=4.0.0.0, Culture=neutral, PublicKeyToken=b77a5c561934e089]].Invoke(System.Threading.CancellationToken)
   at FSharp.Compiler.AbstractIL.Internal.Library+CancellableModule+bind@706[[System.Boolean, mscorlib, Version=4.0.0.0, Culture=neutral, PublicKeyToken=b77a5c561934e089],[System.__Canon, mscorlib, Version=4.0.0.0, Culture=neutral, PublicKeyToken=b77a5c561934e089]].Invoke(System.Threading.CancellationToken)
   at <StartupCode$FSharp-Compiler-Private>[email protected](CompilationThreadToken, System.Threading.CancellationToken)
   at <StartupCode$FSharp-Compiler-Private>[email protected](Microsoft.FSharp.Core.FSharpOption`1<FSharp.Compiler.SourceCodeServices.ReactorCommands>)
   at Microsoft.FSharp.Control.AsyncPrimitives.CallThenInvokeNoHijackCheck[[System.__Canon, mscorlib, Version=4.0.0.0, Culture=neutral, PublicKeyToken=b77a5c561934e089],[System.__Canon, mscorlib, Version=4.0.0.0, Culture=neutral, PublicKeyToken=b77a5c561934e089]](Microsoft.FSharp.Control.AsyncActivation`1<System.__Canon>, Microsoft.FSharp.Core.FSharpFunc`2<System.__Canon,Microsoft.FSharp.Control.FSharpAsync`1<System.__Canon>>, System.__Canon)
   at <StartupCode$FSharp-Core>.$Mailbox+processFirstArrival@272-3[[System.__Canon, mscorlib, Version=4.0.0.0, Culture=neutral, PublicKeyToken=b77a5c561934e089]].Invoke(Microsoft.FSharp.Control.AsyncActivation`1<Microsoft.FSharp.Core.FSharpOption`1<System.__Canon>>)
   at Microsoft.FSharp.Control.Trampoline.Execute(Microsoft.FSharp.Core.FSharpFunc`2<Microsoft.FSharp.Core.Unit,Microsoft.FSharp.Control.AsyncReturn>)
   at Microsoft.FSharp.Control.TrampolineHolder.ExecuteWithTrampoline(Microsoft.FSharp.Core.FSharpFunc`2<Microsoft.FSharp.Core.Unit,Microsoft.FSharp.Control.AsyncReturn>)
   at <StartupCode$FSharp-Core>[email protected](System.Object, Boolean)
   at System.Threading._ThreadPoolWaitOrTimerCallback.WaitOrTimerCallback_Context(System.Object, Boolean)
   at System.Threading._ThreadPoolWaitOrTimerCallback.WaitOrTimerCallback_Context_t(System.Object)
   at System.Threading.ExecutionContext.RunInternal(System.Threading.ExecutionContext, System.Threading.ContextCallback, System.Object, Boolean)
   at System.Threading.ExecutionContext.Run(System.Threading.ExecutionContext, System.Threading.ContextCallback, System.Object, Boolean)
   at System.Threading._ThreadPoolWaitOrTimerCallback.PerformWaitOrTimerCallback(System.Object, Boolean)
When I checked other occurrences of that event, there was one at 15 May, 2020 (the date I first reported this issue). Note that it says "the process was terminated", but it doesn't say which process. Devenv.exe is still running a.t.m.
I apologize for not checking the event viewer sooner. However, this error seems to appear only after the _very long waiting for coloring to appear_ finishes. In most cases I've killed the process long before that, which is probably why I only see this error 7 times since 19 April, 2020.
What is still very hard to understand is that I've seen both the good and bad behavior with exactly the same code. Otherwise I'd assume some combination of code causes an exponential performance curve.
@TIHan, that seems right, and was also @cartermp's suggestion: to set the number of cached projects to 200. The total amount of projects is somewhere between 9 and 20 for most solutions I work on. Maybe we can simply hide the setting, or add some warning text like "experimental". Iirc, it was once introduced in a time with VS 2017 or so that F# tooling regularly caused VS to run out of memory. That's not the case so much anymore.
I'm going to clear everything, update everything that wasn't updated yet, restart and re-enable/re-disable the extensions. Earlier on that caused the VS IDE to behave normally again.
abelbraaksma
on 21 May 2020
@cartermp: To rule out some possible causes, I've tried the following things
- Restart & Update Windows, repair any possibly damaged files (nothing was found in the repair process)
- Open the troubled solutions in VS 2017 for those where this was still possible (background processing ended, but tooltips do not appear)
- Run VS 2019 with
-safemode - Install VS 2019 Community Preview, latest public release 16.7.0 Preview 1.0. Leaving all default settings as they are, no extensions.
After each step, I reopened one or more of the troubling solutions. While a few days ago, disabling extensions removed the issue, whether or not there was an error in the code, today, each and every attempt results in the same behavior:
- Sometimes coloring of types appears, sometimes it doesn't. Tooltips never appear (unless I wait 3 or more hours)
- In all cases, closing VS IDE resulted in VS hanging with "unloading project 10 of 10" (I've also separately reported that one)
- Removing the error after loading the solution _with_ the error did not help
What I haven't tried yet:
- New copy of the sources (perhaps a source file has gotten corrupted?)
- Rolling back to a previous version of the source where it still worked, and rolling forward to the current version again.
- Opening the solution on other OS's and/or systems (this'll take time to set up)
Bottom line: I'm now totally locked out of developing :S.
abelbraaksma
on 21 May 2020
FINALLY!!!!!! @KevinRansom, @cartermp, @sharwell, @TIHan: I have a repro, and a likely cause, see attached zip. It is possibly not as simple as it could be, but at least it is down to 2 files, a few hundred same-looking lines in a project with no dependencies other than that of a default project.
It only took three days to get down to this abomination of a repro :D. Apologies it isn't smaller.
Detailed instructions are in the solution in BaseForTest.fs. The state the solution is currently in _should_ show the erratic behavior:
- Open the solution in VS 2019 IDE (the behavior was observed in Win7 and Win10, VS 2017, 2019 and most recent Preview editions)
- Make sure both files are open
- Scroll to
createEraticBehavior(line 69 inBaseForTests.fs) and move your mouse a bit. After some time, you should see no tooltips, and maybe no full coloring, you will see a bunch of errors (this is correct, the sln is in an error state). - Wait at least 1 min (my machine, it can be longer, or shorter)
Now you have two scenarios:
- Try to fix the error by commenting the marked three lines, and adding
()at the end of that function. You should now see that the tooltips do not come back. Errors keep showing, but you can compile. - Try to close the IDE. It should hang on the "Unloading project 1 of 1" message.
An alternative is to do the opposite. Fix the lines by commenting them out. Close (or force-close) the IDE. Reopen the solution. Recreate the error lines (by removing the comments and the () at the end). Wait some time. Sometimes in this scenario the tooltips remain working. Sometimes not.
The deliberately wrong function is the following (the observed behavior can be seen with many other "errors while typing", this was just the easiest to repro):

The messagebox shown and not disappearing when closing IDE should be the following:

The cause of this erratic behavior of the IDE and the F# compiler lies in the second file, CreateLockup.fs. If you remove that file completely, all actions mentioned above "just work". If you remove part of the ofObj function (just remove some cases from the long match-statement), the behavior returns to normal.
I've observed while refactoring this that from time to time I needed to make ofObj larger for the behavior to appear. It seems like other parts of the original code contributed to the lock-up. As a result the current code looks rather ridiculous, and granted, it is, but I needed something "simple" to show the behavior.
My guess: something is operating on O(2^n) or worse the minute certain parts cannot be resolved in the SRTP code, and it keeps on looking or something, but won't find a resolution for the cast function.
(edit 2020-05-28: new upload is a bit cleaner, removes a warming and removes a bunch of lines that didn't add up to the erratic behavior)
FSharpBug9201.zip
I would appreciate it if someone could try the repro on their machine. Even though I can observe the behavior on at least two machines with two different OS's and basically all versions of VS since 2017, it is very well possible that a faster machine does not lock up, or only spins for a few min instead of hours. In that case, you may artificially add even more createFrom overloads and new cases in ofObj.
PS: it should be stressed that this looks like "extreme" code, but that's just what I had to do to get down to a repro. I do have code like createFrom with many overloads, there's still some resemblance with the actual real world project.
PPS: originally, the behavior reported in my OP shows that after some time the IDE comes back, it just gets really, really slow. My gut tells me that happens just before a possible O(2^n) or O(n!) operation can still be finished before the end of times. Add one more case that adds to the exponential behavior, and what took 40 minutes can become 40 years.
PPPS: if I wait 3h, 30min (CPU time), using the zip provided here, the devenv.exe process calms down and I can close the IDE normally without it locking up. So, whatever loop is causing this, it halts eventually.
abelbraaksma
on 22 May 2020
This reproduces on my system. For me VS becomes unresponsive after commenting the three lines.
 charlesroddie
on 26 May 2020
charlesroddie
on 26 May 2020
@cartermp, @KevinRansom, @TIHan: if I remove the SRTP part, as in the attached ZIP, the system remains responsive and acts normal. Though the SRTP is very straightforward (only one function with a method constraint), and each use is typed, meaning there shouldn't be a need for an X × Y complexity behavior.
The constrained resolution should show a linear performance characteristic here, which in this code (see CreateLockup.fs) means no of usages × cost for overload-lookup. Since it gets extremely slow, this either means that singular cost for overload-lookup is slow, but only when SRTP is involved, or there's a hidden exponential cost. This is further substantiated by the fact that removing just a bunch of lines from CreateLockup.fs will stop, or severely lessens, this behavior.
For comparison, same code without SRTP, that does not lead to an IDE lockup is here:
FSharpBug9201-no-SRTP.zip
(please do not mistake this for a workaround, it is only in this simple repro that I can fix the code. In real-world code I cannot just remove all SRTP)
@charlesroddie, many thanks for trying the repro. I hope to see more confirmations from others as well, or better yet, a hint as to what causes this :).
abelbraaksma
on 28 May 2020
@cartermp, @KevinRansom, sorry to bug you again, I know you guys are very busy, but I'm still blocked from normal development and need help to continue. Could you take a look, please? See my comment from two weeks ago. It would already help me _a lot_ if someone is able to say "put a breakpoint there and there and then try this and that", or "the cause is likely here in the source", then I know where to look further.
abelbraaksma
on 7 Jun 2020
I'm really not surprised 300 overloads of createFrom causes SRTP resolution to grind to a halt.
Why are you coding it like this? It's been known for a long time (ever since SRTP was implemented - 15 years) that there are limitations on performance for the mechanism, and that very large overload sets are going to be an issue. This has been discussed many times (and some attempts in F# 4.x to shortcut performance bottlenecks caused incinsistencies in the core resolution mechanism).
You should not use SRTP like this until performance is known to be suitable for such large overload sets.
If we do any work on this, it would only be as part of or additive to #6805, which incorporated very careful testing for some applications of constraint resolution. And even if we fixed this particular issue immediately, it seems very likely you are going to hit other similar problems.
In either case you should not use SRTP over 300 overloads on your critical coding path, and unblock yourself by removing your use of it. In particular avoid maximally generic, multi-variate SRTP like this:
    let inline castInternal< ^a, ^b when (^a or ^b) : (static member createFrom :  ^a -> ^b)> (v: ^a): ^b =
        ((^a or ^b) : (static member createFrom :  ^a -> ^b) v)
I modified your code to remove the use of SRTP simply by changing to an explicit call to TestItemSeq.createFrom at each call to !! and didn't seen any further problems.
https://gist.github.com/dsyme/9606cd38002295eb7ff1f28c3155df80
 dsyme
on 8 Jun 2020
dsyme
on 8 Jun 2020
@dsyme, I know that using SRTP like this might cause issues. But that's not relevant:
- this is a repro. The original issue took place in a code base that has 200k lines, which less SRTP. The code as you see it is the smallest I can do to repro the issue, but doesn't occur in the original code.
- VS is only grinding to a halt if up stream there's an error. And it matters what kind of error
- The code as given compiles fast, and shows tooltips fast. Unless an error occurs, and unless you leave that error for about 40 sec (on my system).
- The SRTP used here has O(n) lookup for the overload, is local, and therefore shouldn't explode (as shown by normal compile times).
The problem may well be with SRTP, also in my original solution there's SRTP, if not only because I use F# core library functions.
But the behavior is not sound, SRTP or not. It compiles and resolved fine, and if an error occurs upstream, it sometimes prevents further processing of anything.
I don't think this is a performance issue that needs fixing, but a bug that somehow should stop doing whatever it's doing when there's an incomplete let binding present.
It goes from few sec type inference resolution, to 2.5hr when there's, in the same code, a single error. That just can't be right, SRTP or not. And that doesn't disappear when you fix the error, and it locks VS from closing. No code should be able to do that.
After restart of VS you still won't be able to continue. If you don't have a backup, you're out of luck. Best you can do is rollback your code in your source control and lose your work. Again, no code, however bad, should have that effect.
Btw, I've encountered the issue of VS becoming unresponsive in code that didn't have SRTP down stream. I know that doesn't mean it's the same thing, but I do know that from the best of my reflection, this kind of behavior just happens from time to time (few times a day). Ingredients for this happening: large code base, frequent editing, somewhere a typo.
I modified your code to remove the use of SRTP
Tx, I did that too, and provided the contrarepro as well in my penultimate comment.
abelbraaksma
on 8 Jun 2020
VS is only grinding to a halt if up stream there's an error. And it matters what kind of error
Yes, it would be good if it was stable in the presence of introduced errors. However if there are errors then there are almost certainly more unresolved type inference variables floating around the code, and this will mean method overload resolution of SRTP will not succeed. This could cause a dramatic difference in such a case.
In other words, the slow resolution of SRTP over very large overload sets might only manifest itself when errors are introduced.
I'll think over whether there's any way to make this stable, and it would be good to test it in the context of https://github.com/dotnet/fsharp/pull/6805. But the "just don't do this" guidance is definitely still in place.
dsyme
on 10 Jun 2020
But the "just don't do this" guidance is definitely still in place.
I understand, but there are sometimes no other ways to code something, unless you want boxing or RTTI. Neither are ideal, and SRTP is being used both in FSC as in many libraries, code examples and real-world projects. Perhaps you mean "don't use double-lookup SRTP" (or whatever the ^a and ^b syntax is called), or you mean "don't use it when the set is of overloads is large" (what is large?).
I was also under the mistaken impression that local inline functions with SRTP have less this problem than global ones. That seems not to be the case, it doesn't matter whether it is in scope or not.
I've no problem with optimizing code to please the compiler, or in this case, to please the IDE. I'd rather not, but that's what it is. But since I have no idea what kind of code can crash the IDE, I just code and don't expect the worst (generally).
So I searched around and found that there are ~10 such inline functions~ EDIT: only 6 (rest was in comments and test prj), mostly local, some of the type op_Explicit, like the following:
f#
let inline (!>) (x:^a) : ^b = ((^a or ^b) : (static member op_Explicit: ^a -> ^b) x)
and a few others. In the "full solution" I've no idea which of them will cause issues, but I can certainly refactor some of them:
- Work with marker interfaces and casting
- Replace certain inline functions of type
^a or ^bwith single-direction type resolution (whatever the term is). If the return type is known, that shouldn't be an issue. - Some places have 50 or so overloads (not the 120+ from the example though). While I don't have a good alternative approach yet, with a bit of creativity I'm sure I can bring this down. The problem here is: I need the overloads, or something like it, because type-testing everything is simply not feasible and extremely slow. (again, the repro is not a good example, the overloads + SRTP are needed for type-safety, whereas the example repro shows an extremely slow explicit cast)
and this will mean method overload resolution of SRTP will not succeed. This could cause a dramatic difference in such a case.
It's certainly "dramatic" ;). It's just so weird that you can code for many hours like a breeze, but then suddenly everything freezes, and you've no idea how you got there (Ctrl-Z won't help, because, you know: frozen).
@dsyme, Anyway, thanks for looking into this, but I would like to ask if you can give me a little guidance of where I should look for fixing this. I'm not sure I can, but I would like to try, as I am not the first with a "hanging VS" and I won't be the last, whether it's SRTP or not.
I would love to try to fix it, though I'm aware it may be an uphill climb.
abelbraaksma
on 10 Jun 2020
Perhaps you mean "don't use double-lookup SRTP" (or whatever the ^a and ^b syntax is called),
you mean "don't use it when the set is of overloads is large" (what is large?).
Let's call it double-barrelled SRTP.
I'd say for master today large is ~30 witnesses for double-barrelled SRTP once one of ^a or ^b is known. Double-barrelled SRTP is used in FSharp.Core for op_Addition etc., but in most applications of SRTP the number of witnesses narrows down quickly once ^a or ^b is known. In your case it remains at ~300 until both are known.
However there is no hard-and-fast rule and you should always be wary of non-standard uses of SRTP (i.e. things beyond the patterns we use in FSharp.Core). Fundamentally if you are using SRTP like this then you are doing type level programming. The compile-time operational characteristics of such programming always matter and people using things will always push things to the limits, just as they do in any other kind of programming. (We see the same thing with long compile-times of C++ template code, for example, or long resolutions for Haskell type classes to complex calculations in the type system - people will always drive things to the max). For any system offering anything like this there will be limits.
dsyme
on 10 Jun 2020
 brettfo
Looking at this again. I'd like to emphasise this: you should always be wary of non-standard uses of SRTP (i.e. things beyond the patterns we use in FSharp.Core and TaskBuilder.fs).
SRTP is crucial for F# in many ways, for overloaded arithmetic. However, if pushed too far (double-barrel, cascading constraints, large overload sets) it becomes a fragile and subtle mechanism w.r.t. performance, error messages and some corner-case glitches in resolution. People are pushing it to limits that are falling off one or more of these cliffs.
Just don't push the limits with SRTP. It's not worth it.
dsyme
on 3 Sep 2020
Related issues
cartermp
·
3Comments
 randrag
·
3Comments
randrag
·
3Comments
 viktorvan
·
3Comments
viktorvan
·
3Comments
 enricosada
·
3Comments
enricosada
·
3Comments
 smoothdeveloper
·
3Comments
smoothdeveloper
·
3Comments