Fsharp: Unacceptably slow solution load times
F# solutions that contain a relatively large number of projects (e.g. 100) that have a relatively large number of project references (approx 50 on average) take an age to load, even with Lightweight Solution Load enabled.
On my machine, "Preparing solution" takes over 6 minutes (I killed VS after this so I don't know how long it takes in full). Furthermore each project load takes several seconds. This is in stark contrast to C# solutions of the same size and with the same number of project references, which takes under a minute to load completely.
This issue is not specific to VS 2017, as the same issue occurs in VS 2015 (and most likely 2013 too). I tried to use dotTrace to analyse where all the time is being spent, but 96% of it is in "Stack traces without user methods". I'm not sure whether this means I don't have symbols for some modules, or whether the majority of the time is spent in native code.
Repro steps
I have attached a script to reproduce this issue.
- Download and extract the attached ZIP (see end of issue)
- Run
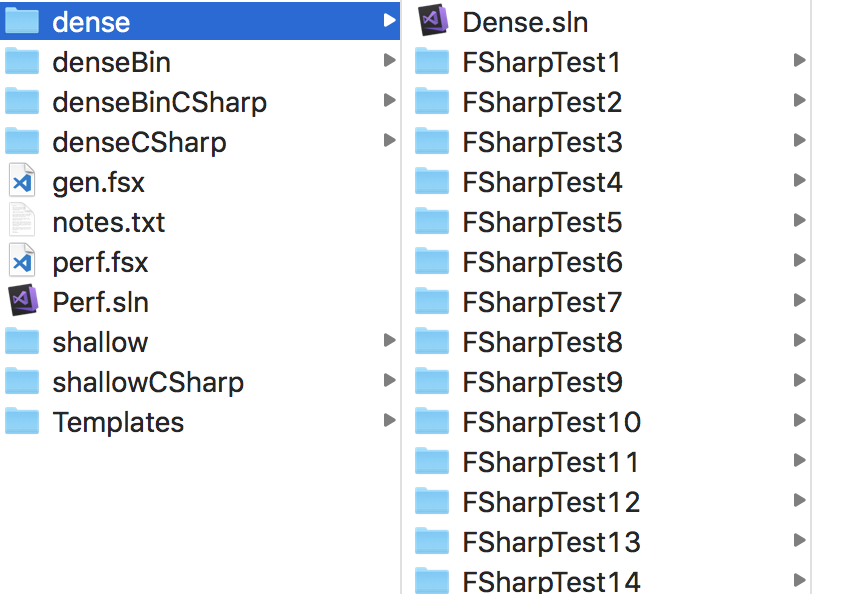
gen.fsx - Open
dense/Dense.slnin Visual Studio. This will load a large F# solution. - Compare the load times to
denseCSharp/Dense.sln.
Expected behavior
Similar performance to C#, as the projects contain no code or public interface to be analysed/type inferred.
Actual behavior
Painfully slow performance :(
Known workarounds
Use VS Code.
Related information
Provide any related information
- Operating system: Windows 10
- Branch: 2017 RC2
- Editing Tools (e.g. Visual Studio Version): 2017 RC2
- Links to performance testing scripts: Perf.zip
 saul
saul
All 77 comments
Try to profile with dotTrace in its "Timeline" mode.
 vasily-kirichenko
on 26 Dec 2016
vasily-kirichenko
on 26 Dec 2016
That's what I was using - there was a lot of Visual Studio stack traces but they amounted to <5% of the total time. I saw no FSharp stack traces so I assume they aren't being loaded for whatever reason.
saul
on 26 Dec 2016
I can recommend to build VFT from current master, then run an experimental VS instance and profile it, you'll be able to see the sources in dotTrace.
vasily-kirichenko
on 26 Dec 2016
Thanks - it looks like 99.5% of the time is being spent in FSharpProjectNode.ComputeSourcesAndFlags as a result of OnActiveProjectCfgChange.
This in turn invokes MSBuild to do a compile of the project (with actuallyBuild set to false - I'm not sure what this entails).
Do any of the F# developers mind shedding some light onto why this is necessary during startup, and whether there are any quick wins? This would drastically reduce load times for F# solutions. /cc @dsyme, @KevinRansom

saul
on 27 Dec 2016
@saul this is the same results I found when I was investigating huge pause after Ctrl+F5 on VFT solution, see the exact line and a big comment from @dsyme here https://github.com/Microsoft/visualfsharp/issues/2046#issuecomment-267831900
vasily-kirichenko
on 27 Dec 2016
Thanks - I'd already read that but I still have a few questions for @dsyme
- Why can't we use
ComputeCompileItemsto determine sources? - Why are the flags necessary to compute? Can't we use the same project file parsing logic instead of forking out to MSBuild (that does the same thing for us)?
- If we really have to do it this way, can we at least show a message box whilst it's in progress? There's many situations where this locks up the UI thread for a significant amount of time (e.g. changing solution configuration).
saul
on 27 Dec 2016
@saul, I'm not sure what is ComputeCompileItems you are mentioning, one thing though is that the files and assembly references (I guess the two main things in fsproj files) can be wrapped around conditionals that need to be evaluated to give accurate result; I'm sure you know about this.
That being said, if we could have a "dumb" but quick way of getting this info (just with a xpath query?), even with inaccuracies, and catch-up in the background for the accurate results without locking the UI, I think this would really help a lot.
 smoothdeveloper
on 27 Dec 2016
smoothdeveloper
on 27 Dec 2016
Please, read the @dsyme comment https://github.com/Microsoft/visualfsharp/blob/master/vsintegration/src/FSharp.ProjectSystem.FSharp/Project.fs#L1350-L1360
vasily-kirichenko
on 27 Dec 2016
There's no need to use naive logic to get around this @smoothdeveloper. We already have access to everything to calculate the sources and flags ourselves without going via MSBuild. Not to mention MSBuild has already evaluated our project file so there's no need to guess at conditionals.
Here's my current understanding of what's happening:
- At project load (and many other times such as changing solution configuration or adding files to the project),
ComputeSourcesAndFlagsis called. - This function invokes an MSBuild for the project with target
Compile. - The
Compiletarget is executed, which then executes the CoreCompile target which can be found in the Microsoft.FSharp.targets file. - This instantiates an Fsc (fsharpFSharp.BuildFsc.fs) task that calculates the compile flags and file sources, as defined in the project file.
- MSBuild executes this Fsc task, which reflectively calls the Compile method on FSharpProjectNode (vsintegrationsrcFSharp.ProjectSystemProject.fs)
- This Compile method then checks whether the compilation is as a result of ComputeSourcesAndFlags, in which case it simply stores the sources and flags and then bails without actually invoking FSC.
Here's my proposal for an alternative:
We are in full control of the sources array and the flags array - they are both calculated in FSharp.Build/Fsc.fs in ExecuteTool. There is no reason why we can't interrogate the BuildProject member in ComputeSourcesAndFlags: this.BuildProject.Targets["CoreCompile"].Tasks. We can then cast the ProjectTaskInstance to an Fsc instance and pull the sources and flags out then.
This completely removes the need to invoke a fake compilation with MSBuild, and we still have access to the evaluated values and so should function identically.
saul
on 27 Dec 2016
@vasily-kirichenko @saul Just to mention that's not my comment. The approach used dates from Visual Studio 2010, blame traces back to the initial import of the code into github
Not sure why "Compile" is used, it certainly looks wrong.
 dsyme
on 27 Dec 2016
dsyme
on 27 Dec 2016
Compile is the target that C# and VB use for their design-time builds to find out the options and references to the compiler as well. The new project system aims to make this asynchronous and non-blocking. In the meantime, you might running a diagnostic build and looking at the timings of the various tasks and targets that run to see if you can optimize them at all.
 Pilchie
on 27 Dec 2016
Pilchie
on 27 Dec 2016
@saul THe plan of attack you mention above sounds quite reasonable. Invoking MSBuild has always seemed spurious
dsyme
on 27 Dec 2016
Thanks @dsyme. Do you also have any idea as to why ComputeSourcesAndFlags is called twice for every project on configuration change (including at solution load)? There's a review comment that has the same concerns - this second call to ComputeSourcesAndFlags is the reason why "Preparing solution..." takes so long. I'd like to get that fix in for RTM if possible as it's a 50% solution load time win.
Also @pilchie - have you any idea where this is done in the C# project system? C# projects seem to load instantly which is in stark contrast to the F# project system.
saul
on 27 Dec 2016
@saul
Thanks @dsyme. Do you also have any idea as to why ComputeSourcesAndFlags is called twice for every project on configuration change (including at solution load)?
No, I don't, sorry
dsyme
on 27 Dec 2016
@saul the C# invocations are in the closed source C++ code for csproj.dll and msvbprj.dll for most projects. Note that this is skipped for C#/VB with Lightweight solution load enabled though.
@davkean might be able point out where it happens in the new project system.
Pilchie
on 27 Dec 2016
Some progress:
- I've added a wait indicator dialog to show when changing solution configuration, so the UI thread no longer freezes
- I've removed the extra ComputeSourcesAndFlags on OnAfterActiveSolutionCfgChange, halving the time it takes to update the solution configuration
- I've noticed that IVsUpdateSolutionEvents.OnActiveProjectCfgChange is called twice for each project on load, but I can't seem to figure out why. (The event listeners aren't being added twice.) Once I get to the bottom of this, the "Preparing Solution" stage of loading a solution should be twice as fast.
Here's the MSBuild output for a single ComputeSourcesAndFlags:
MSBuild: Target Performance Summary:
MSBuild:         0 ms  BeforeCompile                              1 calls
MSBuild:         0 ms  SetWin32ManifestProperties                 1 calls
MSBuild:         0 ms  BeforeResolveReferences                    1 calls
MSBuild:         0 ms  AfterResolveReferences                     1 calls
MSBuild:         0 ms  _AfterCompileWinFXInternal                 1 calls
MSBuild:         0 ms  _ComputeNonExistentFileProperty            1 calls
MSBuild:         0 ms  AfterCompile                               1 calls
MSBuild:         0 ms  PrepareProjectReferences                   1 calls
MSBuild:         0 ms  GetFrameworkPaths                          1 calls
MSBuild:         0 ms  ResolveReferences                          1 calls
MSBuild:         0 ms  AfterCompileWinFX                          1 calls
MSBuild:         1 ms  GetReferenceAssemblyPaths                  1 calls
MSBuild:         1 ms  DesignTimeXamlMarkupCompilation            1 calls
MSBuild:         1 ms  ResolveSDKReferences                       1 calls
MSBuild:         1 ms  _SetEmbeddedWin32ManifestProperties        1 calls
MSBuild:         1 ms  ExpandSDKReferences                        1 calls
MSBuild:         1 ms  Compile                                    1 calls
MSBuild:         2 ms  DesignTimeMarkupCompilation                1 calls
MSBuild:         2 ms  PrepareForBuild                            1 calls
MSBuild:         2 ms  GenerateTargetFrameworkMonikerAttribute    1 calls
MSBuild:         2 ms  ImplicitlyExpandDesignTimeFacades          1 calls
MSBuild:         2 ms  ResolveAssemblyReferences                  1 calls
MSBuild:         2 ms  GetTargetFrameworkProperties              68 calls
MSBuild:         4 ms  _GenerateCompileInputs                     1 calls
MSBuild:         4 ms  GetTargetPath                             68 calls
MSBuild:         4 ms  _SplitProjectReferencesByFileExistence     1 calls
MSBuild:         4 ms  AssignProjectConfiguration                 1 calls
MSBuild:         5 ms  _GenerateCompileDependencyCache            1 calls
MSBuild:         7 ms  CoreCompile                                1 calls
MSBuild:        23 ms  GetInstalledSDKLocations                   1 calls
MSBuild:     49632 ms  ResolveProjectReferences                   1 calls
MSBuild:     107337 ms  _GetProjectReferenceTargetFrameworkProperties  68 calls
MSBuild:
MSBuild: Task Performance Summary:
MSBuild:         0 ms  GetReferenceAssemblyPaths                  1 calls
MSBuild:         0 ms  Hash                                       1 calls
MSBuild:         0 ms  GetFrameworkPath                           1 calls
MSBuild:         0 ms  MakeDir                                    1 calls
MSBuild:         0 ms  FindAppConfigFile                          1 calls
MSBuild:         0 ms  CallTarget                                 1 calls
MSBuild:         0 ms  ResolveAssemblyReference                   1 calls
MSBuild:         1 ms  Fsc                                        1 calls
MSBuild:         2 ms  WriteLinesToFile                           1 calls
MSBuild:         4 ms  ResolveNonMSBuildProjectOutput             1 calls
MSBuild:         4 ms  AssignProjectConfiguration                 1 calls
MSBuild:     156729 ms  MSBuild                                   69 calls
Some questions:
- Any pointers on OnActiveProjectCfgChange being called twice?
- Why ResolveProjectReferences and _GetProjectReferenceTargetFrameworkProperties are taking so long?
saul
on 29 Dec 2016
I've noticed that IVsUpdateSolutionEvents.OnActiveProjectCfgChange is called twice for each project on load, but I can't seem to figure out why. (The event listeners aren't being added twice.) Once I get to the bottom of this, the "Preparing Solution" stage of loading a solution should be twice as fast.
My guess is that they are first changed to the first configuration in the project, and then changed to the one in the sln file or somthing like that.
Pilchie
on 30 Dec 2016
Tagging @AndyGerlicher for the question about the msbuild tasks.
Pilchie
on 30 Dec 2016
@Pilchie That could be the case. I've added callbacks for IVsUpdateSolutionEvents4 - now when OnActiveProjectCfgChangeBatchBegin is called, we only do ComputeSourcesAndFlags once per project per batch, which seems to solve the issue. I'll check to see what configuration is being used both times, as if your theory was correct, I'd expect OnActiveProjectCfgChange to be called in the order of: Project1, Project2, Project3, Project1, Project2, Project3 as opposed to Project1, Project1, Project2, Project2, Project3 as it is currently.
For what it's worth @AndyGerlicher - if you're reading this - the MSBuild diagnostic log that I posted in my previous comment is from Project70 that has a dependency on Project1 through Project69 (where ProjectN has a dependency on Project1 through ProjectN-1). It's an edge case for project references, but the thing that stumps me is the same dependency graph loads very quickly in C#, but takes many minutes (+10 mins) to load in F#, and it seems like most of the time is being spent in _GetProjectReferenceTargetFrameworkProperties. Any help is appreciated :)
saul
on 30 Dec 2016
@Pilchie - I've just taken a look at what the configuration is each time OnActiveProjectCfgChange is called, and for both of the two times it is called per project, the configuration is the same.
saul
on 30 Dec 2016
Done some more investigating on this issue and tried a few different avenues:
(Note all times are with _GetProjectReferenceTargetFrameworkProperties disabled and on a Debug build. With this task enabled, load times seem to nearly double to 04:10)
- Using "CoreCompile" instead of "Compile" target in ComputeSourcesAndFlags:
- 5 seconds on "Preparing Solution"
- This has the side effect of not resolving project references (the 2nd most costly target is ResolveProjectReferences)
- Disabling the _GetProjectReferenceTargetFrameworkProperties target in the project files:
- Reduces "Preparing Solution" time from 04:10 mins to 02:10 mins
- Setting BuildingProject global MSBuild property to false has no effect
- Disabling the _ResolveReferenceDependencies global property has no effect
- Enabled: 02:10 mins on "Preparing Solution"
- Disabled: 02:10 mins on "Preparing Solution"
It seems there's no silver bullet. I've raised Microsoft/msbuild#1510 in the hopes that someone more intimately knowledgeable on MSBuild can weigh, but it looks like improving the speed of ResolveProjectReferences and _GetProjectReferenceTargetFrameworkProperties will have the greatest effect. Also it would be useful to see know C# and VB.NET compute sources and references so quickly.
saul
on 2 Jan 2017
Also it would be useful to see know C# and VB.NET compute sources and references so quickly.
Two things on this point:
- You can see what msbuild targets run by following the instructions for diagnosing design time build issues here
- C# and VB cache the results in the .suo file after the first project load and avoid running msbuild again on each project load.
Pilchie
on 3 Jan 2017
Hi @AndyGerlicher - any chance you could take a look at this? I'd love to have this resolved properly by VS 2017 RTM :)
saul
on 5 Jan 2017
Tagging this for VS 2017 Updates - although if something could get in for RTM, that would also be swell.
 cartermp
on 6 Jan 2017
cartermp
on 6 Jan 2017
Definetly RTM!
 forki
on 6 Jan 2017
forki
on 6 Jan 2017
@forki - with the PR that got merged the other day it reduces the "Preparing solution..." load time for Dense.sln from 3:45 mins to under 2 mins on my desktop machine (nearly twice as fast).
I expect the remaining improvements to come from improving the performance of the design-time MSBuild tasks. Further speed improvements could also come from parallelising ComputeSourcesAndFlags, which I've tried but MSBuild seems to hate being called on different threads :/
saul
on 6 Jan 2017
@saul very unlikely to make VS 2017. there is practically no time left before we hit escrow. However .. Update 1 is decent goal.
 KevinRansom
on 6 Jan 2017
KevinRansom
on 6 Jan 2017
Ah I misread. Thought this one was the thing that was already ready. Sorry
forki
on 6 Jan 2017
@saul Would you say this could be closed given that your work is now available in nightlies?
cartermp
on 16 Mar 2017
@cartermp unfortunately not. I believe there have been other regressions in our solution load performance - it's even worse than 2015 now. This is making the 2017 upgrade impossible for us at work :( However I'm under the impression that in a few weeks I'll have 2/3 weeks timeboxed to work on this full time in the office, so don't close it just yet :)
saul
on 17 Mar 2017
I confirm that my solution at work is loaded slower in VS 2017 than in VS 2015. However, switching between configurations (debug <-> release) is faster in VS 2017.
vasily-kirichenko
on 17 Mar 2017
I profiled it again and it's no surprise that 98% of load time is spent in MSBuild. Even doing "msbuild /t ResolveReferences" on a large project can take minutes - we're definitely doing something different than C# here.
saul
on 17 Mar 2017
@saul I don't think it's worth to spend time on fixing current project system because we are waiting https://github.com/dotnet/roslyn-project-system/pull/1670 to complete (yes, it seems everybody is waiting that somebody else finish it, but it's a different issue).
vasily-kirichenko
on 17 Mar 2017
Yeah I'm well aware of F# on Roslyn Project System, but I'd rather get this fixed now so we can use it now as opposed to waiting an indeterminate time to use an untested project system.
saul
on 17 Mar 2017
@saul after reading comments on that issue carefully I agree that a lot of work left there and nobody is gonna do it.
How are you going to optimize the current project system's load time as it just call msbuild? AFAIK everything we can do is to check that it's not called more that once for each project.
vasily-kirichenko
on 17 Mar 2017
I'm going to compare how ResolveReferences works for C# vs F# - it's super quick (seconds) for C# but takes minutes for large projects for F#. I believe there's some optimisation we're missing here, or the fact that we're clearing some MSBuild cache when we do OnActiveProjectCfgChange.
saul
on 17 Mar 2017
@saul given some of the fairly recent work, would you say this has improved over vs2015 load times for you?
cartermp
on 5 Jun 2017
@cartermp, it's distinctly worse. For a 450 project solution (mixture of C# and F#), I see the following:
Timed from clicking solution path in 'Recent'

=== Visual Studio 2015 ===
'Loading projects' completed at 0:52 mins
'Preparing solution' completed at 5:23 mins
Solution Explorer visible at 6:00 mins
UI responsive at 7:15 mins

=== Visual Studio 2017 ===
'Loading projects' completed at 1:24 mins
'Preparing solution' dialog did not appear
"Updating sources and flags" completed at 13:10 mins
UI responsive at 15:00 mins
It looks like VS 2017 is twice as slow. After the solution loaded, I saw a lot of "Updating sources and flags" dialogs that may be a result of @dsyme's latest PR to solution loading performance.
saul
on 15 Jun 2017
Yikes, that's not good at all 😕
cartermp
on 15 Jun 2017
@saul it would be interesting to know how fast Rider at loading your solution.
vasily-kirichenko
on 15 Jun 2017
As it loads projects asynchronously it's basically instant. We absolutely need lightweight solution load support in F# @cartermp
saul
on 15 Jun 2017
@Saul When you are testing VS2015 and VS2017, are you testing first open or subsequent opens? These two go down different paths (the later will turn on Async load - assuming you are not in our A/B test to turn it off).
 davkean
on 16 Jun 2017
davkean
on 16 Jun 2017
The other thing, now that I've read above - on subsequent opens the legacy C#/VB project system skip the initial design-time build (call to Compile) and instead read from a cache.
davkean
on 16 Jun 2017
After the solution loaded, I saw a lot of "Updating sources and flags" dialogs ...
I think that's not a perf hit (though it is a UI mistake in dialog up/down logic)
dsyme
on 19 Jun 2017
I'm not convinced - it took twice as long to open in VS 2017 and I'm pretty confident before the PR to improve performance it wasn't that slow :(
saul
on 19 Jun 2017
@saul Yes, sorry, I only meant the bit about "sources and flags dialog". I edited after I posted. The actual load-time regression is real.
dsyme
on 19 Jun 2017
@saul If you get a chance you might check VS2015 v VS2017 load time on some of testsprojectsstress... and dump the figures here. That will likely give us independent confirmation. If not we should add another stress solution with the right characteristics
dsyme
on 19 Jun 2017
@saul Could you try with https://github.com/Microsoft/visualfsharp/pull/3238/?
In particular this line appears to have made a pretty dramatic difference when loading tests\projects\stress\huge\dense\Dense.sln
For C:GitHubdsymevisualfsharptestsprojectsstresshugedenseDense.sln
VS2015 : 130 seconds CPU to first editing
VS2017 42 seconds CPU to first editing
For C:GitHubdsymevisualfsharptestsprojectsstressbigdenseDense.sln
VS2015 : 30 seconds CPU to first editing
VS2017 21 seconds CPU to first editing
dsyme
on 22 Jun 2017
I'll test this too.
 realvictorprm
on 22 Jun 2017
realvictorprm
on 22 Jun 2017
@dsyme that sounds fantastic :) Unfortunately I can't build the tools at work, but once it's merged I can try it out.
saul
on 22 Jun 2017
@dsyme that sounds fantastic :) Unfortunately I can't build the tools at work, but once it's merged I can try it out.
There are a lot of variables here so I'm only cautiously optimistic. If it doesn't work then let's make a synthetic repro project that captures your characteristics better and reveals the regression
dsyme
on 22 Jun 2017
@realvictorprm Thanks, it would be great if you can test this
@saul I'm going to close this now #3238 has been pulled, but please reopen (or open a new bug) if your load times are still regressed from VS2015
dsyme
on 23 Jun 2017
@cartermp Re discussion in #3267 - I can confirm the solution loading performance problem seems to be back, see also https://github.com/Microsoft/visualfsharp/issues/2107#issuecomment-310244542
dsyme
on 16 Aug 2017
Note these perf problems seem to go away if you turn off in-memory cross-project references, "Options -> Text Editor -> F# -> Performance"
dsyme
on 16 Aug 2017
@saul It would be great if you could validate this as well. I think the long-term thing here is to:
(a) Find some heuristic to apply to in-memory cross-project references so it doesn't re-check the world.
(b) Work with the lightweight solution load team to get LSL fully supporting F# projects.
Both are likely to be efforts with a long tail of work, though I suspect that (a) may be easier and/or could be done incrementally.
cartermp
on 16 Aug 2017
@cartermp I checked the timings again to first editing
For C:GitHubdsymevisualfsharptestsprojectsstressbigdenseDense.sln
VS2015 : 30sec CPU
VS2017 15.3 + master:  42sec CPU
For C:GitHubdsymevisualfsharptestsprojectsstresshugedenseDense.sln
VS2015 : 130sec CPU
VS2017 15.3 + master: 250sec CPU
VS2017 15.3 + master + https://github.com/Microsoft/visualfsharp/pull/3499/: 220sec CPU
VS2017 15.3 + master + https://github.com/Microsoft/visualfsharp/pull/3499/ + forceUpdate=false: 200sec
VS2017 15.3 + master + https://github.com/Microsoft/visualfsharp/pull/3499/ + forceUpdate=false + setup-referenced-assemblies-before-actual-assembly: 250sec CPU
These are still ~1.3-2x as slow as VS2015 but are not some of the catastrophic times were were seeing earlier in this bug report.
dsyme
on 18 Aug 2017
@dsyme Is this with in-memory cross-project references turned on, or off?
cartermp
on 18 Aug 2017
@dsyme Is this with in-memory cross-project references turned on, or off?
on
I checked project load performance with the option off and it didn't make much difference to load time, (but does make a difference to memory consumption)
dsyme
on 18 Aug 2017
Makes sense.
cartermp
on 18 Aug 2017
See here: https://github.com/Microsoft/visualfsharp/issues/2320#issuecomment-336345411
LSL is to be deprecated, so my previous statements about getting LSL support in for F# are also deprecated.
cartermp
on 13 Oct 2017
I think this ticket is more about the performance regression around solution loading. Further I still think it’d be useful to backport whatever performance fixes that were implemented for .Net Core - a lot of companies have huge F# codebases that aren’t going to be migrated to Core any time soon. I’m happy to do this performance work still as it’s biting me daily. An alternative would be to port all desktop projects to use the new Roslyn project system (instead of it just being for Core projects)
saul
on 13 Oct 2017
Yes I think that's what the F# team is recommending for the future. To port
all projects to sdk and compile against net451 or whatever you have
Am 13.10.2017 08:57 schrieb "Saul Rennison" notifications@github.com:
I think this ticket is more about the performance regression around
solution loading. Further I still think it’d be useful to backport whatever
performance fixes that were implemented for .Net Core - a lot of companies
have huge F# codebases that aren’t going to be migrated to Core any time
soon. I’m happy to do this performance work still as it’s biting me daily.
An alternative would be to port all desktop projects to use the new Roslyn
project system (instead of it just being for Core projects)—
You are receiving this because you were mentioned.
Reply to this email directly, view it on GitHub
https://github.com/Microsoft/visualfsharp/issues/2107#issuecomment-336367275,
or mute the thread
https://github.com/notifications/unsubscribe-auth/AADgNBH7GAHgep3qTBcFwvgYaz8ctVNmks5srwnMgaJpZM4LVuyp
.
forki
on 13 Oct 2017
In the long run, that new project system will "absorb" existing .NET Framework projects as well. F# is in a good position to do that, since our current project system is entirely managed, as opposed to C# and VB. There will be a long set of improvements to MSBuild and NuGet that can help the current project system, but no solution load-specific improvements will be ported over by us. I think it will be extremely difficult and time-consuming to try and port over those improvements, and probably impossible given that a lot of it is going to happen in CPS, which we do not use.
cartermp
on 13 Oct 2017
@blackholeearth your comment is neither on topic nor is it appreciated. Please refrain from that behavior in the future.
cartermp
on 16 Feb 2018
@cartermp I consider this as Spam.
Anyways any updates on solution load time? Just to keep track of changes and or news :)
realvictorprm
on 16 Feb 2018
There are no updates for the legacy project system to share: many perf improvements have gone into the CPS-based project system, and that is likely to be the vehicle for future improvements. We've spent the bulk of our time there to ensure the experience meet table stakes w.r.t file ordering and folder support, and may spend some more time there if it's needed.
However, we're going to likely spend more time on stability and perf within our own tools after 15.6 ships. There are numerous improvements, particular around a compiler server and generating reference assemblies, that we can focus on to make IDE perf a lot better. We'll be investigating and likely implementing such things in the coming months.
cartermp
on 16 Feb 2018
I'll close this - it's a very old issue now and considerable progress was made
dsyme
on 13 May 2018
Opening Huge/Dense.sln in VS 2015 Update 3 takes 02:00 minutes to get to a fully working editor. After the "Preparing Solution" progress dialog closes, it's basically ready to use.
In Visual Studio 15.7.1 with the nightly tools - same machine, same solution:
00:36 minutes in, the Solution Explorer appears (and is populated). The 'Preparing Solution' dialog stays open.
08:16 minutes in, the 'Preparing Solution' dialog closes so I can now edit the source files. The UI is semi-responsive, syntax colourisation is not updating.
08:53 minutes in, the colourisation is updating in real-time as you'd expect.
I've got a feeling that we've regressed on the 'compute sources and flags' again, and that we're calling this too often on load again.
This is on an 8 core, 32GB RAM server with SSD - I dread to think what this is like on my dual core laptop.
So really, we've gone from 2 minutes in VS 2015, which is already really slow, to nearly 9 minutes in the latest tools 😢
saul
on 13 May 2018
@Saul do you have other projects where you could test whether the newest tools or the old ones are faster? Just curious
realvictorprm
on 13 May 2018
@saul where can Huge/Dense.sln be found? gen.fsx does not generate such folder:
vasily-kirichenko
on 13 May 2018
@vasily-kirichenko visualfsharp\tests\projects\stress\huge\dense\Dense.sln
saul
on 13 May 2018
@saul Let's open a new issue to track this so that we don't lose track of it.
davkean
on 13 May 2018
@tihan @davkean @davkean I'm curious about what the result of running the modified script for .NET SDK style projects looks. If it's a lot better, it may be worth modifying a converter project (e.g., @srivatsn's) for F# and working on it a bit so that we can recommend people convert.
The only recent change to the legacy F# project system was enabling design-time builds, and our measurement showed a slight decrease in project load times. So it would be strange if there was a regression here compared with a few months ago.
cartermp
on 13 May 2018
@cartermp So I've just tried @TIHan's updated generation script, and the Dense (100 project) solution loaded really quickly - in about 10 seconds to get to a responsive editor.
I could see that the projects were moving around/refreshing in the Solution Explorer (some projects had 'Dependencies' nodes, some didn't). After about 5 seconds, the UI completely locked up and 5 minutes later I still can't use it (it's 'Not Responding').
saul
on 13 May 2018
K, that will be the following:
- Load projects (sync)
- Kick off design-time (async)
- When design-time build results arrive, process language-service data (sync on UI thread)
Dependencies node issue is known and will because we can't catch the UI thread due to too much work done on it.
davkean
on 14 May 2018
I'll reopen though let's just start a new issue for this please then close this. 20 pages of comments makes it hard to see the state of play :)
dsyme
on 14 May 2018
Created a newer and updated issue here so that 20 pages of comments don't get in the way of the current state of things.
cartermp
on 14 May 2018
Related issues
 Tarmil
·
4Comments
Tarmil
·
4Comments
 enricosada
·
3Comments
vasily-kirichenko
·
3Comments
enricosada
·
3Comments
vasily-kirichenko
·
3Comments
 drguildo
·
3Comments
drguildo
·
3Comments
 mrakgr
·
3Comments
mrakgr
·
3Comments
Most helpful comment
There's no need to use naive logic to get around this @smoothdeveloper. We already have access to everything to calculate the sources and flags ourselves without going via MSBuild. Not to mention MSBuild has already evaluated our project file so there's no need to guess at conditionals.
Here's my current understanding of what's happening:
ComputeSourcesAndFlagsis called.Compile.Compiletarget is executed, which then executes the CoreCompile target which can be found in the Microsoft.FSharp.targets file.Here's my proposal for an alternative:
We are in full control of the sources array and the flags array - they are both calculated in FSharp.Build/Fsc.fs in
ExecuteTool. There is no reason why we can't interrogate the BuildProject member in ComputeSourcesAndFlags:this.BuildProject.Targets["CoreCompile"].Tasks. We can then cast the ProjectTaskInstance to an Fsc instance and pull the sources and flags out then.This completely removes the need to invoke a fake compilation with MSBuild, and we still have access to the evaluated values and so should function identically.