Frontend: websocket - does not manage connections?
Checklist
- [X] I have updated to the latest available Home Assistant version.
- [X] I have cleared the cache of my browser.
- [X] I have tried a different browser to see if it is related to my browser.
The problem
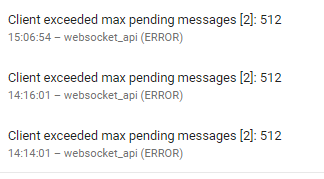
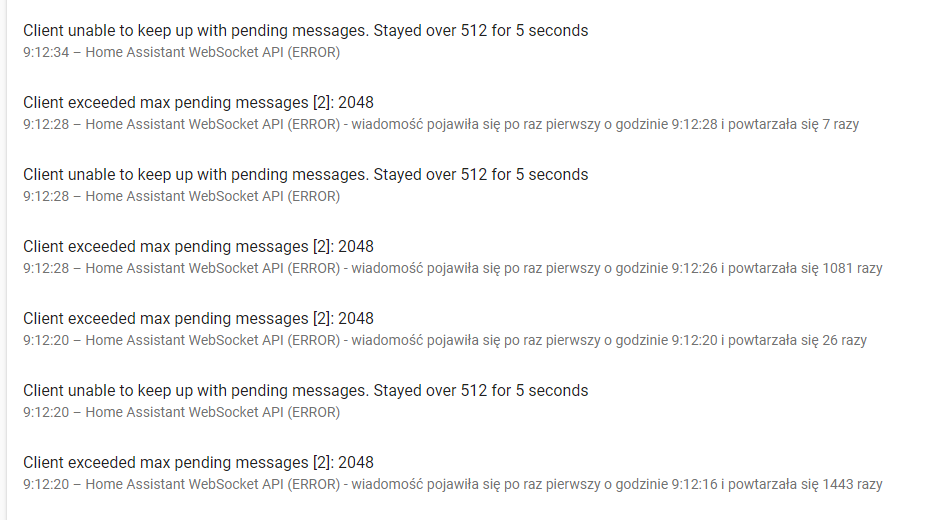
There's an issue linked to issue https://github.com/home-assistant/core/issues/23938 - when some browser is left unrefreshed (at least what I've encountered, but I know someone who doesn't have unfrefreshed page and have same issue), there is tons of messages in LOG appearing:
ERROR (MainThread) [homeassistant.components.websocket_api.http.connection.xxxx] Client exceeded max pending messages [2]: 512
making high CPU usage instantly.
I've tried to debug why is that happening and:
- restart of HA
- reboot of machine
doesn't help.
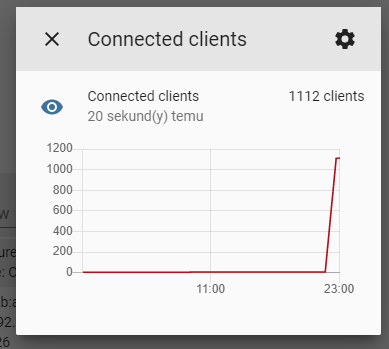
I've also added websocket sensor (according to docs) to see how many connection HA has to handle. The sensor graph looks like this:
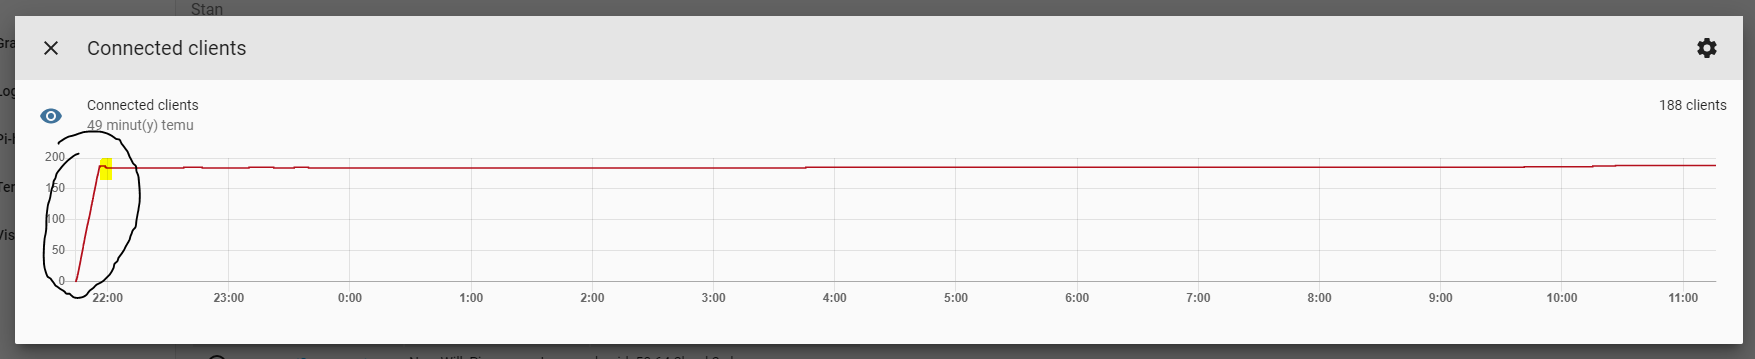
The spike going up is the moment when problem was shown in logs for around 30 minutes - the number of connections went straight up to ~180.
After I've restarted last machine with browser/HA opened, the number of connections didn't go up.
But neither it went down... It seems like HA/websocket is not handling those connection that doesn't do anything or are left somehow unmanaged.
Expected behavior
Close connections that are not served as they should or are not needed anymore.
They didn't disappear after closing of browser that caused problems.
Steps to reproduce
Open HA on browser and left it unattended for longer, while having i.e. graphs that updates themselves in regular intervals.
Environment
arch | x86_64
-- | --
dev | false
docker | true
hassio | true
os_name | Linux
os_version | 4.19.0-8-amd64
python_version | 3.7.7
timezone | Europe/Warsaw
version | 0.107.5
virtualenv | false
- Home Assistant release with the issue: 0.107.5 (latest at the moment)
- Last working Home Assistant release (if known): have seen such errors previously
- Browser and browser version: Chrome
- Operating system: Windows (browser) / Debian (HA)
Problem-relevant configuration
n/a
Javascript errors shown in your browser console/inspector
n/a, didn't catch
Additional information
 andriej
All 64 comments
Do you have any custom cards/custom components?
 bramkragten
on 24 Mar 2020
bramkragten
on 24 Mar 2020
I do, but nothing fancy: xiaomi vacuum card, bom weather card, custom header, mini graph card, mini media player, restriction card, slider entity row
The problem is when lovelace content changes, so either it's sensor graph update interval or changed layout of lovelace cards, not customs itself.
I've encountered this problem earlier, but it went out for a longer time until now - when I've added update (refresh) interval to lovelace sensor card.
andriej
on 24 Mar 2020
Our sensor card uses the REST API and not WebSockets, and we don't create new connections...
Could you try to reproduce it without any custom cards?
bramkragten
on 24 Mar 2020
I've tried to repoduce it just before the issue without success, so my assumption may be wrong.
Still I've decided to open issue, as (at least in my opinion, correct me if I'm wrong) - HA/websocket should manage such situation and kill those connection without destroying machine performance.
There are so much log writes that every automation is delayed for 5-6 seconds and I'm running it on a'la NUC machine...
andriej
on 24 Mar 2020
I have the same errors. A lot of them.
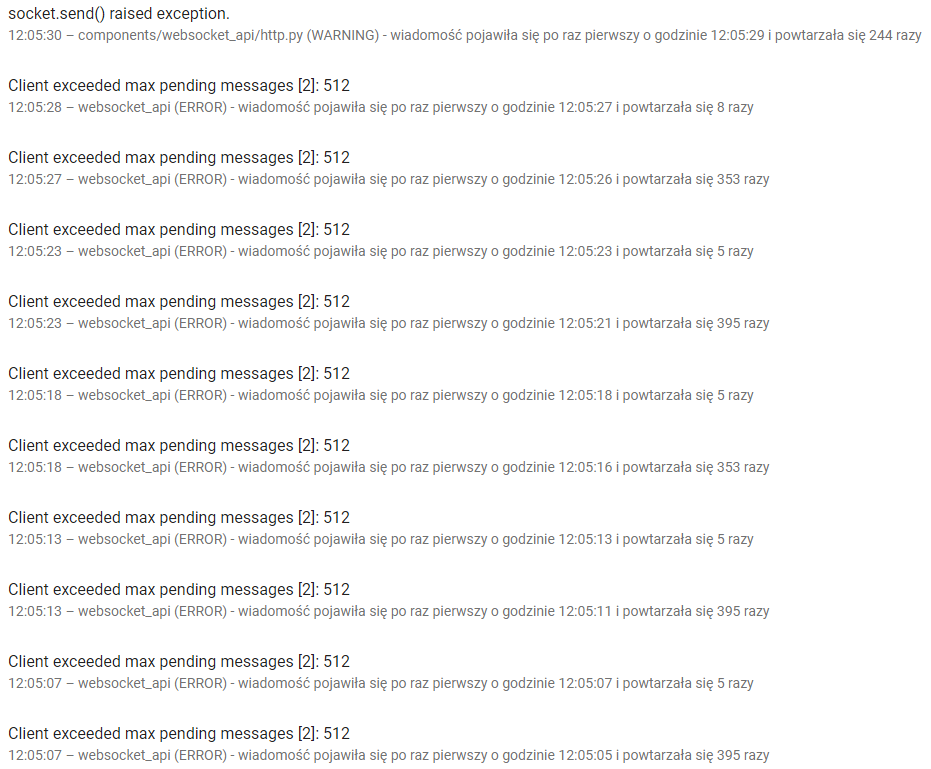
2020-03-24 12:05:27 ERROR (MainThread) [homeassistant.components.websocket_api.http.connection.1488524848] Client exceeded max pending messages [2]: 512
2020-03-24 12:05:27 ERROR (MainThread) [homeassistant.components.websocket_api.http.connection.1488524848] Client exceeded max pending messages [2]: 512
2020-03-24 12:05:27 ERROR (MainThread) [homeassistant.components.websocket_api.http.connection.1488524848] Client exceeded max pending messages [2]: 512
2020-03-24 12:05:27 ERROR (MainThread) [homeassistant.components.websocket_api.http.connection.1488524848] Client exceeded max pending messages [2]: 512
2020-03-24 12:05:27 ERROR (MainThread) [homeassistant.components.websocket_api.http.connection.1488524848] Client exceeded max pending messages [2]: 512
2020-03-24 12:05:27 ERROR (MainThread) [homeassistant.components.websocket_api.http.connection.1488524848] Client exceeded max pending messages [2]: 512
2020-03-24 12:05:27 ERROR (MainThread) [homeassistant.components.websocket_api.http.connection.1488524848] Client exceeded max pending messages [2]: 512
2020-03-24 12:05:27 ERROR (MainThread) [homeassistant.components.websocket_api.http.connection.1488524848] Client exceeded max pending messages [2]: 512
2020-03-24 12:05:27 ERROR (MainThread) [homeassistant.components.websocket_api.http.connection.1488524848] Client exceeded max pending messages [2]: 512
2020-03-24 12:05:27 ERROR (MainThread) [homeassistant.components.websocket_api.http.connection.1488524848] Client exceeded max pending messages [2]: 512
2020-03-24 12:05:27 ERROR (MainThread) [homeassistant.components.websocket_api.http.connection.1488524848] Client exceeded max pending messages [2]: 512
2020-03-24 12:05:28 ERROR (MainThread) [homeassistant.components.websocket_api.http.connection.1488524848] Client exceeded max pending messages [2]: 512
2020-03-24 12:05:29 WARNING (MainThread) [asyncio] socket.send() raised exception.
2020-03-24 12:05:29 WARNING (MainThread) [asyncio] socket.send() raised exception.
2020-03-24 12:05:29 WARNING (MainThread) [asyncio] socket.send() raised exception.
2020-03-24 12:05:29 WARNING (MainThread) [asyncio] socket.send() raised exception.
2020-03-24 12:05:29 WARNING (MainThread) [asyncio] socket.send() raised exception.
2020-03-24 12:05:29 WARNING (MainThread) [asyncio] socket.send() raised exception.
2020-03-24 12:05:29 WARNING (MainThread) [asyncio] socket.send() raised exception.
2020-03-24 12:05:29 WARNING (MainThread) [asyncio] socket.send() raised exception.
2020-03-24 12:05:29 WARNING (MainThread) [asyncio] socket.send() raised exception.
2020-03-24 12:05:29 WARNING (MainThread) [asyncio] socket.send() raised exception.
2020-03-24 12:05:29 WARNING (MainThread) [asyncio] socket.send() raised exception.
2020-03-24 12:05:29 WARNING (MainThread) [asyncio] socket.send() raised exception
Errors began with HA 0.106, previously they were not there. Any hint how to debug them?
 bieniu
on 24 Mar 2020
bramkragten
on 24 Mar 2020
bieniu
on 24 Mar 2020
bramkragten
on 24 Mar 2020
@bramkragten please reopen
andriej
on 24 Mar 2020
Same problem here. Tons of errors under Chrome so it's not browser specific.
 ercsey
on 25 Mar 2020
ercsey
on 25 Mar 2020
Today I've left HA open by a mistake and after a while everything lagged as hell.
I came back to PC and...:
guess on what hour problem happened and look at the amount of connections.
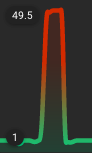
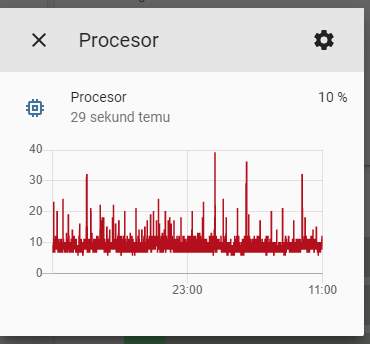
My disk is being killed with amount of writes in logfile, so is CPU usage showing the problem:
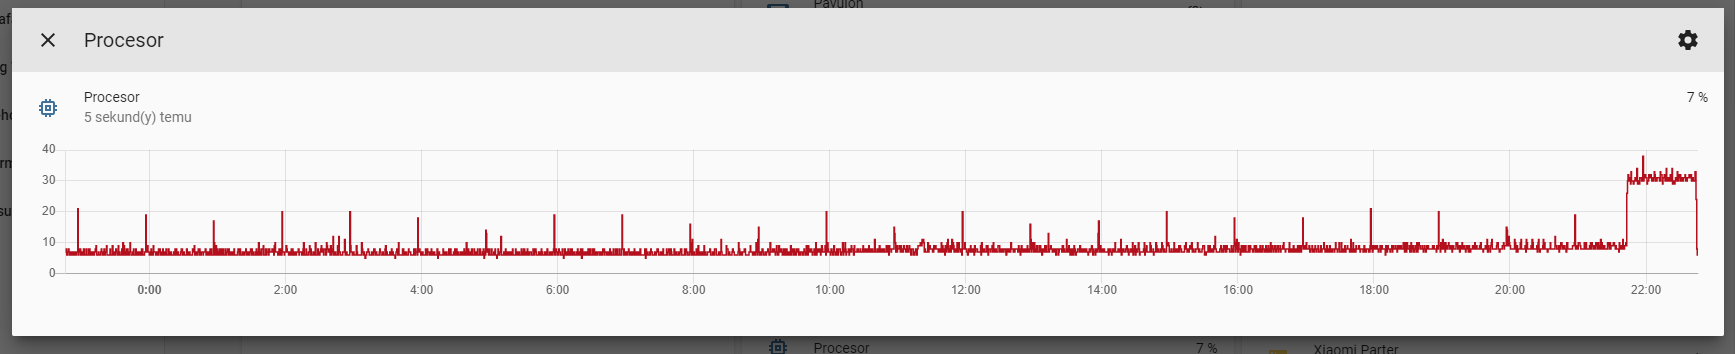
There is some serious issue going in backend/frontend not managing the situation (whatever is causing it)...
And the clue of the issue - I've closed browser, everything (CPU usage and no more errors in log) went back to normal, EXCEPT:
andriej
on 25 Mar 2020
Anyone of you have Node RED running ?
 balloob
on 26 Mar 2020
balloob
on 26 Mar 2020
No Node RED install at me.
ercsey
on 26 Mar 2020
I don't use Node-red.
bieniu
on 26 Mar 2020
So step 1 is to try to reproduce this without any custom cards, integrations or have any apps hitting Home Assistant.
Somewhere something is leaking connections and not closing them
balloob
on 26 Mar 2020
No node-red on my side.
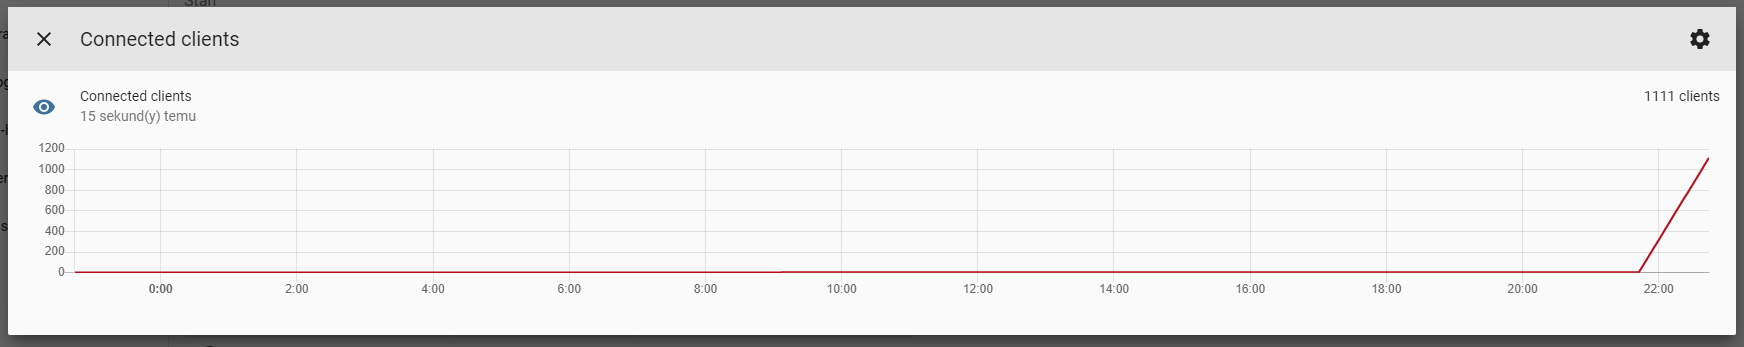
Issue, even when is generated by some custom card - why (after resolving the 'problem' = closing the browser with hanged websocket) it's not further managed in HA and is still present?
I don't have problem since yesterday, thus 1115 active connections (and HA is not hanged right now so they are just alive somewhere without making performance drop):
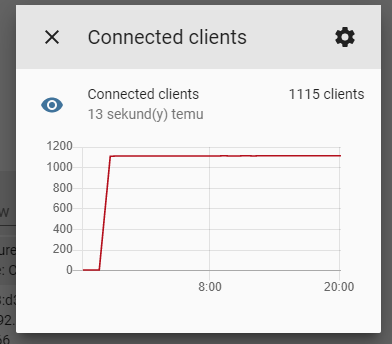
I have auto-entities and custom header which are using websockets as I've found in JS.
From my perspective one thing is to find and probably remove problematic custom card but secondly HA should somehow prevent such situations (I mean: leaving browser with card open is high probability in future using some new custom cards or built in ones)
andriej
on 26 Mar 2020
Hi, I'm using HA android client. And this is permanently active in background. It's not only chrome or any other web browser, the mobile solution is causing these errors as well. Still active with 107.7
 Pirol62
on 30 Mar 2020
Pirol62
on 30 Mar 2020
@Pirol62 android app uses webview, thus chrome engine.
What custom cards in lovelace you are using? Maybe it would be helpful to make such list.
andriej
on 30 Mar 2020
@andriej Here we go:
Plugins:
- Button Card
- Calendar card
- Custom Header
- Lovelace Swipe navigation
- Simple Thermostat
- Travel Time Card
- Multiple Entity row
- fold entity row
- Mini Graph Card
- simple weather card (already uninstalled - not used)
Integrations
- Alexa media player
- config check
- Hacs
- Google GeoCode
- Orbit BHyve
- variable
Bythe way: The last four cards have beed added during the last two weeks. The issue is much older.
Pirol62
on 30 Mar 2020
This started happening for me in 0.105.0 and wasn't a problem in previous versions. Now it happens all the time and I have to go hunt down the machine that has a stale HA window open. I have the following custom cards, but haven't yet done a binary search to identify which one or ones may be causing it:
- url: /hacsfiles/lovelace-hass-aarlo/hass-aarlo.js
- url: /hacsfiles/weather-card/weather-card.js
- url: /hacsfiles/lovelace-card-tools/card-tools.js
- url: /hacsfiles/lovelace-fold-entity-row/fold-entity-row.js
- url: /hacsfiles/upcoming-media-card/upcoming-media-card.js
- url: /hacsfiles/mini-graph-card/mini-graph-card-bundle.js
- url: /hacsfiles/lovelace-card-mod/card-mod.js
- url: /hacsfiles/custom-header/custom-header.js
- url: /hacsfiles/lovelace-auto-entities/auto-entities.js
 rccoleman
on 2 Apr 2020
rccoleman
on 2 Apr 2020
I'm really shure, that the android companion app is causing these messages:
At this time, I opened exactly a few minutes before Home Assistant on 3 different devices in order to set a new device name and then I put these devices back into the loading station. I think, that the devices send too much requests and couldn't acknowlede or something similar. I do have 2 more devices, acting as displays. They are always active and so they do not causing unresponded update requests.
PS: Just to clearify: Not the compamion app itself but mobile apps using the common interface. I never had these messages, when my Desktop Chrome was in use.
Pirol62
on 2 Apr 2020
@Pirol62 in your case, that could happen indeed if the app's webview in the background keeps the connection open but doesn't process JavaScript to read those messages. Captured that here https://github.com/home-assistant/home-assistant-android/issues/542
balloob
on 2 Apr 2020
I don't know if this is being actively looked at but I too am having the problem.
I do not use Node Red
I use Google Chrome browser
I do use the Android app on two phones.
I do have a lot of custom cards
This afternoon I came back to my PC to find that my log is 175 MB!!!

 kloggy
on 11 Apr 2020
kloggy
on 11 Apr 2020
This issue continues to make HA completely unusable. I'm using Chrome browser and the iOS app to access. Never used Node Red but I also have several custom cards. Still seems like HA should be able to manage this issue better even if it is being generated from one of the cards.
 cratermaddie
on 14 Apr 2020
cratermaddie
on 14 Apr 2020
This came back for me recently - 85mb log and growing.
 timdonovanuk
on 15 Apr 2020
timdonovanuk
on 15 Apr 2020
After couple of testings this is the result what I've found out. I'm mentioning that I'm not using node red at all (not installed), I have couple of phones using the HA app and other apps as well. Those integrations were not deleted.
- Home Assistant 0.108.4
- card-mod version 13
So I've come to the conclusion that the problem comes from card-mod. After commenting out from the resources, cleared the browser cache and reloaded the page the issue is gone. I'm using HA for about 24 hours without card-mod and not a single Client exceeded max pending messages [2]: 512 error. Please somebody can confirm if that's the problem.
After putting back card-mod to the resources the problem comes back instantly.
Thank you.
ercsey
on 15 Apr 2020
@ercsey I don't use card-mod, but suspicious go to card-tools too
andriej
on 15 Apr 2020
I've taken out card-tools from the resources. I have no card-tools in resources.
ercsey
on 15 Apr 2020
@kloggy please could you try to remove card-mod from your resources, clear the browser cache and see if the problem persists?
ercsey
on 15 Apr 2020
I can confirm I am using card-mod too!
timdonovanuk
on 15 Apr 2020
Also using card-mod here too
cratermaddie
on 15 Apr 2020
@cratermaddie @timdonovanuk ok you are using card-mod but after removing card-mod, clearing the browser cache, and reloading the browser page do you still have this error? Client exceeded max pending messages [2]: 512
ercsey
on 15 Apr 2020
I'm not using card-mod either.
The only resources I have are:
auto-entities.js
bar-card.js
multiple-entity-row.js
restriction-card.js
 electrofloat
on 15 Apr 2020
electrofloat
on 15 Apr 2020
@electrofloat auto-entities uses card-tools
 iantrich
on 15 Apr 2020
iantrich
on 15 Apr 2020
Semi-related to this. In 109 I introduced a new feature https://github.com/home-assistant/core/pull/34175 that allows the WebSocket queue to temporarily peak over 512 pending messages for up to 5 seconds. This allows clients to catch up if they have a hiccup or if an integration adds a lot of entities/causes a lot of events at once.
balloob
on 15 Apr 2020
I reported #5522 9 days ago and was just directed to this one from the forum, I think that other one should probably be closed as a duplicate of this one as it sounds the same.
This morning I also woke up to a stream of this in my logs starting about an hour after I went to sleep and running through the night:
2020-04-20 11:59:52 ERROR (MainThread) [homeassistant.components.websocket_api.http.connection.2755931280] Client exceeded max pending messages [2]: 512
2020-04-20 11:59:52 ERROR (MainThread) [homeassistant.components.websocket_api.http.connection.2755931280] Client exceeded max pending messages [2]: 512
2020-04-20 11:59:52 ERROR (MainThread) [homeassistant.components.websocket_api.http.connection.2755931280] Client exceeded max pending messages [2]: 512
Also when I opened up the logs for the homeassistant container in portainer I saw an equally long stream of these messages:
/usr/local/lib/python3.7/site-packages/zeroconf/__init__.py:1580: DeprecationWarning: ServiceInfo.address is deprecated, use addresses instead
  warnings.warn("ServiceInfo.address is deprecated, use addresses instead", DeprecationWarning)
/usr/local/lib/python3.7/site-packages/zeroconf/__init__.py:1580: DeprecationWarning: ServiceInfo.address is deprecated, use addresses instead
  warnings.warn("ServiceInfo.address is deprecated, use addresses instead", DeprecationWarning)
/usr/local/lib/python3.7/site-packages/zeroconf/__init__.py:1580: DeprecationWarning: ServiceInfo.address is deprecated, use addresses instead
  warnings.warn("ServiceInfo.address is deprecated, use addresses instead", DeprecationWarning)
And mixed in sporadically (frequent but not as frequent) I saw these:
  % Total    % Received % Xferd  Average Speed   Time    Time     Time  Current
                                 Dload  Upload   Total   Spent    Left  Speed
  0     0    0     0    0     0      0      0 --:--:-- --:--:-- --:--:--     0
100   155  100   155    0     0  25833      0 --:--:-- --:--:-- --:--:-- 31000
  % Total    % Received % Xferd  Average Speed   Time    Time     Time  Current
                                 Dload  Upload   Total   Spent    Left  Speed
  0     0    0     0    0     0      0      0 --:--:-- --:--:-- --:--:--     0
100    67  100    67    0     0  13400      0 --:--:-- --:--:-- --:--:-- 13400
  % Total    % Received % Xferd  Average Speed   Time    Time     Time  Current
                                 Dload  Upload   Total   Spent    Left  Speed
  0     0    0     0    0     0      0      0 --:--:-- --:--:-- --:--:--     0
100   351  100   351    0     0  50142      0 --:--:-- --:--:-- --:--:-- 50142
For some of the notes earlier, I do run Node RED and it was the first thing I opened up. There didn't seem to be any issues at all with it, no out of the ordinary logs and it was working fine. I also use a good number of other addons and custom cards mentioned above. None of the addons had any out of the ordinary messages in their logs either, custom cards don't have logs so I don't know if they're the cause.
For other details, I use the android app on my phone and Firefox on my mac. I definitely left tabs open to HA before I went to bed on my mac and probably on my phone as well. I don't think I specifically had more-info panel up showing a graph this time but I probably left a tab up on lovelace UI.
 mdegat01
on 21 Apr 2020
mdegat01
on 21 Apr 2020
Idk if it helps but I've been navigating around my UI tracking websockets connections and across all of my custom cards the only one opened is the one opened by frontend_latest/core.abc5e50d.js. The custom cards I use are as follows:
- Bar card
- Binary Control Button Row
- Custom Header
- Favicon counter
- Flex Table
- Light brightness preset row
- Lovelace Card Preloader
- Lovelace Card Templater
- Mini Graph Card
- Mini media player
- Roku card
- Vertical Stack in card
- auto-entities
- card-tools
- dummy-entity-row
- fold-entity-row
- layout-card
- slider-entity-row
- template-entity-row
mdegat01
on 21 Apr 2020
I also have the same problem.
It happened after installing HACS and some custom cards.
The problem happens when I edit a custom card.
The custom cards I use are as follows:
- button-card
- button-text-card
- custom-header
- card-mod
- card-tools
- mini-graph-card
- mini-media-player
- search-card.
- simple-weather-card
 Joca72
on 25 Apr 2020
Joca72
on 25 Apr 2020
Same in 108.9, removing all custom cards and hacs gets better but the error is still there. It happen about twice a day. It seems to be related to chrome tab keeped open, it get worst if the pc that is running chrome goes in sleep mode.
 fraschizzato
on 28 Apr 2020
fraschizzato
on 28 Apr 2020
I think is related to chrome tabs that remains open for long time. More details below:
- I've tried with and without: hacs - appdaemon - custom_components - custom_cards and (except for custom_cards) I didn't find a direct correlation. For custom_card there are 2 different causes: UI not correctly reloaded (most common - use CTRL+F5 in chrome to reload) and duplication/overlap of cards/integration for who now uses hacs but before added them manually (a lot more buggy - double check if all customization are removed before using hacs to add them)
- I've found that one automation was not triggered during the ERROR so I've made an mqtt watchdog timer to exactly see when the problem occurs:
- Initially I've found that (with my config) it happens about twice a day, Hass is not responsive during the error BUT 3 out of 4 times it self-restored - after some times (variable between 30sec and 8min) Hass works as if nothing happened before. So many times the error is not appreciable, It causes problem to the user if he tries to use the UI during the error.
- But, MOST IMPORTANT, I've found that the error happens ONLY if there is a client (phone or pc - chrome or home assistant companion) with the ui open for long time. Now, that i'm closing always any Home Assistant tab after use, the error is gone (for now 12h without any error and keep going)
- It seems, but not sure about this, that it's related to the fact that the pc/phone with the tab open goes on sleep mode or there are (like in my case) wifi/network jumps
Probably Hass and Frontend does not manage correctly the socket disconnection-reconnection. Hass must stop sending data through websocket after first pending messages and meanwhile Frontend must attempt a reconnection (like when hass is restarted but ui is keeped open)
Hope it helps
fraschizzato
on 29 Apr 2020
I think is related to chrome tabs that remains open for long time. More details below:
- But, MOST IMPORTANT, I've found that the error happens ONLY if there is a client (phone or pc - chrome or home assistant companion) with the ui open for long time. Now, that i'm closing always any Home Assistant tab after use, the error is gone (for now 12h without any error and keep going)
- It seems, but not sure about this, that it's related to the fact that the pc/phone with the tab open goes on sleep mode or there are (like in my case) wifi/network jumps
Probably Hass and Frontend does not manage correctly the socket disconnection-reconnection. Hass must stop sending data through websocket after first pending messages and meanwhile Frontend must attempt a reconnection (like when hass is restarted but ui is keeped open)
Hope it helps
That corresponds exactly to the behavior of HA and HA Comanion app I described above and to this error:
https://github.com/home-assistant/android/issues/542
Pirol62
on 29 Apr 2020
That corresponds exactly to the behavior of HA and HA Comanion app I described above and to this error:
home-assistant/android#542
Exactly, the error I've get today is most probably from the mobile app in background... I think the solution is to force-close the app everytime...
Another fact is that with the number in logs I can't identify which device causes the issue, maybe in the error message a client identifier (much more detailed) can be usefull...
fraschizzato
on 29 Apr 2020
I still get this issue without having had the mobile app open.
kloggy
on 29 Apr 2020
I still get this issue without having had the mobile app open.
I've used the word "probably" because today I'm pretty sure that I've always closed tab and app, but I can't understad which "Client" exceeded if there are no client.
UPDATE:
Just found that the client is causing all is appdaemon.... Didn't know if itself or specific app, and why
fraschizzato
on 29 Apr 2020
Not sure if mine is related to extended sessions. I notice I get a new connected client every time I try to edit a custom card and this causes the error flood. I have to restart HA about every 13 edits or so or it becomes unusable.
cratermaddie
on 29 Apr 2020
UPDATE:
Just found that the client is causing all is appdaemon.... Didn't know if itself or specific app, and why
AppDaemon may be part of it but it can't be the whole story. I have this issue and I don't use AppDaemon at all.
I have made a greater attempt to close my tabs before going to bed or at least switching away from Lovelace UI and haven't seen it when I do that. I still use the mobile app on my android phone and don't force close that after use so not sure if I'm seeing the connection between the two some of you seem to be.
Also I noticed the issue happened again about maybe a week or so ago when I did accidentally leave a tab open to Lovelace UI on my computer but it was a bit different. I've added the websocket connection sensor so I can track the connections over time. This time when the issue hit I didn't see the same log messages as before and the number of connections capped at 50 then went down again in the morning without me needing to restart.
So perhaps something changed? The number of connections still skyrocketed which isn't great but at least this time I didn't see a stream of errors and have to restart to get things working again.
mdegat01
on 29 Apr 2020
Just found that (for me) the "problematic" client is AppDaemon...
But:
The problem occurs frequently if there are long-living tabs or app.
Now I've removed all "recent" appdaemon app, too early to see if the problem is still there, other apps are still there because in years I haven't seen a problem. (AppDaemon V 4.0.3)
Just to clarify, I've initially removed AppDaemon from the causes because the problem was still there after a complete AppDaemon stop. Probably It has more factors,
- custom_card seems to be frequent but many reports says that refreshing browser cache solves the problem.
- Long-Living tabs and background app, if not the cause, are making the problem worse
- AppDaemon is the client that shows the problem in logs, it runs locally, on the same hass machine, so I didn't think is a network problem, It worked without issues for years, so: It's a cause or a symptom? I have to recheck all configs but i'm pretty sure (until now it worked correctly) that everything is ok: In my environment I use nginx and letsencrypt ssl certs on duckdns (resolved locally from the router in lan)...
here the cofiguration, if someone see's something wrong:
secret: /home/pi/.homeassistant/secrets.yaml

logs:
  main_log:
    filename:  /home/pi/logs/appdaemon.log
  access_log:
    filename: /home/pi/logs/access.log
  error_log:
    filename: /home/pi/logs/appdaemon.err
  diag_log:
    filename:  /home/pi/logs/diag.log
    log_generations: 5
    log_size: 1024
    format: "{asctime} {levelname:<8} {appname:<10}: {message}"

appdaemon:
  app_dir: /home/pi/.homeassistant/appdaemon
  total_threads: 50
  time_zone: Europe/Rome
  latitude: <latitude>
  longitude: <longitude>
  elevation: 390
  plugins:
    HASS:
      type: hass
      ha_url: https://127.0.0.1
      token: !secret token
      #cert_path: /etc/letsencrypt/live/<url>/fullchain.pem
      cert_verify: False
      namespace: default

http:
  url: https://<url>:5050
  password: !secret pwd
  dash_ssl_certificate: /etc/letsencrypt/live/<url>/fullchain.pem
  dash_ssl_key: /etc/letsencrypt/live/<url>/privkey.pem
api:
admin:
configuration: self.config_dir
apps: self.app_dir
dashboard: self.dashboard_dir
`
fraschizzato
on 29 Apr 2020
Here what I've found:
That's from Home Assistant Log --> The client is appdaemon (the only client)
2020-04-29 21:14:05 ERROR (MainThread) [homeassistant.components.webhook] Error processing webhook cb2a6ba9b5719bbc9ca5cc794e7f3aeffde42ddf8c51a950206f38ed1204e58c
2020-04-29 21:15:58 ERROR (MainThread) [homeassistant.components.websocket_api.http.connection.140692626535536] Client exceeded max pending messages [2]: 512
2020-04-29 21:15:58 ERROR (MainThread) [homeassistant.components.websocket_api.http.connection.140692626535536] Client exceeded max pending messages [2]: 512
That's from AppDaemon (things starded go bad a little time before):
After Some Messages Like this:
2020-04-29 21:12:27.404924 WARNING cloro: Coroutine (<coroutine object ADAPI.set_state at 0x7fcb742552c8>) took too long (10                                                                 seconds), cancelling the task...
2020-04-29 21:12:27.408978 WARNING HASS: Timeout in set_state(default, sensor.cloro2, {'state': 'Out Of Range'})
2020-04-29 21:12:27.410966 WARNING AppDaemon: callback ppm() in cloro has now completed
I get:
2020-04-29 21:13:30.925645 WARNING HASS: Error setting Home Assistant state default.sensor.cloro1, {'state': 'Out Of Range'}
2020-04-29 21:13:30.926696 WARNING HASS: Code: 502, error: <html>
<head><title>502 Bad Gateway</title></head>
<body bgcolor="white">
<center><h1>502 Bad Gateway</h1></center>
<hr><center>nginx/1.10.3</center>
</body>
</html>
After Some messages like this one, I get the error in Home Assistant log, that degenerates in unresponsive ui...
Meanwhile in nginx:
2020/04/29 21:13:00 [error] 4974#4974: *8530 connect() failed (111: Connection refused) while connecting to upstream, client: ::ffff:127.0.0.1, server: sitename.duckdns.org, request: "POST /api/states/sensor.cloro2 HTTP/1.1", upstream: "http://[::1]:8123/api/states/sensor.cloro2", host: "127.0.0.1"
2020/04/29 21:13:17 [error] 4977#4977: *8508 upstream timed out (110: Connection timed out) while reading response header from upstream, client: ::ffff:127.0.0.1, server: sitename.duckdns.org, request: "POST /api/states/sensor.cloro2 HTTP/1.1", upstream: "http://127.0.0.1:8123/api/states/sensor.cloro2", host: "127.0.0.1"
2020/04/29 21:13:20 [error] 4977#4977: *8511 upstream timed out (110: Connection timed out) while reading response header from upstream, client: ::ffff:127.0.0.1, server: sitename.duckdns.org, request: "POST /api/states/sensor.flag_ph HTTP/1.1", upstream: "http://127.0.0.1:8123/api/states/sensor.flag_ph", host: "127.0.0.1"
2020/04/29 21:13:24 [error] 4974#4974: *8541 connect() failed (111: Connection refused) while connecting to upstream, client: ::ffff:127.0.0.1, server: sitename.duckdns.org, request: "POST /api/states/sensor.flag_ph HTTP/1.1", upstream: "http://[::1]:8123/api/states/sensor.flag_ph", host: "127.0.0.1"
2020/04/29 21:13:30 [error] 4974#4974: *8517 upstream timed out (110: Connection timed out) while reading response header from upstream, client: ::ffff:127.0.0.1, server: sitename.duckdns.org, request: "POST /api/states/sensor.cloro1 HTTP/1.1", upstream: "http://127.0.0.1:8123/api/states/sensor.cloro1", host: "127.0.0.1"
and then:
2020/04/29 21:25:01 [error] 4977#4977: *8713 connect() failed (111: Connection refused) while connecting to upstream, client: ::ffff:192.168.1.211, server: sitename.duckdns.org, request: "POST /api/webhook/<xxxxxxxxxxxxxxxxxxxxxx> HTTP/1.1", upstream: "http://[::1]:8123/api/webhook/<xxxxxxxxxxxxxxxxxxxxxxxxxxxxxxxxxxxxx>", host: "sitename.duckdns.org"
fraschizzato
on 29 Apr 2020
Same on 109.0. Removed the appdaemon app mentioned above. After 10hrs same problem with another appdaemon app (that has worked well for years).
Note: In websocket client I see 3 clients, one is the pc client, one is appdaemon, but the third? Is google assistant integration or telegram or something else?
fraschizzato
on 30 Apr 2020
I experienced this issue as soon as I started using card-mod with templates.
 stezak77
on 4 May 2020
stezak77
on 4 May 2020
Are you guys using https for local home assistant? I think in my case this errors started to happen occasionally after I've activated https. I also deactivated it again for a few days and this error didn't happen anymore (in this period).
I never had issues with high CPU load or unresponsive lovelace so far.
I'm the Android App on my mobile phone and firefox on the desktop. I've activated the websocket_api sensor now and will observe if I also have thousands of connections one day.
 monotonus
on 5 May 2020
monotonus
on 5 May 2020
I use nginx proxy manager with https managed via it.
andriej
on 5 May 2020
same for me, high cpu and a lot of
2020-05-11 19:49:36 ERROR (MainThread) [homeassistant.components.websocket_api.http.connection.140591535874384] Client exceeded max pending messages [2]: 2048
have the https for local homeassistant and some custom cards + tileboard, hassio/0.109.4
 radinsky
on 11 May 2020
radinsky
on 11 May 2020
I just want to give my "contribution", i had this error when i made a extension to my xiaomi door sensor, and because of a wire without enough solder, the sensor sent a lot of msgs through zigbee2mqtt and my this gave me this error. "
"Client exceeded max pending messages [2]: 512" etc etc and the frontend of ha became unrechable etc.
Just fixed the wires and, this error is gone.
 Scourger10
on 17 May 2020
Scourger10
on 17 May 2020
I've just experienced this. May have had it before but restarted and didn't check logs as I was time constrained.
I am not using Node Red nor appdaemon nor an android phone. Did have Chrome open on my laptop for quite a while and use the companion app on an iPad in the wall which is always on.
I use the following custom cards/integrations including card-tools.
 resources:
    - type: js
      url: /local/alarm_control_panel-card.js?v=4
    - type: module
      url: /hacsfiles/mini-media-player/mini-media-player-bundle.js
    - type: module
      url: /hacsfiles/bar-card/bar-card.js
    - type: js
      url: /local/card-tools/card-tools.js?v=1
    - type: js
      url: /local/useful-markdown/useful-markdown-card.js?v=1
    - type: js
      url: /local/vacuum/xiaomi-vacuum-card.js?v=1
    - type: js
      url: /hacsfiles/calendar-card/calendar-card.js
    - type: module
      url: /hacsfiles/garbage-collection-card/garbage-collection-card.js
    - type: module
      url: /hacsfiles/bom-weather-card/bom-weather-card.js
    - type: module
      url: /hacsfiles/search-card/search-card.js
    - type: js
      url: /local/layoutcard/layout-card.js?v=1
    - type: js
      url: /hacsfiles/love-lock-card/love-lock-card.js
    - type: module
      url: /hacsfiles/garbage-collection-card/garbage-collection-card.js
    - type: module
      url: /hacsfiles/custom-header/custom-header.js
    - type: module
      url: /hacsfiles/mini-graph-card/mini-graph-card-bundle.js
    - url: /hacsfiles/lovelace-card-preloader/lovelace-card-preloader.js
      type: module
    - url: /local/plan-coordinates.js?v=2
      type: js
Using the latest 110.2
Thanks!
 lockyt
on 26 May 2020
lockyt
on 26 May 2020
I have the same issue on 110.2
running on docker in synology here
I have the following instances always running:
- homeassistant app on ipad
- homeassistant app on pixel 3 (2 different phones)
- homeassistant on chrome tab (mac)
- homeassistant on chrome tab (surface pro)
- homeassistant on chrome tab (surface book 2)
my resources:
resources:
- url: /local/custom_ui/card-mod.js?v=1a020c4
  type: module
- url: /local/custom_ui/layout-card.js?v=af99dba
  type: module
- url: /local/custom_ui/card-tools.js?v=9ff49e1
  type: module
- url: /local/custom_ui/custom-header.js?v=708553a
  type: module
- url: /local/custom_ui/popup-backdrop-filter.js?v=d410735
  type: module
- url: /local/custom_ui/lovelace-card-preloader.js?v=fc972bd
  type: js
 gekim84
on 26 May 2020
gekim84
on 26 May 2020
I have seen this messages few times the last days. I am using Chrome. My
ressources:
- button-card
- card-mod
- card-tools
- clockwork-card
- flower-card
 florianec
on 29 May 2020
florianec
on 29 May 2020
The logged message is a websocket client that is misbehaving, that requires a warning and the client needs to be fixed.
We can only fix issues that are in our code base. So we're interested in anyone that can reproduce this:
- without having any custom cards or custom integrations loaded
- no external clients connected to the websocket API, just the frontend
- do not use any proxy servers like NGINX in front of Home Assistant
balloob
on 29 May 2020
I just experienced this as well just after updating from 110.3 to 110.4. Also updated Supervisor to the latest (226). Extremely sluggish, hard to view logs. Thankfully RobC on Discord suggested I may have an open browser someplace and after closing a few old open browsers, everything is snappy again. I _do_ have NodeRED and am happy to provide more detail as needed.
 gpetersen
on 4 Jun 2020
gpetersen
on 4 Jun 2020
Since latest update (0.110.4) the problem like came-back, but now it's not causing log to flood and performance to drop a lot. Not seen on CPU:
In log:
andriej
on 8 Jun 2020
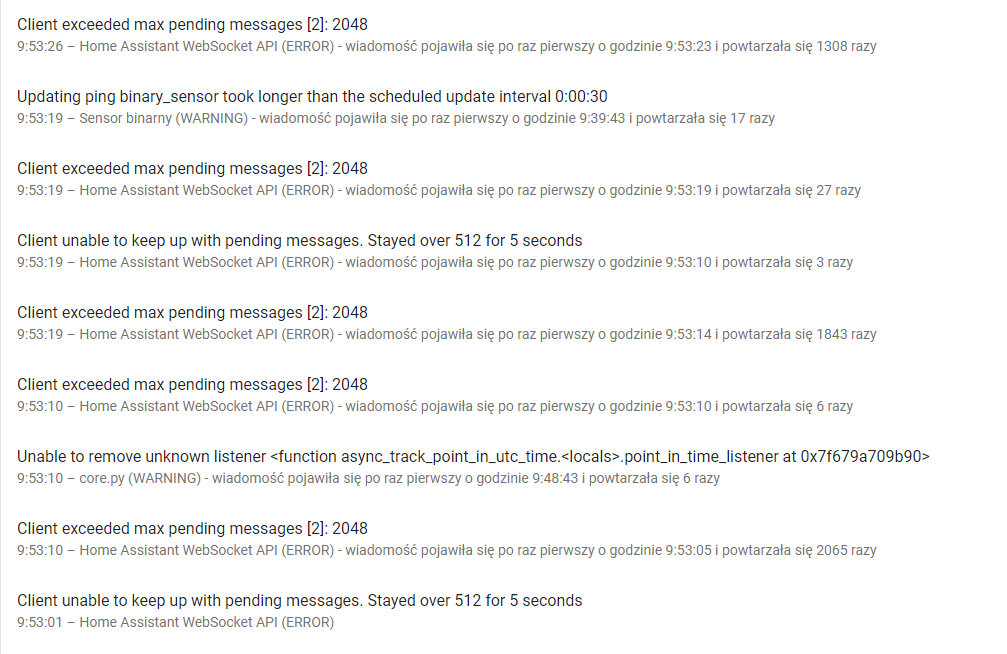
Problem appeared again today, but there's new in-between error that may give some clue?
Logger: homeassistant.core
Source: core.py:637
First occurred: 9:48:43 (6 occurrences)
Last logged: 9:53:10

Unable to remove unknown listener <function async_track_point_in_utc_time.<locals>.point_in_time_listener at 0x7f679a709b90>
Unable to remove unknown listener <function async_track_point_in_utc_time.<locals>.point_in_time_listener at 0x7f678c0e93b0>
Unable to remove unknown listener <function async_track_point_in_utc_time.<locals>.point_in_time_listener at 0x7f678c28ec20>
Unable to remove unknown listener <function async_track_point_in_utc_time.<locals>.point_in_time_listener at 0x7f682e699680>
Unable to remove unknown listener <function async_track_point_in_utc_time.<locals>.point_in_time_listener at 0x7f678beeecb0>
andriej
on 9 Jun 2020
New day, new destroyed HA experience... I get constans error, my logfile is already 40MB and destroying I/O ratio of SSD and I don't have clue anymore how to fix the situation.
CPU above 30% constans..
Even grepping the few customs I have left for "ws:" "WebSocket" "wss" gives nothing.
andriej
on 10 Jun 2020
Has anyone already reproduced this without any custom things or 3rd party things talking to Home Assistant?
bramkragten
on 10 Jun 2020
I don't think anyone could do this, as HA UI doesn't use websockets, right?
andriej
on 10 Jun 2020
In that case, what is this issue doing on the frontend repo? 😄
The frontend does most of the communication to the backend over WebSocket.
bramkragten
on 10 Jun 2020
In the past I've seen this issue mentioend in /core and it was suggested to be opened in frontend. :-)
andriej
on 10 Jun 2020
Related issues
 Fusseldieb
·
4Comments
Fusseldieb
·
4Comments
 wangyt123ng
·
3Comments
wangyt123ng
·
3Comments
 TheZoker
·
3Comments
TheZoker
·
3Comments
 SeanPM5
·
4Comments
SeanPM5
·
4Comments
 Misiu
·
3Comments
Misiu
·
3Comments
Most helpful comment
Semi-related to this. In 109 I introduced a new feature https://github.com/home-assistant/core/pull/34175 that allows the WebSocket queue to temporarily peak over 512 pending messages for up to 5 seconds. This allows clients to catch up if they have a hiccup or if an integration adds a lot of entities/causes a lot of events at once.