Frontend: History Graph Card (history-graph) not updating until the page is manually refreshed
Checklist
- [X] I have updated to the latest available Home Assistant version.
- [X] I have cleared the cache of my browser.
- [X] I have tried a different browser to see if it is related to my browser.
The problem
I have multiple history-graph cards in my dashboard. All worked well until 0.106.5 when these graphs stopped updating. I tried changing refresh_interval, changed browsers even tried clean installation with no luck. I need to refresh the page to see new data on the graph. All graphs ale stuck in time of last page refresh.
Expected behavior
Graphs should be refreshing according to refresh_interval parameter.
Steps to reproduce
- Add history-graph to Lovelace
- Add any sensor, that changes state reasonably often to graph.
- Save and let it show in the browser for a few minutes
Environment
Home Assistant release with the issue: 0.106.6
Last working Home Assistant release (if known): 0.106.4
Browser and browser version: Android Chromium, Safari
Operating system: iOS, iPadOS, Android
Problem-relevant configuration
    - type: history-graph
      hours_to_show: 8
      refresh_interval: 30
      title: 'Teplota a vlhkosť'
      entities:
        - entity: sensor.bedroom_temperature
          name: 'Spálňa'
        - entity: sensor.kids_room_temperature
          name: 'Detská izba'
        - entity: sensor.paincave_temperature
          name: 'Pracovňa'
        - entity: sensor.dining_room_temperature
          name: 'Obývačka'
        - entity: sensor.master_bathroom_temperature
          name: 'Kúpelňa'
        - entity: sensor.guest_bathroom_temperature
          name: 'Hosťovská kúpelňa'
        - entity: sensor.bedroom_humidity
          name: 'Spálňa'
        - entity: sensor.kids_room_humidity
          name: 'Detská izba'
        - entity: sensor.paincave_humidity
          name: 'Pracovňa'
        - entity: sensor.dining_room_humidity
          name: 'Obývačka'
        - entity: sensor.master_bathroom_humidity
          name: 'Kúpelňa'
        - entity: sensor.guest_bathroom_humidity
          name: 'Hosťovská kúpelňa'
Javascript errors shown in your browser console/inspector
Additional information
 radoslavsirota
All 20 comments
I was unable to reproduce this issue. I added a sensor and a refresh interval of 30 seconds. Sensor changed and the refresh interval came back around the card updated.
 zsarnett
on 12 Mar 2020
zsarnett
on 12 Mar 2020
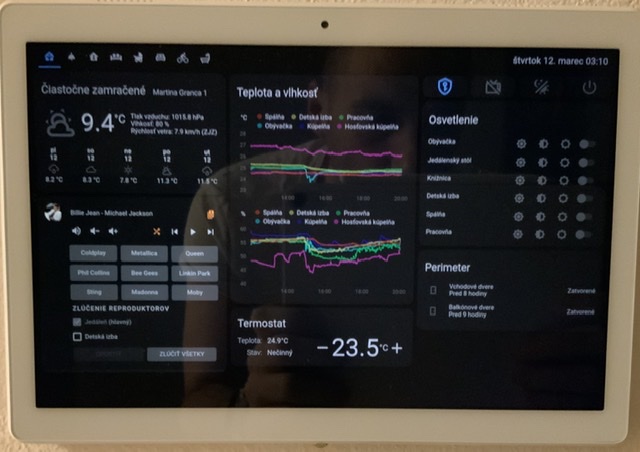
Thank you. I do not know what is going on. This is a photo of the dashboard right now. As you can see, all cards are updated, but graph is not. It is stuck around 22:00 although it is already past 3:00.
radoslavsirota
on 12 Mar 2020
Now I tested it on a fresh installation with only 3 sensors in history-graph and it is indeed working. On my main HA instance with full configuration it is not. I will investigate further.
radoslavsirota
on 12 Mar 2020
So it seems like the cause is some custom component or configuration I am using in lovelace, I do not know yet. I will try to identify the problem and update the post one/if I do.
radoslavsirota
on 12 Mar 2020
I narrowed it down to layout-card. It works when I remove it from configuration. Going to open an issue with its developer. Thanks.
radoslavsirota
on 12 Mar 2020
@radoslavsirota did you end up with a solution to this? I have been using home assistant for a number of years without issues. I changed my layout recently to add a layout card and the history graph stopped updating as you described. Unfortunately I have now removed the layout card but the history graph still doesn't update (without manual page refresh).
EDIT: When I "properly" removed the layout card the history graph started updating again.
 CraigHoffmann
on 10 May 2020
CraigHoffmann
on 10 May 2020
@CraigHoffmann no I did not. I just removed it (layout card) in views, that have graphs and it works for me. Did not have much time to play with it more since.
radoslavsirota
on 11 May 2020
I'm having exactly the same problem: no history graph update until reload. I deleted home-assistant_v2.db, but it did not help. My lovelace config is auto-generated, no manual yaml. I'm not sure I have the layout card, but when I peek into the yaml with the raw editor, I do not see any layout card.
 tvl9ops
on 8 Aug 2020
tvl9ops
on 8 Aug 2020
@tvl9ops I still have a problem with history graphs. Initially I thought removing layout cards fixed the problem but I later realised it didn't. For me it hasn't worked since the previous post in May. I am currently on latest version with default lovelace theme. I have even created a new dashboard with just one history chart of my power meter sensor which updates every minute and one entity card containing just a time sensor. The Time refreshes automatically but the history chart only refreshes when I refresh the browser. Tried with chrome, firefox, edge. I have not had time to dig in much further than creating the dedicated dashboard. Also I note that the new "Sensor Card" graph updates without manually refreshing but unfortunately for me the way it filters/smooths the curve is unacceptable for some of my charts. I notice someone has also recently opened the following which appears to be similar https://github.com/home-assistant/frontend/issues/6520
CraigHoffmann
on 9 Aug 2020
I checked the behavior more in detail, created a new view, but now change, update does not work. Everything else updates normally (sensor values, media player state etc.). What I also noticed is that if I go to edit mode the edit preview shows the history card correctly. If I hit cancel, the state of the card is still stuck at the same eariler state. If I hit save, the card does update. #6520 seems different, because nothing updates there (e.g. media player). It's probably worth mentioning that I migrated to hassio from Mac OS X and I copied the whole config directory.
tvl9ops
on 9 Aug 2020
I attached a screenshot, which shows that the history graph timeline does not update (the last page reload was at 6:44 pm), although the sensors all have updated values as of 7:05 pm. The refresh interval is set to 30.
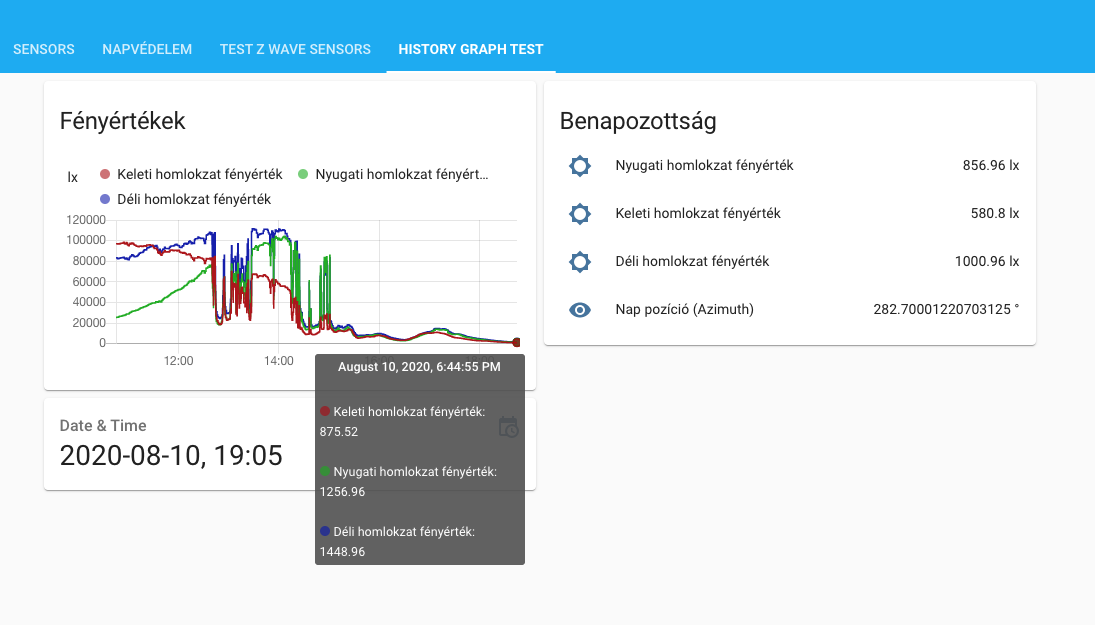
tvl9ops
on 10 Aug 2020
Some additional info:
arch | x86_64
-- | --
chassis | embedded
dev | false
docker | true
docker_version | 19.03.11
hassio | true
host_os | HassOS 4.12
installation_type | Home Assistant OS
os_name | Linux
os_version | 5.4.56
python_version | 3.8.3
supervisor | 229
timezone | Europe/Budapest
version | 0.113.3
virtualenv | false
tvl9ops
on 10 Aug 2020
I just want to confirm that I have exactly the same issue that the history graphs is not refreshing in GUI using vertical stack cards with history graphs
running HassOS 4.12 / Supervisor 229 on RPi4 / HA 0.113.3
 danielolsson100
on 11 Aug 2020
danielolsson100
on 11 Aug 2020
I have opened https://github.com/home-assistant/frontend/issues/6520 because
- this issue here seemed to be related to using layout cards (which I am not using)
- the issue was already closed at that time
I am experiencing update history graph update issue with minimal configuration (just 1 history card, nothing else). Also everything else (once added) updates correctly, its just the history cards, no layout cards present.
It seems more ppl are now experiencing this, so Im not sure if those 2 issues should be merged or not now this has been reopened...
 OrbitingOcelot
on 13 Aug 2020
OrbitingOcelot
on 13 Aug 2020
I'm not using layout cards, and @CraigHoffmann realized his problem was not related to layout cards either. I read through it again and to me #6520 looks the same.
tvl9ops
on 14 Aug 2020
Same issue here with the history-graph card, and I'm not using layout-cards, so it's not that...
 Leapo
on 17 Aug 2020
Leapo
on 17 Aug 2020
Is there a way to tell if this 6647 fix has been released in a particular version of home assistant? It appears it was merged on 24/8... I have updated to version 114.4 of home assistant and don't see any change - still no history graph updating?
CraigHoffmann
on 29 Aug 2020
This will be in 115
zsarnett
on 29 Aug 2020
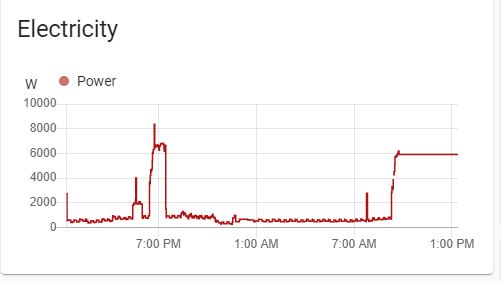
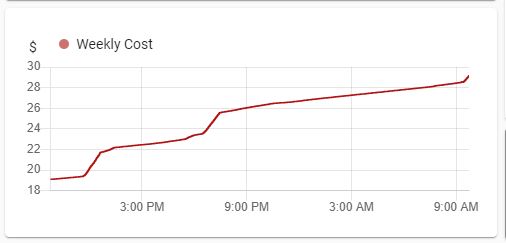
I've just updated from 114.4 to 115.2 and while there are improvements it does not appear to be fixed. Here is what happens with an mqtt sensor that updates every minute...
Before browser refresh:
After browser refresh:
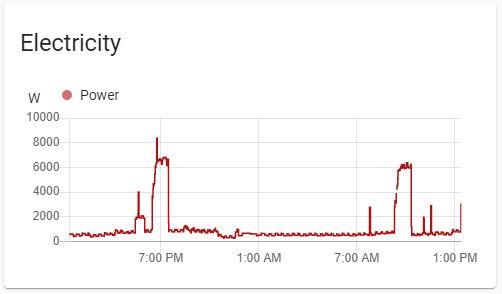
Note that the chart is now "scrolling in time" (previously didn't change at all) however the sensor value is flatlined at the value the screen was last refreshed. After refreshing the correct data is shown.
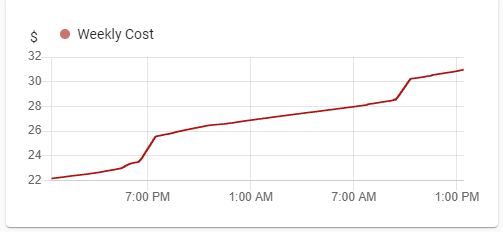
Curiously a different sensor is bahaving differently... A template sensor does not update at all until refresh.
Before browser refresh:
After browser refresh:
If there is any other info that would help investigate let me know and I'll see what I can do.
CraigHoffmann
on 24 Sep 2020
Exactly the same thing here, 115.2 has improvements, meaning the graph refreshes automatically, but often only the last value is repeated causing a flatline.
tvl9ops
on 28 Sep 2020
Related issues
 KennethLavrsen
·
3Comments
KennethLavrsen
·
3Comments
 SeanPM5
·
3Comments
SeanPM5
·
3Comments
 wangyt123ng
·
3Comments
wangyt123ng
·
3Comments
![move[bot] picture](https://avatars1.githubusercontent.com/in/6673?v=4&s=40) move[bot]
·
3Comments
move[bot]
·
3Comments
 Misiu
·
3Comments
Misiu
·
3Comments
Most helpful comment
Same issue here with the history-graph card, and I'm not using layout-cards, so it's not that...