Freqtrade: Awesome oscillator has a lot of missing values
Step 1: Have you search for this issue before posting it?
Yes
Step 2: Describe your environment
- Python Version: 3.6.8
- CCXT version: 1.18.551
- Branch: Develop
- Last Commit ID: 3e2c808b4bef4984a1f129e67736f18df327ab92
Step 3: Describe the problem:
I created custom strategy with only one indicator - qtpylib.awesome_oscillator. After that I ran:
python3 ./scripts/plot_dataframe.py -s CustomStrategy -p ETH/BTC --indicators2 ao --timerange 20190524-20190526
and opened user_data/freqtrade-plot.html.
Observed Results:
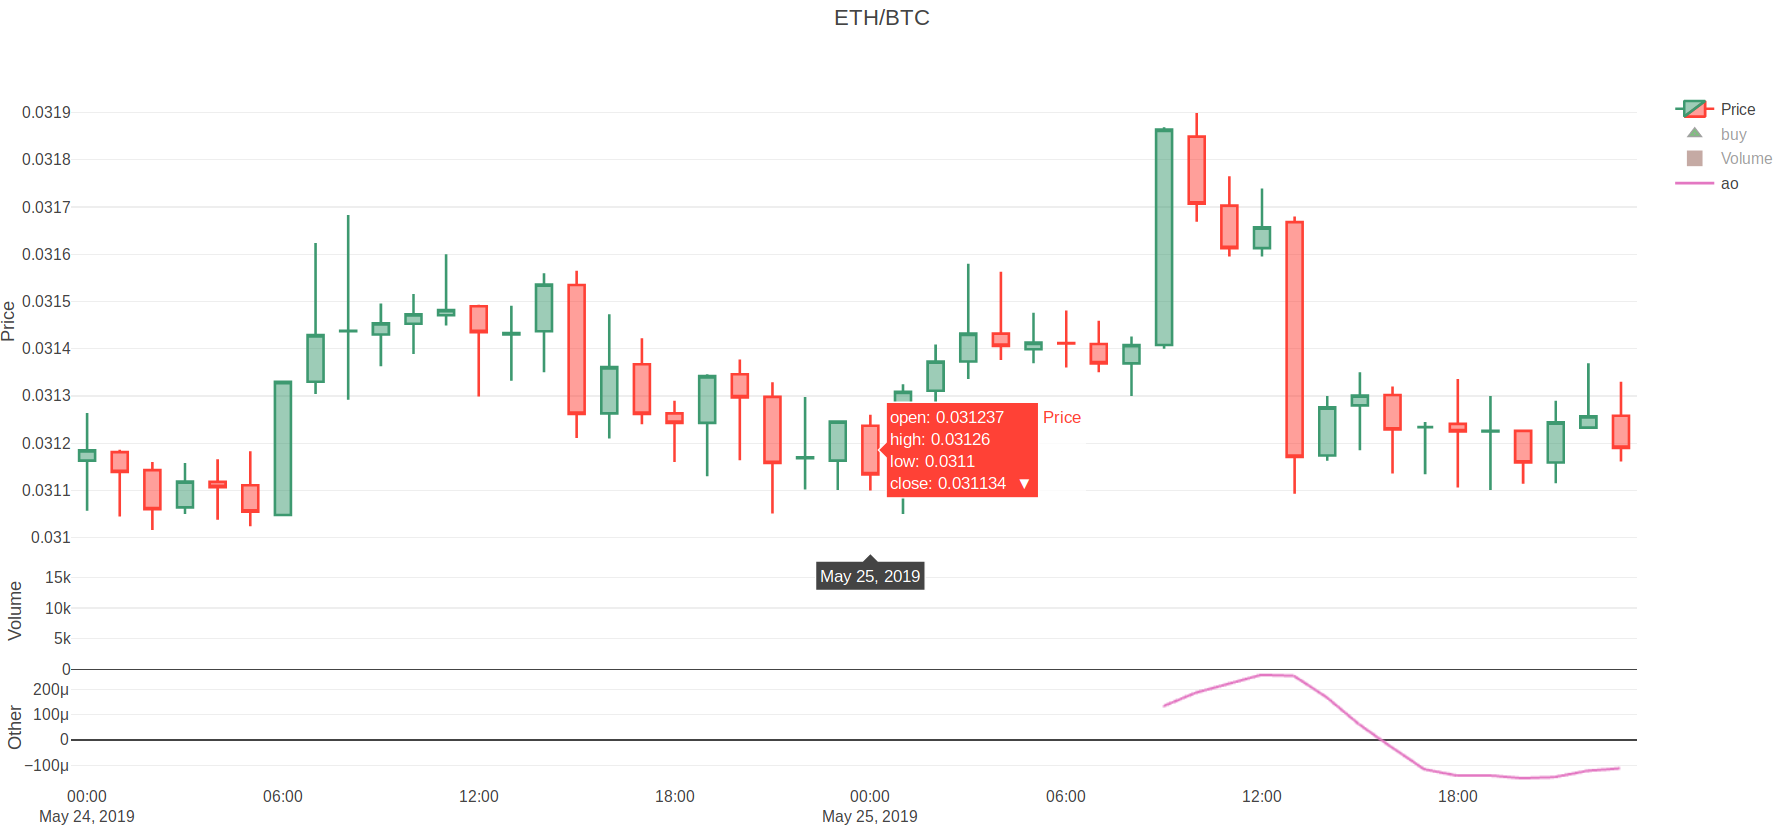
The awesome oscillator on freqtrade-plot has a lot of missing values(but of course tradingview.com has them). I get this issue for all pairs, and I just can't buy due to this.
 konstantin-doncov
All 4 comments
awesome oscillator in qtpy uses the exponential weighted function with default length of 34:
def awesome_oscillator(df, weighted=False, fast=5, slow=34)
That's what you see on the graph: first value is printed after 34 starting candles. These are not 'missing' values, it's a starting period for calculation of the first value of the mean function. If you have used EMA(100) in the strategy, you would get first value of EMA only after 100 starting candles.
Your time range is just 2 days, i.e. only 48 1h-candles. Try to use a longer time range.
 hroff-1902
on 29 May 2019
hroff-1902
on 29 May 2019
In addition to the above:
Tradingview has the full length of the indicator because it has data from before what you see - however you should be able to archive this as follows:
You could also run backtesting seperately (with a longer timerange) by using --export trades --export-filename user_data/backtest_export.json and then plot a smaller timerange (not at the beginning of the backtest period) to avoid this problem (don't forget to add --export-filename user_data/backtest_export.json to the plot-script so it's using the exported trades.
 xmatthias
on 29 May 2019
xmatthias
on 29 May 2019
@xmatthias "with a longer timerange" 😎
Thanks for example of partial plotting of the results, I did not think of such a use case.
This probably should be fixed somewhere in the docs in a section like "Efficient usage of freqtrade and its tools".
hroff-1902
on 29 May 2019
Many thanks for the explanation! Also, I have another question, more related to the ta-lib, but I think you can help me with it too:
https://github.com/mrjbq7/ta-lib/issues/266
konstantin-doncov
on 30 May 2019
Related issues
 Mesengeros
·
4Comments
Mesengeros
·
4Comments
 Axel-CH
·
3Comments
Axel-CH
·
3Comments
 cgw-9527
·
3Comments
cgw-9527
·
3Comments
 yperfanov
·
4Comments
yperfanov
·
4Comments
 Dante2333
·
4Comments
Dante2333
·
4Comments
Most helpful comment
In addition to the above:
Tradingview has the full length of the indicator because it has data from before what you see - however you should be able to archive this as follows:
You could also run backtesting seperately (with a longer timerange) by using
--export trades --export-filename user_data/backtest_export.jsonand then plot a smaller timerange (not at the beginning of the backtest period) to avoid this problem (don't forget to add--export-filename user_data/backtest_export.jsonto the plot-script so it's using the exported trades.