Frameworkbenchmarks: Amber, Kemal, Kemalyst results in question
Hi Nate,
We are baffled by the results for the 3 crystal projects and hoping you can help shed some light on the 100k RPS results. We were expecting 1.8 to 2.0 million RPS range for these projects.
We have done multiple runs on different sized systems in AWS trying to replicate the slow response times for plaintext and json in preview 2. @sdogruyol has also ran the benchmarks and can confirm similar findings.
I'm attaching the results on a c4.xlarge 8 core system and all three projects are showing 3x the results than the preview 2. We have also ran the tests on a 64 core 1.2ghz system with 10x the requests per second (~1 million RPS) than preview 2.
We followed the instructions provided for setting up the linux environments Ubuntu 14.04 and cannot determine what the difference is that would cause the slowness.
We think that the preview 2 is not correctly reflecting the performance for these 3 projects. It's as if the multiple processes or the reuse port was not properly working. What we find interesting is the crystal-raw did not encounter the same issue and had 2.5m RPS which is in line with our expectations.
We are aware of socket errors when there is heavy load, be we are not seeing this slow down the performance reflected in preview 2.
Any help is solving this mystery is appreciated. If possible, can you rerun the plaintext for the 3 projects and let us know if you are still seeing 100k RPS results?
Thanks,
Dru
 drujensen
All 127 comments
Thanks for this @drujensen :+1: I've also done some small runs and can second this issue, unfortunately I don't have any logs :cry:
 sdogruyol
on 6 Sep 2017
sdogruyol
on 6 Sep 2017
Hi @drujensen! We are investigating some issues now with r15-p2 and are doing some reruns. I'll let you know as soon as I see some results and we will go from there.
 nbrady-techempower
on 6 Sep 2017
nbrady-techempower
on 6 Sep 2017
@drujensen @sdogruyol Looks like we found the issue. We've started a new run and amber has completed but it will be some time before we get a full picture for R15-P3. Here are the results:
"plaintext": {
"amber": [
{
"latencyAvg": "23.70ms",
"latencyMax": "114.14ms",
"latencyStdev": "12.06ms",
"totalRequests": 1448302,
"startTime": 1504802515,
"endTime": 1504802530
},
{
"latencyAvg": "87.41ms",
"latencyMax": "404.84ms",
"latencyStdev": "50.07ms",
"totalRequests": 1629658,
"startTime": 1504802532,
"endTime": 1504802547
},
{
"latencyAvg": "336.33ms",
"latencyMax": "1.01s",
"latencyStdev": "180.85ms",
"totalRequests": 1621857,
"startTime": 1504802549,
"endTime": 1504802564
},
{
"latencyAvg": "1.30s",
"latencyMax": "4.72s",
"latencyStdev": "694.03ms",
"totalRequests": 1596471,
"startTime": 1504802566,
"endTime": 1504802581
}
],
"db": {
"amber": [
{
"latencyAvg": "582.47us",
"latencyMax": "5.86ms",
"latencyStdev": "589.15us",
"totalRequests": 252698,
"startTime": 1504801882,
"endTime": 1504801897
},
{
"latencyAvg": "603.34us",
"latencyMax": "7.06ms",
"latencyStdev": "664.24us",
"totalRequests": 506598,
"startTime": 1504801899,
"endTime": 1504801914
},
{
"latencyAvg": "748.65us",
"latencyMax": "23.61ms",
"latencyStdev": "1.12ms",
"totalRequests": 912180,
"startTime": 1504801916,
"endTime": 1504801931
},
{
"latencyAvg": "3.60ms",
"latencyMax": "87.26ms",
"latencyStdev": "7.44ms",
"totalRequests": 950311,
"startTime": 1504801933,
"endTime": 1504801949
},
{
"latencyAvg": "22.57ms",
"latencyMax": "198.01ms",
"latencyStdev": "38.84ms",
"totalRequests": 965665,
"startTime": 1504801951,
"endTime": 1504801966
},
{
"latencyAvg": "93.45ms",
"latencyMax": "656.78ms",
"latencyStdev": "141.04ms",
"totalRequests": 998851,
"startTime": 1504801968,
"endTime": 1504801983
}
],
"update": {
"amber": [
{
"latencyAvg": "18.10ms",
"latencyMax": "278.91ms",
"latencyStdev": "19.11ms",
"totalRequests": 269955,
"startTime": 1504802265,
"endTime": 1504802280
},
{
"latencyAvg": "65.79ms",
"latencyMax": "323.45ms",
"latencyStdev": "37.01ms",
"totalRequests": 59538,
"startTime": 1504802282,
"endTime": 1504802297
},
{
"latencyAvg": "125.15ms",
"latencyMax": "435.86ms",
"latencyStdev": "51.19ms",
"totalRequests": 30681,
"startTime": 1504802299,
"endTime": 1504802314
},
{
"latencyAvg": "184.44ms",
"latencyMax": "507.47ms",
"latencyStdev": "61.51ms",
"totalRequests": 20706,
"startTime": 1504802316,
"endTime": 1504802331
},
{
"latencyAvg": "245.74ms",
"latencyMax": "607.97ms",
"latencyStdev": "71.19ms",
"totalRequests": 15493,
"startTime": 1504802333,
"endTime": 1504802348
}
],
md5-01391851622b21cff47e1db0dd3fc3cf
"json": {
"amber": [
{
"latencyAvg": "129.93us",
"latencyMax": "2.97ms",
"latencyStdev": "74.34us",
"totalRequests": 984697,
"startTime": 1504802016,
"endTime": 1504802031
},
{
"latencyAvg": "133.28us",
"latencyMax": "2.86ms",
"latencyStdev": "77.50us",
"totalRequests": 1916676,
"startTime": 1504802033,
"endTime": 1504802048
},
{
"latencyAvg": "186.28us",
"latencyMax": "8.57ms",
"latencyStdev": "118.22us",
"totalRequests": 2707365,
"startTime": 1504802050,
"endTime": 1504802065
},
{
"latencyAvg": "615.00us",
"latencyMax": "9.95ms",
"latencyStdev": "260.15us",
"totalRequests": 1582804,
"startTime": 1504802067,
"endTime": 1504802082
},
{
"latencyAvg": "1.28ms",
"latencyMax": "16.54ms",
"latencyStdev": "849.91us",
"totalRequests": 1610007,
"startTime": 1504802084,
"endTime": 1504802099
},
{
"latencyAvg": "2.33ms",
"latencyMax": "35.07ms",
"latencyStdev": "1.06ms",
"totalRequests": 1668241,
"startTime": 1504802101,
"endTime": 1504802116
}
],
md5-01391851622b21cff47e1db0dd3fc3cf
"query": {
"amber": [
{
"latencyAvg": "95.62ms",
"latencyMax": "575.93ms",
"latencyStdev": "144.30ms",
"totalRequests": 1000349,
"startTime": 1504802149,
"endTime": 1504802164
},
{
"latencyAvg": "110.83ms",
"latencyMax": "620.93ms",
"latencyStdev": "160.90ms",
"totalRequests": 200564,
"startTime": 1504802166,
"endTime": 1504802181
},
{
"latencyAvg": "121.41ms",
"latencyMax": "691.91ms",
"latencyStdev": "164.79ms",
"totalRequests": 99223,
"startTime": 1504802183,
"endTime": 1504802198
},
{
"latencyAvg": "131.78ms",
"latencyMax": "674.72ms",
"latencyStdev": "169.81ms",
"totalRequests": 64963,
"startTime": 1504802200,
"endTime": 1504802215
},
{
"latencyAvg": "146.27ms",
"latencyMax": "781.06ms",
"latencyStdev": "174.94ms",
"totalRequests": 48586,
"startTime": 1504802217,
"endTime": 1504802233
}
],
Sorry to put the scare in everyone, but this is exactly why we do preview runs!
nbrady-techempower
on 7 Sep 2017
Hi Nate,
Thanks for looking into this. Unfortunately, this still looks the same to me. This is showing ~100k per second but i’m expecting 1.8m per second given my own benchmarking. We are getting ~400k per second on an 8 core system.
I’m not sure where to go from here. Any insight would be helpful.
Thanks,
Dru
On Sep 7, 2017, at 11:10 AM, Nate notifications@github.com wrote:
@drujensen https://github.com/drujensen @sdogruyol https://github.com/sdogruyol Looks like we found the issue. We've started a new run and amber has completed but it will be some time before we get a full picture for R15-P3. Here are the results:
"plaintext": {
"amber": [
{
"latencyAvg": "23.70ms",
"latencyMax": "114.14ms",
"latencyStdev": "12.06ms",
"totalRequests": 1448302,
"startTime": 1504802515,
"endTime": 1504802530
},
{
"latencyAvg": "87.41ms",
"latencyMax": "404.84ms",
"latencyStdev": "50.07ms",
"totalRequests": 1629658,
"startTime": 1504802532,
"endTime": 1504802547
},
{
"latencyAvg": "336.33ms",
"latencyMax": "1.01s",
"latencyStdev": "180.85ms",
"totalRequests": 1621857,
"startTime": 1504802549,
"endTime": 1504802564
},
{
"latencyAvg": "1.30s",
"latencyMax": "4.72s",
"latencyStdev": "694.03ms",
"totalRequests": 1596471,
"startTime": 1504802566,
"endTime": 1504802581
}
],
"db": {
"amber": [
{
"latencyAvg": "582.47us",
"latencyMax": "5.86ms",
"latencyStdev": "589.15us",
"totalRequests": 252698,
"startTime": 1504801882,
"endTime": 1504801897
},
{
"latencyAvg": "603.34us",
"latencyMax": "7.06ms",
"latencyStdev": "664.24us",
"totalRequests": 506598,
"startTime": 1504801899,
"endTime": 1504801914
},
{
"latencyAvg": "748.65us",
"latencyMax": "23.61ms",
"latencyStdev": "1.12ms",
"totalRequests": 912180,
"startTime": 1504801916,
"endTime": 1504801931
},
{
"latencyAvg": "3.60ms",
"latencyMax": "87.26ms",
"latencyStdev": "7.44ms",
"totalRequests": 950311,
"startTime": 1504801933,
"endTime": 1504801949
},
{
"latencyAvg": "22.57ms",
"latencyMax": "198.01ms",
"latencyStdev": "38.84ms",
"totalRequests": 965665,
"startTime": 1504801951,
"endTime": 1504801966
},
{
"latencyAvg": "93.45ms",
"latencyMax": "656.78ms",
"latencyStdev": "141.04ms",
"totalRequests": 998851,
"startTime": 1504801968,
"endTime": 1504801983
}
],
"update": {
"amber": [
{
"latencyAvg": "18.10ms",
"latencyMax": "278.91ms",
"latencyStdev": "19.11ms",
"totalRequests": 269955,
"startTime": 1504802265,
"endTime": 1504802280
},
{
"latencyAvg": "65.79ms",
"latencyMax": "323.45ms",
"latencyStdev": "37.01ms",
"totalRequests": 59538,
"startTime": 1504802282,
"endTime": 1504802297
},
{
"latencyAvg": "125.15ms",
"latencyMax": "435.86ms",
"latencyStdev": "51.19ms",
"totalRequests": 30681,
"startTime": 1504802299,
"endTime": 1504802314
},
{
"latencyAvg": "184.44ms",
"latencyMax": "507.47ms",
"latencyStdev": "61.51ms",
"totalRequests": 20706,
"startTime": 1504802316,
"endTime": 1504802331
},
{
"latencyAvg": "245.74ms",
"latencyMax": "607.97ms",
"latencyStdev": "71.19ms",
"totalRequests": 15493,
"startTime": 1504802333,
"endTime": 1504802348
}
],
"json": {
"amber": [
{
"latencyAvg": "129.93us",
"latencyMax": "2.97ms",
"latencyStdev": "74.34us",
"totalRequests": 984697,
"startTime": 1504802016,
"endTime": 1504802031
},
{
"latencyAvg": "133.28us",
"latencyMax": "2.86ms",
"latencyStdev": "77.50us",
"totalRequests": 1916676,
"startTime": 1504802033,
"endTime": 1504802048
},
{
"latencyAvg": "186.28us",
"latencyMax": "8.57ms",
"latencyStdev": "118.22us",
"totalRequests": 2707365,
"startTime": 1504802050,
"endTime": 1504802065
},
{
"latencyAvg": "615.00us",
"latencyMax": "9.95ms",
"latencyStdev": "260.15us",
"totalRequests": 1582804,
"startTime": 1504802067,
"endTime": 1504802082
},
{
"latencyAvg": "1.28ms",
"latencyMax": "16.54ms",
"latencyStdev": "849.91us",
"totalRequests": 1610007,
"startTime": 1504802084,
"endTime": 1504802099
},
{
"latencyAvg": "2.33ms",
"latencyMax": "35.07ms",
"latencyStdev": "1.06ms",
"totalRequests": 1668241,
"startTime": 1504802101,
"endTime": 1504802116
}
],
"query": {
"amber": [
{
"latencyAvg": "95.62ms",
"latencyMax": "575.93ms",
"latencyStdev": "144.30ms",
"totalRequests": 1000349,
"startTime": 1504802149,
"endTime": 1504802164
},
{
"latencyAvg": "110.83ms",
"latencyMax": "620.93ms",
"latencyStdev": "160.90ms",
"totalRequests": 200564,
"startTime": 1504802166,
"endTime": 1504802181
},
{
"latencyAvg": "121.41ms",
"latencyMax": "691.91ms",
"latencyStdev": "164.79ms",
"totalRequests": 99223,
"startTime": 1504802183,
"endTime": 1504802198
},
{
"latencyAvg": "131.78ms",
"latencyMax": "674.72ms",
"latencyStdev": "169.81ms",
"totalRequests": 64963,
"startTime": 1504802200,
"endTime": 1504802215
},
{
"latencyAvg": "146.27ms",
"latencyMax": "781.06ms",
"latencyStdev": "174.94ms",
"totalRequests": 48586,
"startTime": 1504802217,
"endTime": 1504802233
}
],
Sorry to put the scare in everyone, but this is exactly why we do preview runs!—
You are receiving this because you were mentioned.
Reply to this email directly, view it on GitHub https://github.com/TechEmpower/FrameworkBenchmarks/issues/2960#issuecomment-327878442, or mute the thread https://github.com/notifications/unsubscribe-auth/AABJHp31wIhG_7VGcoqyIrZo5nMU9AN1ks5sgDBNgaJpZM4PN5lo.
drujensen
on 7 Sep 2017
Nate,
To reiterate what @drujensen said above: We're getting 400k r/s after installing tech empower benchmarks and setting that up as per the instructions. It seems strange to that our 8 core VPS gets faster benchmarks than your 80 core server. Especially since on our tests we're only about 20% slower than crystal-raw which your benchmarks show at 2.5 million.
Thanks for your feedback,
Isaac Sloan
 elorest
on 7 Sep 2017
elorest
on 7 Sep 2017
Sorry guys, I misunderstood. Could you paste me the benchmark.cfg you are using in the framework root. Are you guys using a 3 machine set up? Our App server, Client, and DB are on separate machines. And have you also tested crystal in your environment?
nbrady-techempower
on 7 Sep 2017
Hey guys @drujensen @elorest Can you read this comment again?
He is showing us good results for plaintext, at least much better than before, closer to crystal-raw
"plaintext": {
"amber": [
{
"latencyAvg": "23.70ms",
"latencyMax": "114.14ms",
"latencyStdev": "12.06ms",
"totalRequests": 1448302, # => 1.44M
"startTime": 1504802515,
"endTime": 1504802530
},
...
{
"latencyAvg": "1.30s",
"latencyMax": "4.72s",
"latencyStdev": "694.03ms",
"totalRequests": 1596471, # => 1.59M
"startTime": 1504802566,
"endTime": 1504802581
}
],
Also json is good:
"json": {
"amber": [
{
"latencyAvg": "129.93us",
"latencyMax": "2.97ms",
"latencyStdev": "74.34us",
"totalRequests": 984697, # => 984K
"startTime": 1504802016,
"endTime": 1504802031
},
...
{
"latencyAvg": "2.33ms",
"latencyMax": "35.07ms",
"latencyStdev": "1.06ms",
"totalRequests": 1668241, # => 1.66M
"startTime": 1504802101,
"endTime": 1504802116
}
],
...
Thanks you @nbrady-techempower for you support! :heart:
 faustinoaq
on 7 Sep 2017
faustinoaq
on 7 Sep 2017
@faustinoaq that's total requests
1.44M / 15 ~= 100K RPS
sdogruyol
on 7 Sep 2017
@sdogruyol My bad :sweat_smile:
faustinoaq
on 7 Sep 2017
@elorest @drujensen can you confirm whether you're on a 1 or 3 machine setup and specifically, what is your ULIMIT max? We've set a very high ULIMIT on these machines and that specifically helped the performance of a lot of frameworks. After looking closely at wrk results you zipped up and the ones being generated from our environment, it seems like you may have a single machine setup with reduced latency and a smaller ULIMIT size which stunted crystal-raw.
nbrady-techempower
on 7 Sep 2017
Nate,
We only used a single machine and used the default u limit.
We will rerun on two boxes since we are not concerned with the 4 db tests and up the u limit to max.
I doubt that crystal-raw was some way limited by ulimits but we will confirm.
Question is why running on one box would be faster than 2, and why we are seeing 4x faster on an 8 core vs 80 core, but we will confirm.
drujensen
on 8 Sep 2017
We ran on a single VPS with other machines forwarded to 127.0.0.1 in the
hosts file. Ulimit said unlimited.
On Sep 7, 2017 6:32 PM, "Dru Jensen" notifications@github.com wrote:
Nate,
We only used a single machine and used the default u limit.
We will rerun on two boxes since we are not concerned with the 4 db tests
and up the u limit to max.I doubt that crystal-raw was some way limited by ulimits but we will
confirm.Question is why running on one box would be faster than 2, and why we are
seeing 4x faster on an 8 core vs 80 core, but we will confirm.—
You are receiving this because you were mentioned.
Reply to this email directly, view it on GitHub
https://github.com/TechEmpower/FrameworkBenchmarks/issues/2960#issuecomment-327966729,
or mute the thread
https://github.com/notifications/unsubscribe-auth/AAHmpIEHJAZDs0C0zGJ_0Zrjhh_cgUrIks5sgIsSgaJpZM4PN5lo
.
elorest
on 8 Sep 2017
@drujensen From the client running wrk to a server on a different machine simulates a real request over the internet. Hitting localhost with wrk on the same machine is going to give you much better results?
I don't think there's such a thing as ulimit=unlimited.
Also, as another note, the client running work is 8 HT cores. The server hosting your application has 80 HT cores.
nbrady-techempower
on 8 Sep 2017
From the client running wrk to a server on a different machine simulates a real request over the internet.
@nbrady-techempower I think :point_up_2: is reasonable but the thing here is that results in plaintext and json with kemal && amber. seems to be too far of crystal-raw results.
So, if crystal-raw is getting 1.5M RPS we are expecting at least 50% of that (say 700K RPS) not a 10% as the preview 2 is showing us (100K RPS). I think we can find the problem :smile:
BTW, Thanks you a lot for maintaining this awesome project! :heart:
faustinoaq
on 9 Sep 2017
@faustinoaq I understand what you're saying. I can give you guys other environment information as you need it. There must be something that crystal-raw is taking advantage of in that environment? I'm not sure without digging deep in to each framework, which unfortunately I can't do at the moment. But let me know if there's anything else I can get you.
nbrady-techempower
on 10 Sep 2017
@nbrady-techempower One theory we have is that we have too many GC threads running. Crystal by default launches 16 threads per process.
Crystal has a configuration setting to reduce the number of GC threads, but unfortunately, we don't have a way of checking to see if this is the issue since we can't duplicate the issue.
Is there a way we can make the changes and then request a run of amber and kemal to determine if these changes fix the slowness before another round?
drujensen
on 20 Oct 2017
@drujensen Absolutely! We actually have some downtime at the moment because Server Central is moving our environment to a different location, so feel free to open a PR with those changes as there will be a few more preview runs before official results are released.
nbrady-techempower
on 20 Oct 2017
@nbrady-techempower Thanks for your quick response! Can you run this PR against the servers and provide results?
drujensen
on 20 Oct 2017
I notice that for Kemal and Amber, it looks like you are converting the result to a JSON string and returning that, which would have to be later written to the IO for the response. The standard Crystal version writes directly to the output IO instead of constructing an intermediate string. Could that explain the discrepancy?
 foliot
on 28 Oct 2017
foliot
on 28 Oct 2017
@foliot You might be on to something. I could especially see the queries one being affected by that.
amber
def queries
response.content_type = JSON
queries = params["queries"]
queries = queries.to_i? || 1
queries = queries.clamp(1..500)
results = (1..queries).map do
if world = World.find rand(1..ID_MAXIMUM)
{id: world.id, randomNumber: world.randomNumber}
end
end
results.to_json
end
vs crystal
when "/queries"
response.status_code = 200
response.headers["Content-Type"] = "application/json"
JSON.build(response) do |json|
json.array do
sanitized_query_count(request).times do
random_world.to_json(json)
end
end
end
All though I'm pretty sure that the hello world routes are also being slow and breaking pipes.
elorest
on 28 Oct 2017
@drujensen what do you think?
elorest
on 28 Oct 2017
@elorest See https://github.com/TechEmpower/FrameworkBenchmarks/pull/2891
@sdogruyol tried it on Kemal before
faustinoaq
on 28 Oct 2017
Broken pipe is a misleading error, they happen when wrk shuts down and closes the tcp connection while crystal is still writing a response. It's not going to affect performance.
 RX14
on 28 Oct 2017
RX14
on 28 Oct 2017
@faustinoaq Ah yea, I thought I remembered @sdogruyol trying that. It looks like the problem was that he wrote the JSON to IO in the handler, while also returning a value that the framework would write to IO. There was some sort of problem when he wrote to the IO twice.
Couldn't you return a wrapper object with a to_str(io) method that would do nothing but call results.to_json(io)? Then there should be no intermediate string created. Unless, of course, the framework also creates an intermediate string from the return value instead of writing it straight to IO...
You could standardize this by making various response classes such as JSONResponse and PlainTextResponse so you would just have to return JSONResponse.new results. You could also have a content_type method on the response object so you wouldn't have to set that manually in the handler.
foliot
on 28 Oct 2017
Now that I look at it again, it doesn't look like it's the JSON benchmarks where Kemal is struggling.. Maybe the IO stuff isn't much of a performance impact after all.
EDIT: Never mind.. that is one of the ones it's struggling on. I'm misreading things.
foliot
on 28 Oct 2017
There's a ticket where we're working on that. We do have an issue though we
can't write to response if we care about Handler fall through. Once you
write the response it can't be modified. If this were an issue we could
probably find a way around it for benchmarks.
On Oct 28, 2017 1:06 PM, "foliot" notifications@github.com wrote:
@faustinoaq https://github.com/faustinoaq Ah yea, I thought I remembered
@sdogruyol https://github.com/sdogruyol trying that. It looks like the
problem was that he wrote the JSON to IO in the handler, while also
returning a value that the framework would write to IO. There was some sort
of problem when he wrote to the IO twice.
Couldn't you return a wrapper object with a to_str(io) method that would do
nothing but call results.to_json(io)? Then there should be no intermediate
string created. Unless, of course, the framework also creates an
intermediate string from the return value instead of writing it straight to
IO...
You could standardize this by making various response classes such as
JSONResponse and PlainTextResponse so you would just have to return
JSONResponse.new
results. You could also have a content_type method on the response object
so you wouldn't have to set that manually in the handler.
—
You are receiving this because you were mentioned.
Reply to this email directly, view it on GitHub
https://github.com/TechEmpower/FrameworkBenchmarks/issues/2960#issuecomment-340212991,
or mute the thread
https://github.com/notifications/unsubscribe-auth/AAHmpDaXUlGUwxzCX6e16tARvrhIXtMlks5sw3tHgaJpZM4PN5lo
.
elorest
on 28 Oct 2017
Unless, of course, the framework also creates an intermediate string from the return value instead of writing it straight to IO...
@foliot You can avoid return value using Nil as return type:
def foo : Nil
"foo"
end
pp foo # => nil
Update: I misread the comment 😅
Also exist NoReturn type, but is used only for low level stuff
faustinoaq
on 28 Oct 2017
Another interesting reference to @RX14 comments about GC via IRC:
<RX14> if you have 1 process with 80 threads you have 1 GC which pauses every thread
<RX14> does it's work
<RX14> and then finishes
<RX14> if you have 80 processes you have 80 seperate GCs
<c-c> ok, I'm not entirely lost
<RX14> which means much higher overhead
<RX14> especially when the off-the-shelf GC we uses uses concurrent garbage collection
<RX14> so suddenly your singlethreaded process is trying to use 16 threads to GC 1 thread
<RX14> which is... suboptimal
<RX14> it muddies the scheduler
Hey guys, wanted to let you know we have a run going. However, amber did fail. I haven't been able to dig in to the logs so here's the output if you want to take a look: http://sprunge.us/PXUM
Also here's a quick snapshot of Kemalyst vs last round:

I'll drop some of the raw json data here a little later today
nbrady-techempower
on 6 Nov 2017
@nbrady-techempower Thanks for the results. This didn't seem to help.
@faustinoaq @RX14 I think at this point we need to consider reducing the number of processes we launch. Currently we are launching a process per core. WDYT about launching 1/2 to 3/4 that so 1 process for every 2 cores?
drujensen
on 6 Nov 2017
@nbrady-techempower The results of crystal-raw compared to previous round would be great.
We know that crystal itself performs well, perhaps you should focus on reducing garbage allocation throughput inside your frameworks first.
RX14
on 6 Nov 2017
Here's a link to the results.json for the run still in progress. http://sprunge.us/HNHc
nbrady-techempower
on 6 Nov 2017
@nbrady-techempower please can you place a link to the place on the website where you can enter results JSON and visualize it, I seem to have lost my link.
RX14
on 6 Nov 2017
nbrady-techempower
on 6 Nov 2017
@nbrady-techempower it'd be great if there was a link to that somewhere on the site :)
RX14
on 6 Nov 2017
@RX14 Fair point
 msmith-techempower
on 6 Nov 2017
msmith-techempower
on 6 Nov 2017
@RX14 I added it to the readme here which is the best i can do at the moment. I'll make a note of that for the site.
nbrady-techempower
on 6 Nov 2017
Looks like crystal-raw got a pretty good boost there, but all the frameworks still perform terribly. That's very weird, perhaps some more in-person debugging is required. A basic check would be to run only the kemal test, and check htop to see if all the CPU cores are utilised. Apart from that, I can't think what could be the problem that it performs 20x slower...
RX14
on 6 Nov 2017
@RX14 It's interesting because if I run the crystal, kemal, amber tests locally they all come out about the same with raw crystal being about 5% faster. Seems that benchmarking from another computer over the network is what changes that somehow. Not sure why crystal raw would handle it fine but amber and kemal would blow up though.
elorest
on 6 Nov 2017
Two points:
- Making the issue reproducible
- Database calls
Making the issue reproducible
@elorest @drujensen @sdogruyol
What is holding us back from creating the same environment so we can get a feedback loop on fixing things? Is it because it is custom hardware rather than an AWS instance?
@nbrady-techempower - Are there tests planned for AWS (or other providers) - that would be easier to reproduce on our own?
Database calls
TL;DR
If this wasn't already done, using prepared statements for the database queries should really help performance on those tests.
@nbrady-techempower - Are we allowed to use any indexing/tuning strategies that we want on the database?
@RX14 @elorest @drujensen @faustinoaq @sdogruyol
crystal-raw is way faster until a database is involved. It is in the 80%+ range, then drops into the 40% range for reads, then 13.5% for writes. I think this needs to be addressed.
A few questions about this:
- Does this mean crystal-raw could be 2x-20x faster for the database tests?
- Has the database been tuned in any way? Prepared statements, indexing, etc.?
- If these numbers were to be improved would it have to be in
crystal-pgorcrystal-db? Does anyone have time to setup a mysql test?
Single Query:
crystal | 77,224 | 100.0%(40.8%)
kemal (postgresql) | 75,806 | 98.2%(40.0%)
Multiple Queries:
kemal (postgresql) | 3,781 | 100.0%(41.2%)
crystal | 3,745 | 99.0%(40.8%)
Fortunes:
crystal | 88,041 | 100.0%(49.4%)
kemal (postgresql) | 82,572 | 93.8%(46.4%)
Data Updates
crystal | 1,155 | 100.0%(13.5%)
kemal (postgresql) | 1,141 | 98.8%(13.3%)
With no db involved, crystal-raw is 2x-20x faster as RX-14 mentioned:
Plaintext:
crystal | 2,134,425 | 100.0%(83.2%)
kemal (postgresql) | 111,917 | 5.2%(4.4%)
JSON Serialization
crystal | 528,217 | 100.0%(85.5%)
kemal (postgresql) | 192,474 | 36.4%(31.1%)
 marksiemers
on 6 Nov 2017
marksiemers
on 6 Nov 2017
Are we allowed to use any indexing/tuning strategies that we want on the database?
No
Has the database been tuned in any way? Prepared statements, indexing, etc.?
Only primary keys on the index column for each table. Here is the setup for the MySQL database and tables, for reference.
Are there tests planned for AWS (or other providers) - that would be easier to reproduce on our own?
Microsoft Azure, though I am not sure of the specs off hand
msmith-techempower
on 6 Nov 2017
@msmith-techempower - It looks like we can use prepared statements though:
Use of prepared statements for SQL database tests (e.g., for MySQL) is encouraged but not required.
Source: https://www.techempower.com/benchmarks/#section=code
Is that the only thing allowed? Is it allowed for postgres? What about postgresql functions?
marksiemers
on 6 Nov 2017
@marksiemers As far as the specifications go, we can't predict _everything_ someone will come up with to get an edge, but we've done our best to capture everything we don't allow. If you have questions about anything in particular, or if something seems unclear please let us know.
As far as Azure, like @msmith-techempower we don't have specs for those environments off-hand, and to be honest, we're not sure when exactly those will be live.
In the meantime I'm happy to get you any information about our SC environment that we haven't already captured.
nbrady-techempower
on 6 Nov 2017
@marksiemers There's 2 issues here, optimizing crystal-raw and reproducing the problems frameworks have keeping up with crystal-raw. Please keep these issues seperate. Optimizations for crystal-raw would be appreciated (I think the bottleneck is much more around the unoptimized DB driver and connection pool, along with having a connection pool for each of 80 processes), but it's off-topic and distracting for this thread.
It looks like we need to devise some tests for techempower to run on their hardware, since they're the only ones who can reproduce. I offered my suggestion - a quick test to see if all CPU cores were fully utilized.
RX14
on 6 Nov 2017
Just ran the benchmarks locally for crystal-raw, kemal, and amber.
results.json here: http://sprunge.us/iQXe
All passed successfully. (based on commit d7ab76a27e7f830923f8729673ed6ec7fa09f662)
Plaintext:
crystal-raw: 419,614 (100%)
amber: 278,086 (66.2%)
kemal: 245,115 (58.4%)
JSON
crystal-raw: 268,346 (100%)
amber: 206,898 (77.1%)
kemal: 182,925 (68.1%)
db
crystal-raw: 18,625 (100%)
amber: 17,783 (95.4%)
kemal: 16,646 (89.3%)
This is inline with our expectations of at least 50% of crystal-raw's performance.
I looked through the code and the setup.sh between crystal-raw and amber. Nothing stands out to me.
It looks like with server central, these are 40 core machines for the app server. Not that it should have an effect on this crystal vs framework discrepancy, but if we are thinking about not touching all cores, 40 should be the starting point.
marksiemers
on 7 Nov 2017
@marksiemers That is correct and is why our expectation is ~1m requests per second for Amber/Kemal on plaintext and json. We have seen ~1m requests per second using Amber on smaller boxes.
@RX14 is right in that both frameworks are allocating more memory than crystal-raw and we could do better at memory management in both frameworks. It may be that the cause is the GC blocking to perform cleanup more often but I would have expected the same poor performance on smaller boxes, which is not the case.
drujensen
on 7 Nov 2017
@drujensen I think the mix between boxes latency and GC overhead could be the clue of Crystal's framework slowdown.
Maybe fill all cores isn't a good Idea, Maybe the OS also requires some free resources to perform some other operations.
faustinoaq
on 7 Nov 2017
@faustinoaq I think its worth a try. Lets divide the number of processes by 2 and see if that makes an improvement. Do you want to attempt at making the change?
drujensen
on 7 Nov 2017
Let's binary search the right number of cores!
It is still weird that it doesn't reproduce, but definitely worth a shot.
marksiemers
on 7 Nov 2017
https://github.com/TechEmpower/FrameworkBenchmarks/blob/master/frameworks/Crystal/amber/setup.sh#L13
drujensen
on 7 Nov 2017
Looks like the db results for all the crystal ones are pretty slow. Is this because the crystal db driver is just super slow? Seems like it could/should be much higher
 paulcsmith
on 7 Nov 2017
paulcsmith
on 7 Nov 2017
@paulcsmith - See RX-14's comment above about that being a different issue (than framework slowness vs crystal-raw slowness)
That said, I'm looking into it - whether or not prepared statements will help.
But yes, we think either crystal-db or crystal-pg would be the place to address the performance issue.
If you have any thoughts, it merits discussion in crystal's IRC or gitter.
marksiemers
on 7 Nov 2017
Oh I see. I was linked directly to your comment from elsewhere and missed that discussion. Sorry to muddy up this thread! Thanks for linking me to RX14's answer
paulcsmith
on 7 Nov 2017
@nbrady-techempower
I'm running some tests locally in an attempt to figure out how we can fix this.
The tool to see results based on JSON is really helpful, but amber I don't think gets parsed because it has not been part of the official results yet. Is there an easy way for me to fix that? (Hacking on the JS, or otherwise?)
results.json - http://sprunge.us/iQXe
Pasting it here: https://www.techempower.com/benchmarks/#section=test
I can see crystal-raw and kemal results with no problem, but amber doesn't show up. It is a pain to "manually" compute the stats from the JSON, if we can use that tool, that would be a great help.
marksiemers
on 8 Nov 2017
@marksiemers A workaround would be renaming Amber to Kemalyst
faustinoaq
on 8 Nov 2017
@marksiemers No, kemalyst doesn't work, another workaround is renaming Kemal to Kemalyst and Amber to Kemal.
faustinoaq
on 8 Nov 2017
Thanks faustinoaq, that should work for now.
@nbrady-techempower - earlier you posted a comparison output that looked like this:
Is the tool that produced that available to us?
marksiemers
on 8 Nov 2017
@marksiemers No, it's not currently available, but I don't mind taking some screen caps for you if you drop me a few results files to compare.
nbrady-techempower
on 8 Nov 2017
Sure thing - it may not be until tomorrow, I don't want to send you too many, but maybe get the list down to 3-4
marksiemers
on 8 Nov 2017
@nbrady-techempower - I just manually compared some test runs (seeing 25-60% improvements in db benchmarks). Thanks for the screen grab offer, but I don't think it'll be necessary.
What I would like to do is run the tests in a way that more mimics your 3 server setup.
I'm most familiar with AWS, is there a guide on how to get the 3 server setup running "in the cloud"?
I'd like to, so we can try to debug why either adding that many cores or adding that internal network latency is causing the slowness.
In my local testing (a virtual box running on a 2-core Macbook pro), I got ~450K rps.
results here: http://sprunge.us/cTAH
If you want to see the results from that test run for amber using this, use the json below, and anywhere you see "phoenix" - that is amber:
https://www.zerobin.net/?216090c5938d187f#K0gaz8Jxp7MzbjteLW1lSBpT614LSSmdVq4+XiLyIMw=
marksiemers
on 9 Nov 2017
A single machine setup where localhost is the client, server, and database will definitely get you inflated results. I can get faster results on a virtual box vm for most tests because there's no network latency.
The installation guide should work fine for a three machine setup: http://frameworkbenchmarks.readthedocs.io/en/latest/Development/Installation-Guide/
And these are the specs:
http://frameworkbenchmarks.readthedocs.io/en/latest/Project-Information/Environment/
nbrady-techempower
on 9 Nov 2017
But why would network latency affect these frameworks so much but not crystal? All are evented and use the same core HTTP abstraction. It makes little sense.
RX14
on 9 Nov 2017
Doesn't make sense to me either. I don't know what else to tell you guys.
nbrady-techempower
on 9 Nov 2017
@RX14 - I can't wrap my head around it either. I can only speculate that the network latency between the DB and the app server causes a build up of database connections which creates memory bloat and/or GC overhead for the frameworks but somehow not for crystal-raw.
For amber, the connection would be held by the ORM through the models that exist - one of the ways it diverges from crystal raw.
In any case, I think our only option at this point is to guess and check on a 3 server setup. My thoughts on possible guesses:
- Mess with the connection pool settings, relative to the number of processors - perhaps this will save memory bloat and GC overhead (saw 25%-60% performance increase on db benchmarks*)
- Mess with the GC_MARKER number, relative to number of processors - it might take the right balance
- 100% gut everything DB related from kemal and amber, and see if there is still a discrepancy on the 3 server setup for plaintext and JSON.
*Not in an isolated environment, running a virtualbox on my laptop: https://github.com/marksiemers/FrameworkBenchmarks/commit/50811f9f8712b2015ef96c073fbdde8f3125a82a
marksiemers
on 9 Nov 2017
@nbrady-techempower Thank you for your help and patience.
Do you have a schedule for the next preview run and next official run?
marksiemers
on 9 Nov 2017
@marksiemers forget ENTIRELY about the DB. The frameworks lag in the plaintext test which never even touches the DB.
RX14
on 9 Nov 2017
I propose 3 tests that the techempower guys could run to help us troubleshoot this:
- run a benchmark and view the CPU utilization in htop, is every core being utilized? Is each crystal process running at 100% load?
- run only the HTTP plaintext test of amber, without running the DB-touching tests, and see if there's a performance difference.
- run the test on port 8080 similar to crystal-raw, instead of 3000 which the other frameworks use.
RX14
on 9 Nov 2017
@RX14 It's unlikely that we'll be able to do those for you soon, since our SC environment is currently doing continuous benchmarking. We're trying to get a preview out asap while working on some other things internally. If we do bring the continuous run to a stop at some point, I'll see if I can squeeze that in for you but you would be better off trying to set up a similar environment.
nbrady-techempower
on 9 Nov 2017
@nbrady-techempower - For the 3 tests proposed by RX14, do you need anything from us, in case the opportunity opens up?
marksiemers
on 9 Nov 2017
@markseimers no, but as I pointed out earlier in this thread, amber is not passing in that environment and the logs didn't provide an immediate clue as to why. You're also welcome to make a pull request to change the ports, that would show up in a run over the weekend.
nbrady-techempower
on 9 Nov 2017
That error, I also haven't been able to reproduce, unfortunately.
The good news is, since kemal is experiencing the same issue. If we solve it for that, hopefully, it will be the same fix for amber.
marksiemers
on 9 Nov 2017
@nbrady-techempower - Does the PR have to be merged in, or will each open PR be run this weekend?
If each open PR is run, is it ok to open multiple PRs for the crystal frameworks? To test different hypotheses about how to fix the discrepancy between crystal-raw, kemal, and amber.
marksiemers
on 10 Nov 2017
@marksiemers Unfortunately it has to be merged in, and a continuous run takes about 4 days to fully complete.
nbrady-techempower
on 10 Nov 2017
Here are the kemal results from the weekend. They look very much inline with the results I posted last week. Looks like the port did not make any difference.

nbrady-techempower
on 13 Nov 2017
@nbrady-techempower - Thank you for the prompt update. If you have any info to comment correct my hypothesis below, please weigh in.
Also, is there any time this week to try any of @RX14 suggestions of htop and/or not running the db tests for kemal and amber?
@RX14 - I know you're going to kill me if I say database one more time, but in the absence of other ideas, what about this hypotheses:
- At least one of the database tests run before the plaintext and json tests
- There is no db connection limit, then each running process (80 of them) are all trying to create an "unlimited" number of connections to postgres. Postgres gets slammed and takes a long time to return any data.
- Those connections remain in memory, not idle, but waiting for a response. This either eats all the memory and/or causes hell for the GC.
- For some reason (ORM for amber,
get(path, &block)for kemal), These memory problems occur only in the frameworks because those connections stay in scope.
Admittedly, this is grabbing at straws, but I'm not sure what else to look for.
AFAIK, setting a connection limit in the database url does no harm (with local testing).
@RX14 @sdogruyol @drujensen
Given that, does anyone think it is worth a shot (tweaking db connection settings)?
marksiemers
on 13 Nov 2017
@marksiemers @RX14 Do me a favor if you could. Fork the repo and create a branch for each different test configuration you'd like to test against. Don't open any PR's here for them, just point me to the repo with all the different configurations, and I'll see if I can get you some results for each branch. Please don't modify anything but the tests you'd like to run. The current run should finish tomorrow or Wednesday, and I'll see what I can do for you.
nbrady-techempower
on 13 Nov 2017
@nbrady-techempower @RX14 @drujensen @marksiemers
What thing that stands out to me when reading through, the backlog of comments and things that have been tried and assumed, is that; If this was a GC issue we should also see the same errors while benchmarking on the same servers. @drujensen and I tested on a 36 core server and didn't have any issues.
Also since each core is running it's own process having more cores shouldn't increase the garbage collection issues across all processes unless of course they somehow used all the memory or something.
It's weird that adding a tiny bit of local network latency would drop the results so dramatically, since it doesn't with crystal raw.
Just things to think about that might help.
elorest
on 13 Nov 2017
@nbrady-techempower - Sure thing. What timeframe are you expecting?
marksiemers
on 13 Nov 2017
@marksiemers I can fit it in on Wednesday morning probably.
nbrady-techempower
on 14 Nov 2017
EDIT: See more recent comment with the updated branch list.
@nbrady-techempower
Here is the fork: https://github.com/marksiemers/FrameworkBenchmarks
There are three branches to test if you have time:
- max-pool-2-per-process
- max-pool-2x-cpus
- use-half-cpus
I tested all of them locally in verify mode, and everything passed, so hopefully, there won't be any issues running the benchmarks.
marksiemers
on 15 Nov 2017
I don't know if we want to set the GC_MARKERS to 40. Wouldn't that launch 40 threads per process so 40x40=1600 threads? Or is this setting somehow shared between processes?
What if we set this to 2? 40x2 = 80.
drujensen
on 15 Nov 2017
@drujensen - I don't know what we want to do at all. What we've tried up this this point hasn't worked. I'm trying not to out-smart myself, and just trying to gather data about what does and doesn't work.
That said, if you think that will make a difference, I've given you access to that fork. You can add a branch or modify use-half-cpus
marksiemers
on 15 Nov 2017
@marksiemers ok, i updated the GC_MARKERS=2 for all three frameworks. I also changed Crystal Raw to only use half the processors so we have something to compare against.
drujensen
on 15 Nov 2017
@drujensen @marksiemers The current run still has ~11 hours left. If you need to get anything else in to that repo, you've got some time. I'll get you some numbers tomorrow morning.
nbrady-techempower
on 15 Nov 2017
@RX14 - Any additional ideas?
Both kemal and amber use radix for routing while crystal uses a case statement. It hasn't caused issues in our testing, but maybe it makes a difference in the TechEmpower environment.
marksiemers
on 15 Nov 2017
@marksiemers you're right, I compared round 15 preview 2 results again and again and I have concluded:
Database tests
amber and kemal are very similar to crystal-raw on database test. I think because databases are the main overhead, no problem here 👍 results are aceptable


Plaintext & Json
However, on the highest RPS tests (plaintext, json) crystal-raw has a huge difference from amber & kemal. Maybe current router radix algorithm implementation by @luislavena is causing some overhead resolving simple paths like /plaintext & /json. I think we can use a handler with context.request.path == "/plaintext" instead of radix algorithm to catch those tests in both kemal & amber. WDYT @sdogruyol ?


faustinoaq
on 15 Nov 2017
@faustinoaq why do you think its the radix algorithm? Is there something blocking or doing something that makes you suspect it is causing this issue?
drujensen
on 15 Nov 2017
EDIT: Or you can be smart like @faustinoaq and benchmark case vs radix
@drujensen - Since we can't reproduce the issue, we don't have any "evidence" of what is causing it.
I've been trying to approach it more from a deduction strategy rather than debugging - since we don't really have debugging tools available at this point. Or, if you like, the Gregory House approach - just start treatment and see if it gets better.
All we can do is look at what is different between crystal-raw and the same with amber and kemal.
For plaintext and json, that list isn't too big. Routing is one. For radix, the cost in time for me to learn exactly how that shard works and speculate about what might go wrong is a relatively high cost.
The cost of coding a handler that responds before the router is touched is relatively low - and the outcome won't be hypothetical - it will be real (well as real as benchmarks can be).
@faustinoaq - Do you already have in mind how to code this?
marksiemers
on 15 Nov 2017
@drujensen Yeah, I compared radix vs switch statement (aka case) used by crystal-raw here and the results say radix is almost 80x slower than a case statement finding a simple path like /plaintext
require "benchmark"
require "radix"

Tree = Radix::Tree(Symbol).new
Tree.add "/plaintext", :plaintext

def radix(path)
  Tree.find(path).found?
end

def switch(path)
  case path
  when "/plaintext" then true
  end
end

pp radix("/plaintext")  # => true
pp switch("/plaintext") # => true

Benchmark.ips do |x|
  x.report("radix") do
    radix("/plaintext")
  end
  x.report("switch") do
    switch("/plaintext")
  end
end
$ crystal build --release --no-debug -s radix_vs_switch.cr
Parse:                             00:00:00.0019190 (   0.19MB)
Semantic (top level):              00:00:00.2499810 (  28.12MB)
Semantic (new):                    00:00:00.0012620 (  28.12MB)
Semantic (type declarations):      00:00:00.0216570 (  36.12MB)
Semantic (abstract def check):     00:00:00.0026250 (  36.12MB)
Semantic (ivars initializers):     00:00:00.0032640 (  36.12MB)
Semantic (cvars initializers):     00:00:00.0168870 (  36.12MB)
Semantic (main):                   00:00:00.2823110 (  68.12MB)
Semantic (cleanup):                00:00:00.0010590 (  68.12MB)
Semantic (recursive struct check): 00:00:00.0008610 (  68.12MB)
Codegen (crystal):                 00:00:00.3289690 (  68.18MB)
Codegen (bc+obj):                  00:00:18.9583230 (  68.18MB)
Codegen (linking):                 00:00:00.1888350 (  68.18MB)

Codegen (bc+obj):
 - no previous .o files were reused
$ ./radix_vs_switch
radix("/plaintext") # => true
switch("/plaintext") # => true
 radix   2.12M (471.24ns) (± 6.11%) 87.19× slower
switch 185.03M (   5.4ns) (±11.41%)       fastest
$ ./radix_vs_switch
radix("/plaintext") # => true
switch("/plaintext") # => true
 radix   1.91M (524.01ns) (±14.57%) 100.87× slower
switch  192.5M (  5.19ns) (±11.91%)        fastest
$ ./radix_vs_switch
radix("/plaintext") # => true
switch("/plaintext") # => true
 radix   2.17M (460.29ns) (±17.94%) 83.85× slower
switch 182.18M (  5.49ns) (±10.95%)       fastest
See more result 👉 https://gist.github.com/faustinoaq/896f821f47711c6c059c5eca23030a42
faustinoaq
on 15 Nov 2017
@faustinoaq @marksiemers Ok, That makes sense. I didn't realize it was that much slower. I understand where your heading and think the test has some validity. If we find that radix is the cause, we can look at fixing it or replacing it.
drujensen
on 15 Nov 2017
Assuming this is our smoking gun, this is a great lesson learned.
In fact, it may inform some design decisions with amber - like our static routes - we may want to bypass or intercept a request before it hits the router.
What is still bizarre is that we didn't see the same slowdown in our tests.
@faustinoaq - What hardware did you run your tests on? Can you reproduce the TFB slowness on that machine?
marksiemers
on 15 Nov 2017
Interesting findings @faustinoaq.
I think comparing a simple case statement with any URL-parsing/matching mechanism will not be fair, being that mechanism powered by Radix or any other library (🍎 != 🍊).
For example, Radix allocates several instances of Char::Reader during lookup which might add GC pressure.
In my tests, the difference between Radix and case statements gets reduced by disabling GC (GC.disable).
Definitely there is room for improvement in Radix, as the information shows here.
Cheers.
 luislavena
on 15 Nov 2017
luislavena
on 15 Nov 2017
For the record, when I add all the routes for the benchmarks and build with the --release flag, I'm getting a 200x + difference:
$ shards build --release
...
$ ./bin/benchmarks
radix("/plaintext") # => true
switch("/plaintext") # => true
 radix   1.94M (516.29ns) (± 3.13%) 220.68× slower
switch 427.44M (  2.34ns) (± 8.93%)        fastest
radix("/json") # => true
switch("/json") # => true
 radix   1.71M (585.75ns) (± 3.79%) 248.90× slower
switch 424.92M (  2.35ns) (± 9.49%)        fastest

$ ./bin/benchmarks
radix("/plaintext") # => true
switch("/plaintext") # => true
 radix   1.94M ( 515.4ns) (± 2.90%) 220.19× slower
switch 427.22M (  2.34ns) (± 8.62%)        fastest
radix("/json") # => true
switch("/json") # => true
 radix   2.08M (479.87ns) (± 3.61%) 205.02× slower
switch 427.24M (  2.34ns) (± 8.77%)        fastest

$ ./bin/benchmarks
radix("/plaintext") # => true
switch("/plaintext") # => true
 radix   1.96M (511.16ns) (± 4.04%) 217.59× slower
switch 425.67M (  2.35ns) (± 9.32%)        fastest
radix("/json") # => true
switch("/json") # => true
 radix   2.08M (480.62ns) (± 4.09%) 205.62× slower
switch 427.82M (  2.34ns) (± 8.83%)        fastest
I'm curious how much of a difference this would make in practice. Radix still pulls off a couple million in half a microsecond, so it seems like it should make little different in each request. But maybe it's the object allocations that are the issue. I think it is definitely worth testing out
paulcsmith
on 15 Nov 2017
@luislavena Thank you for your comment! You're right about 🍎 != 🍊, is very unfair compare radix to case statement. Of course radix have a cool features like /path/:id and /path/*, etc.
Do you think we can improve radix for simple paths without symbols : or * ?
something like:
unless found_special_symbols_in_path
  case path
  when "/simple"
  # do something
  end
end
@luislavena
I think comparing a simple case statement with any URL-parsing/matching mechanism will not be fair
Agreed. and I think this particular set of paths is worst case scenario for a radix tree:
Tree = Radix::Tree(Symbol).new
Tree.add "/json", :json
Tree.add "/plaintext", :plaintext
Tree.add "/db", :db
Tree.add "/queries", :queries
Tree.add "/fortunes", :fortunes
Tree.add "/updates", :updates
Radix will remain very valuable - especially for a full blown RESTful app with hundreds of routes.
Optimizing for this kind of scenario (simple path, very high rps) it seems it is not the best tool.
I'm guessing the compiler optimizations can do a lot with those case statements - likely everything on the stack, vs the Radix tree would end up on the heap, right?
I have a local repo with the tests, would you like access to it - just in case (no pun intended), it can inform some optimizations in radix?
marksiemers
on 15 Nov 2017
Do you think we can improve radix for simple paths without symbols
:or*?
I don't think that will be possible. Radix was originally extracted from an internal project that deals with 280+ routes (mostly GET and POST) and showed great performance compared with linear approach.
The original design was aimed to build big trees and compare, character by character and return earlier when required.
Adding a separate structure to deal with non-dynamic parts might be tricky, not to mention the cases that /something (static) and /something/:id (dynamic) will need to co-exist.
@marksiemers feel free to submit any code samples or research around Radix directly to the project, here:
https://github.com/luislavena/radix
Cheers.
luislavena
on 15 Nov 2017
@luislavena maybe we can extend the current Radix tree implementation to be an Adaptive Radix Tree see https://github.com/armon/libart and https://db.in.tum.de/~leis/papers/ART.pdf
Art should perform faster or as fast as a Hash table without the limitations.
 eliasjpr
on 15 Nov 2017
eliasjpr
on 15 Nov 2017
Thank you @eliasjpr, will take a look to the paper.
Please note that neither a Radix Tree or ART by default will handle dynamic values that needs to be extracted from the trees. That is one of the main differences between a simple Radix implementation and a Radix routing library like the one I shared.
Cheers.
luislavena
on 15 Nov 2017
So how come we still can't reproduce this locally? Radix doesn't explain that.
RX14
on 15 Nov 2017
@RX14 Maybe because we haven't tested it locally against powerful machines like TechEmpower have
faustinoaq
on 16 Nov 2017
@nbrady-techempower - Updated list of branches
Here is the fork: https://github.com/marksiemers/FrameworkBenchmarks
Branches to test (in priority order)
- ms/add-fast-pipe
- Can be tested only against plaintext and JSON serialization (if that is easier)
- https://github.com/marksiemers/FrameworkBenchmarks/tree/ms/add-fast-pipe
- max-pool-2-per-process
- max-pool-2x-cpus
- use-half-cpus
Regarding the radix hypothesis. For amber, we were not able to bypass it completely (yet). However when testing the change with the Fast pipe locally - we got relatively better performance vs kemal (with no changes) - 100% crystal-raw, 80% amber, 52% kemal)
marksiemers
on 16 Nov 2017
How about a crystal-raw version that uses radix? Should provide a lot of insight into the problem. Is be willing to make a more performant router if that turns out to be the problem.
RX14
on 22 Nov 2017
@RX14 I was thinking the same thing, approach the issue from the other direction. I'm thinking create another folder for "crystal-radix" so the existing crystal-raw isn't lost.
marksiemers
on 22 Nov 2017
@marksiemers Just create another file in the crystal-raw folder, and another empty to the manifest. That's how it's typically done.
RX14
on 22 Nov 2017
Hi, I've seen preview 3 results, Why amber didn't complete?, I thought amber was passing Travis CI 😞
@nbrady-techempower Does round 15 could have a preview 4? Please 🙏 😅
faustinoaq
on 24 Nov 2017
Amber is fixed now https://github.com/TechEmpower/FrameworkBenchmarks/pull/3092
Please review it @elorest @drujensen @eliasjpr 💯
I'll say amber & kemal slowdown compared with crystal-raw is not because server configuration but because small performance issues we have on our frameworks, something like a extra allocated memory would be imperceptible on some tests, however on Big tests like TFB some things could behave different.
I'll recommend to close this issue and maybe open it again on the future when crystal become more mature and our db connectors would be more optimized,
faustinoaq
on 24 Nov 2017
I'll say amber & kemal slowdown compared with crystal-raw is not because server configuration but because small performance issues we have on our frameworks, something like a extra allocated memory
@faustinoaq I wouldn't jump to this conclusion just yet. It's true that Amber and Kemal are consuming more resources than crystal raw, but we currently don't know that the performance issue is not properly configuring resource constraints to handle the extra resource consumption.
as @RX14 suggested, without resource metrics during execution of the tests like cpu, memory, network, io, etc, we are currently in the dark about what is causing the drastic difference. Hopefully we will be able to glean some insight from running the branches we created.
drujensen
on 24 Nov 2017
@drujensen @RX14 - Request for input on this test for using radix with crystal: https://github.com/marksiemers/FrameworkBenchmarks/tree/add-crystal-radix/frameworks/Crystal/crystal-radix
PR in my fork here: https://github.com/marksiemers/FrameworkBenchmarks/pull/3
@RX14 - I wasn't totally clear on how to create a separate test with this suggestion:
Just create another file in the crystal-raw folder, and another empty to the manifest.
So it is in a separate Crystal/crystal-radix folder, but if there is an example of putting it the same folder, and that is preferred, I can move it.
Also, is there anything else that we want to test? Essentially stepping toward kemal/amber - using classes or structs to hold routes, etc.
marksiemers
on 24 Nov 2017
Also, is there anything else that we want to test? Essentially stepping toward kemal/amber - using classes or structs to hold routes, etc.
Can we use structs? I thought it was imposible 😅
faustinoaq
on 25 Nov 2017
The Frameworks are obviously doing more per request than raw crystal. This is shown in an expected fashion when running wrk on the same machine.
It seems highly unlikely to me that the difference is due to GC, radix or procs. I base this on the fact that when we run the benchmarks on the same server as the webapp it runs extremely fast 80-90% of the speed of crystal-raw. This is true for 32 Core servers and Vagrant on my imac.
One difference between those tests and TechEmpower is that wrk is running on a different computer. Added network latency could result in lower requests per second, but how would it result in really fast for crystal-raw and slow for amber, kemal, kemalyst? Presumably the network latency would effect all 4 examples in a similar way, since decoding the requests and creating filehandlers is done in exactly the same way.
What are we missing here? @nbrady-techempower @RX14 @marksiemers @faustinoaq @drujensen @sdogruyol
elorest
on 26 Nov 2017
Some logs for reference. Thanks to @faustinoaq
amber
http://tfb-logs.techempower.com/round-15/preview-2/amber/plaintext/stats.txt
http://tfb-logs.techempower.com/round-15/preview-2/amber/out.txt
crystal-raw
http://tfb-logs.techempower.com/round-15/preview-2/crystal-raw/plaintext/stats.txt
http://tfb-logs.techempower.com/round-15/preview-2/crystal-raw/out.txt
kemal
http://tfb-logs.techempower.com/round-15/preview-2/kemal/plaintext/stats.txt
http://tfb-logs.techempower.com/round-15/preview-2/kemal/out.txt
marksiemers
on 26 Nov 2017
Hey guys, here's some results after merging in #3094
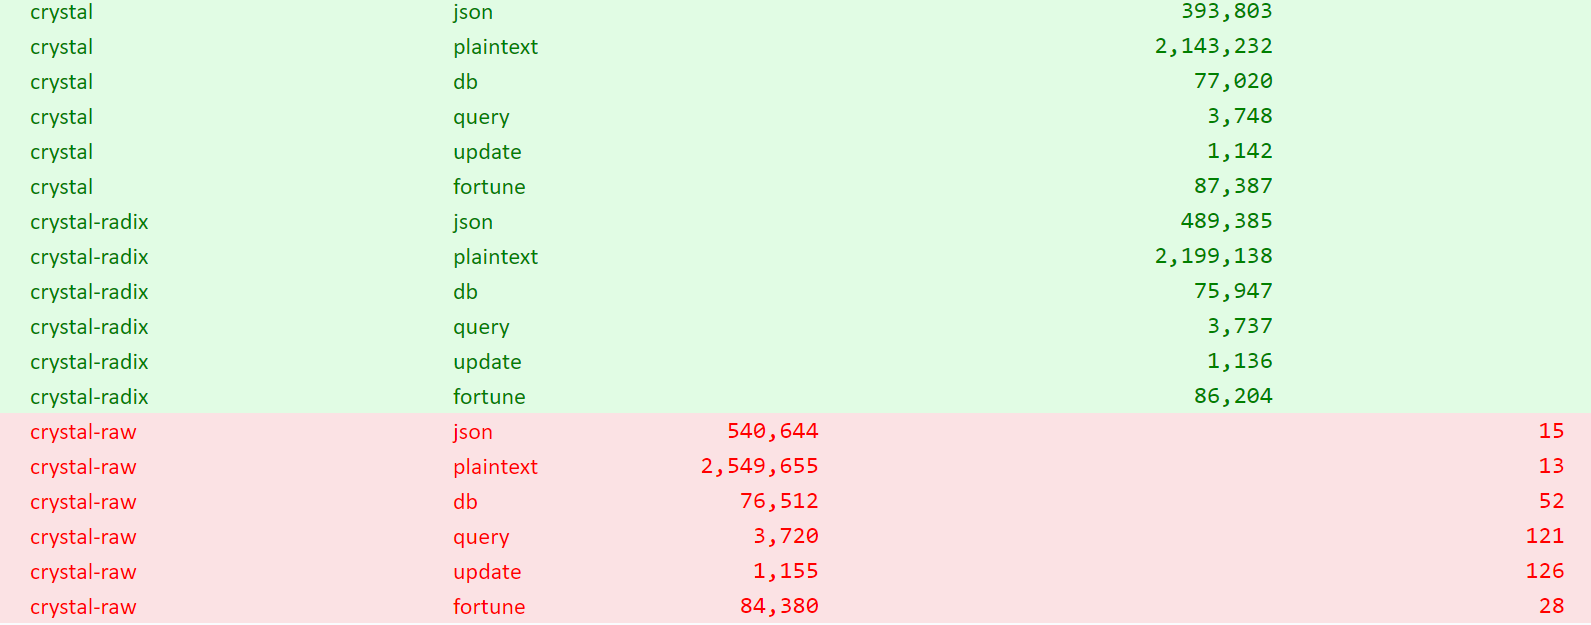
Haven't reached kemal yet. Also, amber is still failing and that's with the recent fix.
nbrady-techempower
on 27 Nov 2017
thanks @nbrady-techempower. Looks like Radix is not the issue if we are seeing better performance with it than without.
drujensen
on 27 Nov 2017
thanks @nbrady-techempower Yeah, radix isn't the issue, like I commented before https://github.com/TechEmpower/FrameworkBenchmarks/pull/3092#issue-276538144
Also, amber is still failing and that's with the recent fix.
But amber passed Travis, Can you share us some amber logs to see what is happening? 😅
faustinoaq
on 27 Nov 2017
By example on preview 3, amber was failing because dependency mismatch:
Setup amber: Outdated shard.lock (kilt requirements changed). Please run shards update instead.
See: http://tfb-logs.techempower.com/round-15/preview-3/amber/out.txt
faustinoaq
on 27 Nov 2017
@faustinoaq I haven't looked through it yet but here it is: http://sprunge.us/KHhc
nbrady-techempower
on 27 Nov 2017
Thank you @nbrady-techempower , The logs look good, amber servers were running, Can you share us fortune/raw.txt output for amber?
By example on preview 2 (amber failed on preview 3 because dependency mismatch) 👉 http://tfb-logs.techempower.com/round-15/preview-2/amber/fortune/raw.txt
faustinoaq
on 28 Nov 2017
@faustinoaq The raw.txt is empty.
[Amber 0.3.6] serving application "TFB test app" at http://127.0.0.1:8080 looks like you're only accepting requests from localhost, yeah? Should probably be http://0.0.0.0:8080
nbrady-techempower
on 28 Nov 2017
Thank you @nbrady-techempower , you're right, we are running on localhost, let us fix that 👍
faustinoaq
on 28 Nov 2017
Hi @nbrady-techempower can you confirm us amber is working with latest PR? 😅
faustinoaq
on 29 Nov 2017
Another (somewhat unrelated) request that should probably go on the mailinglist, but please could you try adding >256 connections concurrency for the JSON benchmark.
From the latest crystal-raw JSON latency distributions:
  Latency Distribution
     50%  399.00us
     75%  456.00us
     90%  493.00us
     99%  722.00us
We're still in the microsecond range. This indicates to me that we're not fully loaded. How about a 512 connections tier? Maybe even 1024? It'd be an interesting standalone test at least to see where the peak is.
RX14
on 29 Nov 2017
@faustinoaq yes, amber is passing now.

  {
  "environmentDescription": "ServerCentral",
  "cachedQueryIntervals": [
    1,
    10,
    20,
    50,
    100
  ],
  "uuid": "45f3505d-d845-4d31-9bee-de8d24e3371b",
  "succeeded": {
    "fortune": [
      "amber"
    ],
    "plaintext": [
      "amber"
    ],
    "db": [
      "amber"
    ],
    "update": [
      "amber"
    ],
    "json": [
      "amber"
    ],
    "query": [
      "amber"
    ],
    "cached_query": []
  },
  "frameworks": [
    "amber"
  ],
  "verify": {
    "amber": {
      "fortune": "pass",
      "plaintext": "pass",
      "db": "pass",
      "update": "pass",
      "json": "pass",
      "query": "pass"
    }
  },
  "completionTime": 1511969452271,
  "name": "Continuous Benchmarking Run 2017-11-29",
  "failed": {
    "fortune": [],
    "plaintext": [],
    "db": [],
    "update": [],
    "json": [],
    "query": [],
    "cached_query": []
  },
  "pipelineConcurrencyLevels": [
    256,
    1024,
    4096,
    16384
  ],
  "rawData": {
    "fortune": {
      "amber": [
        {
          "latencyAvg": "524.46us",
          "latencyMax": "2.02ms",
          "latencyStdev": "63.93us",
          "totalRequests": 229702,
          "startTime": 1511969263,
          "endTime": 1511969278
        },
        {
          "latencyAvg": "0.86ms",
          "latencyMax": "8.39ms",
          "latencyStdev": "0.88ms",
          "totalRequests": 371285,
          "startTime": 1511969280,
          "endTime": 1511969295
        },
        {
          "latencyAvg": "1.26ms",
          "latencyMax": "19.36ms",
          "latencyStdev": "1.71ms",
          "totalRequests": 645182,
          "startTime": 1511969297,
          "endTime": 1511969312
        },
        {
          "latencyAvg": "3.66ms",
          "latencyMax": "75.70ms",
          "latencyStdev": "6.66ms",
          "totalRequests": 922583,
          "startTime": 1511969314,
          "endTime": 1511969330
        },
        {
          "latencyAvg": "18.24ms",
          "latencyMax": "224.95ms",
          "latencyStdev": "32.11ms",
          "totalRequests": 1078318,
          "startTime": 1511969332,
          "endTime": 1511969347
        },
        {
          "latencyAvg": "76.31ms",
          "latencyMax": "567.12ms",
          "latencyStdev": "115.80ms",
          "totalRequests": 1176252,
          "startTime": 1511969349,
          "endTime": 1511969364
        }
      ]
    },
    "plaintext": {
      "amber": [
        {
          "latencyAvg": "23.04ms",
          "latencyMax": "108.12ms",
          "latencyStdev": "12.20ms",
          "totalRequests": 1456812,
          "startTime": 1511969397,
          "endTime": 1511969412
        },
        {
          "latencyAvg": "90.05ms",
          "latencyMax": "436.02ms",
          "latencyStdev": "53.66ms",
          "totalRequests": 1613637,
          "startTime": 1511969414,
          "endTime": 1511969429
        },
        {
          "latencyAvg": "338.39ms",
          "latencyMax": "1.01s",
          "latencyStdev": "182.58ms",
          "totalRequests": 1609790,
          "startTime": 1511969431,
          "endTime": 1511969446
        },
        {
          "latencyAvg": "1.32s",
          "latencyMax": "3.69s",
          "latencyStdev": "702.30ms",
          "totalRequests": 1581242,
          "startTime": 1511969448,
          "endTime": 1511969464
        }
      ]
    },
    "slocCounts": {},
    "db": {
      "amber": [
        {
          "latencyAvg": "475.17us",
          "latencyMax": "3.02ms",
          "latencyStdev": "51.89us",
          "totalRequests": 253497,
          "startTime": 1511968762,
          "endTime": 1511968777
        },
        {
          "latencyAvg": "718.03us",
          "latencyMax": "14.65ms",
          "latencyStdev": "835.69us",
          "totalRequests": 460689,
          "startTime": 1511968779,
          "endTime": 1511968794
        },
        {
          "latencyAvg": "1.10ms",
          "latencyMax": "24.79ms",
          "latencyStdev": "1.83ms",
          "totalRequests": 796984,
          "startTime": 1511968796,
          "endTime": 1511968812
        },
        {
          "latencyAvg": "4.78ms",
          "latencyMax": "97.64ms",
          "latencyStdev": "9.47ms",
          "totalRequests": 897016,
          "startTime": 1511968814,
          "endTime": 1511968829
        },
        {
          "latencyAvg": "21.81ms",
          "latencyMax": "232.50ms",
          "latencyStdev": "38.33ms",
          "totalRequests": 961393,
          "startTime": 1511968831,
          "endTime": 1511968846
        },
        {
          "latencyAvg": "97.01ms",
          "latencyMax": "626.19ms",
          "latencyStdev": "145.78ms",
          "totalRequests": 990858,
          "startTime": 1511968848,
          "endTime": 1511968863
        }
      ]
    },
    "update": {
      "amber": [
        {
          "latencyAvg": "18.66ms",
          "latencyMax": "269.65ms",
          "latencyStdev": "21.64ms",
          "totalRequests": 269283,
          "startTime": 1511969147,
          "endTime": 1511969162
        },
        {
          "latencyAvg": "65.71ms",
          "latencyMax": "343.56ms",
          "latencyStdev": "36.82ms",
          "totalRequests": 59668,
          "startTime": 1511969164,
          "endTime": 1511969179
        },
        {
          "latencyAvg": "127.01ms",
          "latencyMax": "420.52ms",
          "latencyStdev": "51.52ms",
          "totalRequests": 30230,
          "startTime": 1511969181,
          "endTime": 1511969196
        },
        {
          "latencyAvg": "188.11ms",
          "latencyMax": "518.56ms",
          "latencyStdev": "62.69ms",
          "totalRequests": 20294,
          "startTime": 1511969198,
          "endTime": 1511969213
        },
        {
          "latencyAvg": "249.85ms",
          "latencyMax": "628.38ms",
          "latencyStdev": "73.31ms",
          "totalRequests": 15237,
          "startTime": 1511969215,
          "endTime": 1511969230
        }
      ]
    },
    "json": {
      "amber": [
        {
          "latencyAvg": "133.25us",
          "latencyMax": "3.54ms",
          "latencyStdev": "37.60us",
          "totalRequests": 908985,
          "startTime": 1511968896,
          "endTime": 1511968911
        },
        {
          "latencyAvg": "135.27us",
          "latencyMax": "2.69ms",
          "latencyStdev": "34.37us",
          "totalRequests": 1782588,
          "startTime": 1511968913,
          "endTime": 1511968928
        },
        {
          "latencyAvg": "190.26us",
          "latencyMax": "6.19ms",
          "latencyStdev": "90.89us",
          "totalRequests": 2543844,
          "startTime": 1511968930,
          "endTime": 1511968946
        },
        {
          "latencyAvg": "585.65us",
          "latencyMax": "5.03ms",
          "latencyStdev": "158.96us",
          "totalRequests": 1644737,
          "startTime": 1511968948,
          "endTime": 1511968963
        },
        {
          "latencyAvg": "1.22ms",
          "latencyMax": "21.07ms",
          "latencyStdev": "581.19us",
          "totalRequests": 1593542,
          "startTime": 1511968965,
          "endTime": 1511968980
        },
        {
          "latencyAvg": "2.34ms",
          "latencyMax": "32.34ms",
          "latencyStdev": "1.21ms",
          "totalRequests": 1690872,
          "startTime": 1511968982,
          "endTime": 1511968997
        }
      ]
    },
    "commitCounts": {
      "Amber": 8
    },
    "query": {
      "amber": [
        {
          "latencyAvg": "97.93ms",
          "latencyMax": "593.13ms",
          "latencyStdev": "146.86ms",
          "totalRequests": 994537,
          "startTime": 1511969030,
          "endTime": 1511969045
        },
        {
          "latencyAvg": "112.85ms",
          "latencyMax": "641.88ms",
          "latencyStdev": "163.06ms",
          "totalRequests": 199587,
          "startTime": 1511969047,
          "endTime": 1511969063
        },
        {
          "latencyAvg": "124.90ms",
          "latencyMax": "664.08ms",
          "latencyStdev": "171.56ms",
          "totalRequests": 98709,
          "startTime": 1511969065,
          "endTime": 1511969080
        },
        {
          "latencyAvg": "136.20ms",
          "latencyMax": "727.26ms",
          "latencyStdev": "177.31ms",
          "totalRequests": 65033,
          "startTime": 1511969082,
          "endTime": 1511969097
        },
        {
          "latencyAvg": "148.02ms",
          "latencyMax": "774.96ms",
          "latencyStdev": "177.74ms",
          "totalRequests": 48387,
          "startTime": 1511969099,
          "endTime": 1511969114
        }
      ]
    },
    "cached_query": {}
  },
  "startTime": 1511968483678,
  "duration": 15,
  "queryIntervals": [
    1,
    5,
    10,
    15,
    20
  ],
  "completed": {
    "amber": "20171129093049"
  },
  "concurrencyLevels": [
    8,
    16,
    32,
    64,
    128,
    256
  ]
}
It seems like a lot of work has been committed on the crystal frameworks mentioned here - can this issue be closed?
msmith-techempower
on 9 Jan 2018
Yeah I think this can be closed for now. Let us know if you guys need anything else from us.
nbrady-techempower
on 9 Jan 2018

Oh, yeah! Now looks like Amber is as fast as crystal on TFB :tada: :smile:
Ref: Results
Ref: Citrine Build
faustinoaq
on 16 May 2018
Related issues
 bgrainger
·
5Comments
bgrainger
·
5Comments
 Kaliumhexacyanoferrat
·
4Comments
msmith-techempower
·
6Comments
Kaliumhexacyanoferrat
·
4Comments
msmith-techempower
·
6Comments
 zloster
·
8Comments
zloster
·
8Comments
 MatheusRV
·
3Comments
MatheusRV
·
3Comments
Most helpful comment
@drujensen Yeah, I compared radix vs switch statement (aka case) used by crystal-raw here and the results say radix is almost 80x slower than a case statement finding a simple path like
/plaintextSee more result 👉 https://gist.github.com/faustinoaq/896f821f47711c6c059c5eca23030a42