Flux: Provide Grafana Dashboard with Flux Prometheus metrics
Users have been requesting a Grafana dashboard for quite a while (see https://github.com/fluxcd/flux/issues/385 ).
There is an unofficial (outdated) dashboard at https://grafana.com/grafana/dashboards/10475 but maybe we should supply an official one.
Further information about metrics https://docs.fluxcd.io/en/1.17.1/references/monitoring.html
 2opremio
All 7 comments
To keep the dashboards up to date along with new metrics we should probably use something like https://github.com/weaveworks/grafanalib or https://github.com/jkcfg/grafana
2opremio
on 28 Jan 2020
I see the value of using something like grafanalib to create the dashboard, but I believe is going to create more complexity (setting up python env, generating the dashboard json, etc) than helping us to make easier to keep it updated.
btw, I'm happy to work on that if there is no one yet.
 lucasvmiguel
on 26 Jun 2020
lucasvmiguel
on 26 Jun 2020
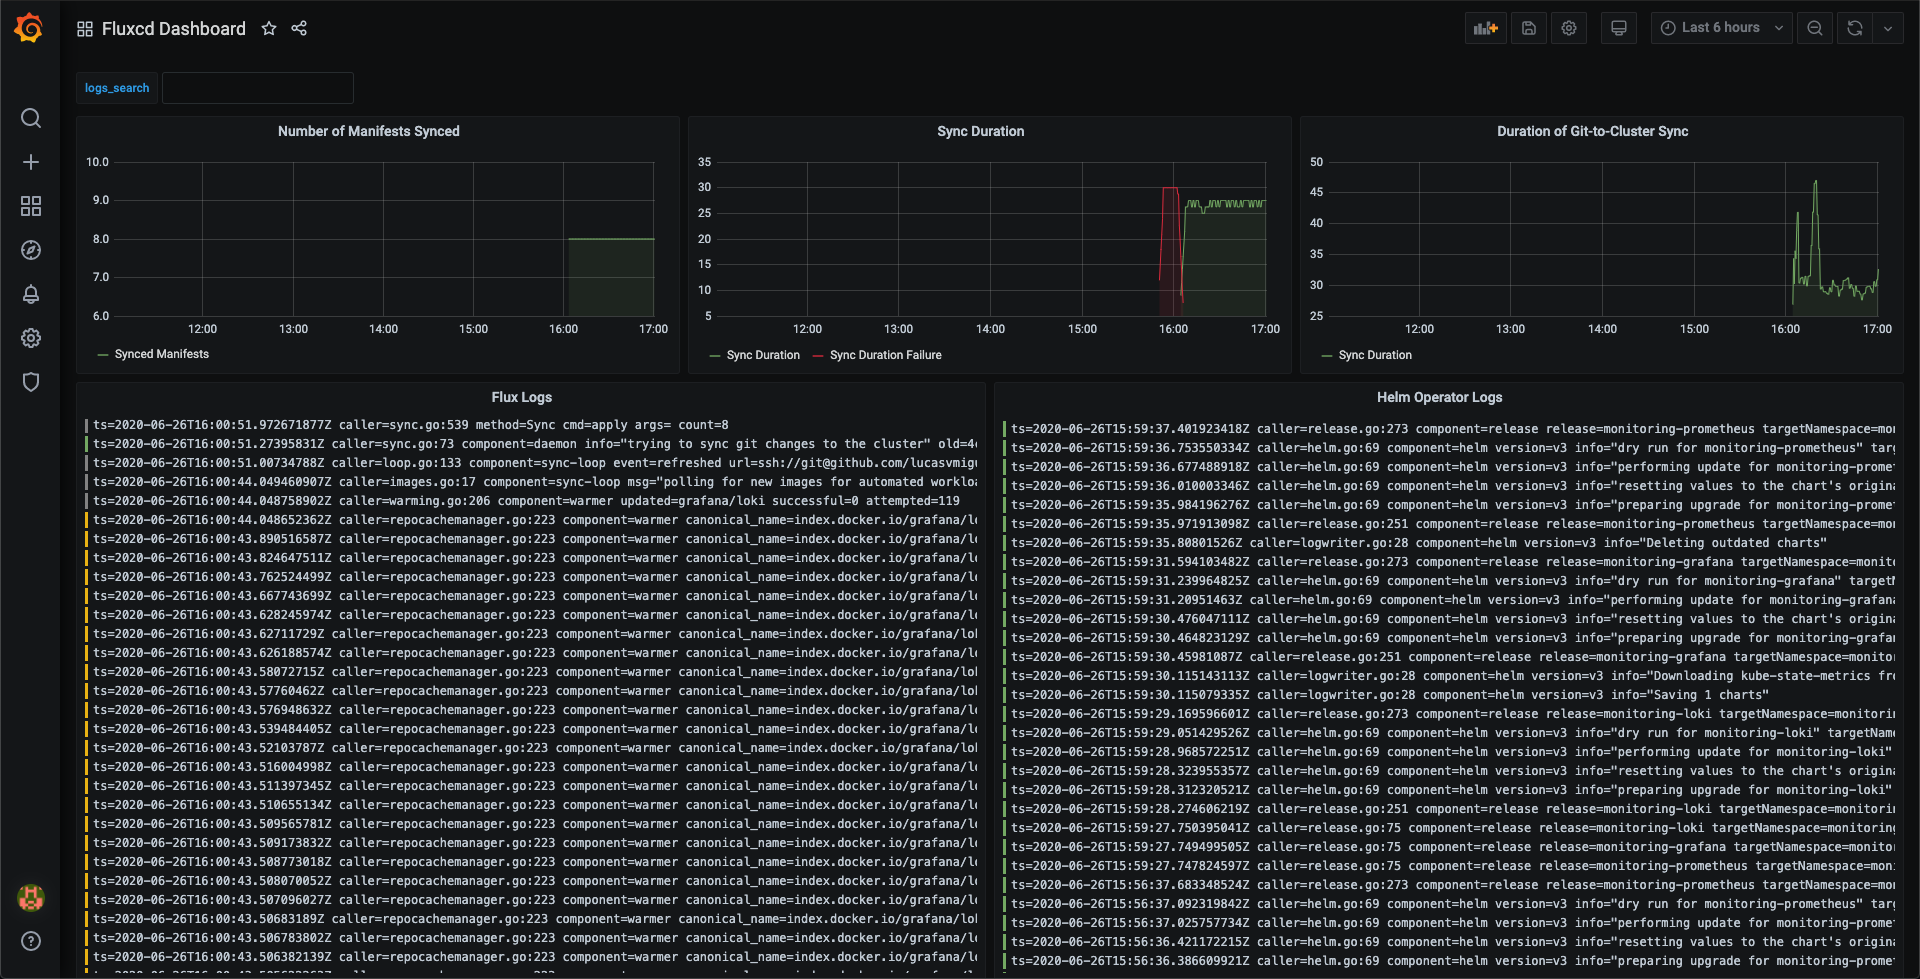
Is that a good start point?
Let me know if I'm missing any fundamental metrics.
lucasvmiguel
on 26 Jun 2020
Is it possible to have the number of failed sync ? Maybe the number of manifests synced is 0 when errors ?
 tux-00
on 26 Jun 2020
tux-00
on 26 Jun 2020
The first graph shows Synced Manifests and Synced Manifest Failures (didn't have any failures at that moment though). On Monday, I can open a PR with those metrics (and any other that you folks suggest).
I just want to confirm if it's ok to create just a config map with that (something like here)
lucasvmiguel
on 26 Jun 2020
Looking forward for the dashboard :)
I just want to add that it would be nice for the dashboard to be "compiled" (if using grafanalib) and available on a public URl just like
https://raw.githubusercontent.com/kubernetes/ingress-nginx/master/deploy/grafana/dashboards/nginx.json
because the sidecar container of the grafana helm chart used in prometheus-operator chart, for some time now, supports loading dashboards from URLs. A simple Grafana restart would load the latest version.
 lebenitza
on 30 Jun 2020
lebenitza
on 30 Jun 2020
Closed by #2792 Thanks @lucasvmiguel 🥇
 stefanprodan
on 7 Jul 2020
stefanprodan
on 7 Jul 2020
Related issues
 phoppe93
·
4Comments
phoppe93
·
4Comments
 audrey-brightloom
·
3Comments
audrey-brightloom
·
3Comments
 cloudpea
·
3Comments
cloudpea
·
3Comments
 IsNull
·
4Comments
IsNull
·
4Comments
 anwarchk
·
4Comments
anwarchk
·
4Comments
Most helpful comment
Looking forward for the dashboard :)
I just want to add that it would be nice for the dashboard to be "compiled" (if using grafanalib) and available on a public URl just like
because the sidecar container of the grafana helm chart used in prometheus-operator chart, for some time now, supports loading dashboards from URLs. A simple Grafana restart would load the latest version.