Flux-core: performance: slowdown with increasing job counts
I have recently been testing the UQP's performance with large numbers of jobs. The more jobs I gave it, the slower it executed. For instance, if 10k jobs ran in time N, 50k jobs would run in time ~8N (I would have expected ~5N). After a number of tests, I think it may be Flux that is the source of the issue.
Most of my data comes from using flux tree, but I've done my best to make as simple of a reproducer as possible and I've cut that part out. My setup consists of just executing flux start python3 script.py [jobcount] 0 72 on a single rztopaz node. See below for the script. The 0 argument indicates the runtime of each job (0 seconds), and 72 indicates the number of jobs that can be submitted at any one time. That's twice the number of cores on rztopaz, and since each job takes 1 core, I thought it was a reasonable number.
The data:
1000 jobs: ~48 seconds
2500 jobs: ~137 seconds
5000 jobs: ~335 seconds
10000 jobs: >= 1200 seconds
Extra information:
I tried export FLUX_QMANAGER_OPTIONS="queue-params=queue-depth=1" at the suggestion of @dongahn (thanks @dongahn !) but it didn't seem to make a noticeable difference.
Judging from my flux tree timing data, it seems I can avoid the slowdown by splitting the jobs among larger and larger numbers of Flux instances. However, there is a limit to how much I can keep doing that...
My environment:
[corbett8@rztopaz188:sleep-0]$ $tree_flux start flux module list | grep sched
qmanager              1027384 3A4A2B6    0  S sched
[corbett8@rztopaz188:sleep-0]$ echo $tree_flux
/usr/global/tools/flux/toss_3_x86_64_ib/flux-0.14.x-20190129-ftree/bin/flux
The script for submitting jobs:
The script is a slightly modified version of one of the example workflow scripts
#!/usr/bin/env python3
"""Script for submitting jobs to Flux."""

import flux
import sys
import os
import time
import argparse

from flux import job
from flux.job import JobspecV1


def setup_parser():
    parser = argparse.ArgumentParser(
        description=(
            "Submit a number of fixed-length jobs to Flux via Flux's Python bindings."
        )
    )
    parser.add_argument(
        "jobcount",
        type=int,
        help="Number of jobs to execute",
    )
    parser.add_argument(
        "job_time",
        type=float,
        help="Seconds each job should run for",
    )
    parser.add_argument(
        "window_size",
        type=int,
        help="Maximum number of jobs to submit concurrently",
    )
    return parser


def main():
    start_time = time.perf_counter()
    args = setup_parser().parse_args()
    # open connection to broker
    h = flux.Flux()
    # create jobspec for compute.py
    compute_jobspec = JobspecV1.from_command(
        command=["sleep", str(args.job_time)],
        num_tasks=1,
        num_nodes=1,
        cores_per_task=1
    )
    compute_jobspec.cwd = os.getcwd()
    done = 0
    running = 0
    # submit jobs, keep [args.window_size] jobs running
    while done < args.jobcount:
        if running < args.window_size and done + running < args.jobcount:
            jobid = flux.job.submit(h, compute_jobspec, waitable=True)
            running += 1
        if running == args.window_size or done + running == args.jobcount:
            jobid, success, errstr = job.wait(h)
            if not success:
                print("wait: {} Error: {}".format(jobid, errstr))
            done += 1
            running -= 1
    print("Total seconds: {}".format(time.perf_counter() - start_time))


if __name__ == '__main__':
    main()

# vim: tabstop=4 shiftwidth=4 expandtab
 jameshcorbett
All 21 comments
@jameshcorbett: thank you for opening this issue. Let's chat a bit at today's call.
Because Fluxion optimization is one of the things I need to do, I will want to use this case to study Fluxion isn't a part of this slow-down. While I'm looking into this, I may find more about what is the source of this slow down.
 dongahn
on 3 Jun 2020
dongahn
on 3 Jun 2020
It would be interesting to try the experiment with the sched-simple as well, which will likely show the same issue and take fluxion (flux-sched) scheduler out of the equation.
Even the 1000 job case seems slow to me, at ~20 job/s, as recent benchmarks I've run show a throughput of at least 40 job/s on single core, sleep 0 jobs. Though, more important here is the slowdown as more jobs are run through a single instance.
BTW, unrelated, but can I ask why the benchmark throttles job submission to only allowing a certain number of jobs to be active at any time? I would think that is what a scheduler is for, and it would be more convenient if you submit all your jobs at once and let the scheduler chew through them.
BTW, we might also try a more recent version of Flux and see if there is any improvement (or if things get worse!). I'll try reproducing the issue as well and see if we can profile flux after 5K-10K jobs to pinpoint any issue.
Thanks!
 grondo
on 3 Jun 2020
grondo
on 3 Jun 2020
@jameshcorbett: thank you for opening this issue. Let's chat a bit at today's call.
Absolutely.
Because Fluxion optimization is one of the things I need to do, I will want to use this case to study Fluxion isn't a part of this slow-down. While I'm looking into this, I may find more about what is the source of this slow down.
It would be interesting to try the experiment with the sched-simple as well, which will likely show the same issue and take fluxion (flux-sched) scheduler out of the equation.
I'll re-run the tests using sched-simple. Then @grondo could you suggest a version to use? I usually use /usr/global/tools/flux/toss_3_x86_64_ib/flux-0.17.0-pre-ft but I see there's also /usr/global/tools/flux/toss_3_x86_64_ib/flux-0.17.0-pre2 which is a little more recent.
Even the 1000 job case seems slow to me, at ~20 job/s, as recent benchmarks I've run show a throughput of at least 40 job/s on single core, sleep 0 jobs. Though, more important here is the slowdown as more jobs are run through a single instance.
BTW, unrelated, but can I ask why the benchmark throttles job submission to only allowing a certain number of jobs to be active at any time? I would think that is what a scheduler is for, and it would be more convenient if you submit all your jobs at once and let the scheduler chew through them.
Interesting. I think @SteVwonder found Flux capable of significantly _fewer_ jobs/s. But yeah, for the purposes of this, I really only care about the slowdown.
And no, there's no particularly good reason for throttling job submission---it's just what I had on hand, and I figured it wouldn't make much of a difference because there isn't really any chance for optimization when every job is single-core. But it's a fair point---I'll cook up a different benchmark that behaves as you suggest, and then I can see how the performance differs.
jameshcorbett
on 3 Jun 2020
I just ran a quick test on a single broker instance on my laptop using sched-simple, on current master plus some inconsequential changes I was working on. The initial program was:
#!/bin/bash

shtest_run() {
    echo Running $1 jobs
    flux jobspec srun -N1 -n1 /bin/true \
        | ../../t/ingest/submitbench -r $1 - >/dev/null
    flux queue drain
}

time test_run 1000
time test_run 2500
time test_run 5000
time test_run 10000
a summary of the results are:
1000 66s
2500 107s
5000 228s
10000 577s
I'm not too happy with the throughput numbers, but the scaling is closer to linear than those reported above.
Edit: also note, all these jobs ran back to back with none running in parallel.
 garlick
on 3 Jun 2020
garlick
on 3 Jun 2020
And no, there's no particularly good reason for throttling job submission---it's just what I had on hand, and I figured it wouldn't make much of a difference because there isn't really any chance for optimization when every job is single-core. But it's a fair point---I'll cook up a different benchmark that behaves as you suggest, and then I can see how the performance differs.
Thanks, don't worry about doing more work. I was more concerned that there was some deficiency in Flux that was causing you grief, and required throttling your job submission in general.
grondo
on 3 Jun 2020
@jameshcorbett: are you redirecting your content store to a file system for this case?
dongahn
on 3 Jun 2020
@jameshcorbett: are you redirecting your content store to a file system for this case?
No, I'm not.
jameshcorbett
on 3 Jun 2020
I ran a similar test on a node of quartz, since I happen to be on there now. This benchmark is a bulk submission test, submitting 5000 (oops 5001) jobs with the queue stopped, then starting the queue to measure sheduling throughput
ƒ(s=1,builddir) grondo@quartz35:~/git/flux-core.git$ flux python ../f.git/bulksubmit.py jobs/*.json
bulksubmit: Starting...
bulksubmit: scheduling disabled, reason=Testing
bulksubmit: submitted 5001 jobs in 9.18s. 545.02job/s
bulksubmit: scheduling enabled
bulksubmit: First job finished in about 4.518s
|██████████████████████████████████████████████████████████| 100.0% (24.2 job/s)
bulksubmit: Ran 5001 jobs in 206.5s. 24.2 job/s
ƒ(s=1,builddir) grondo@quartz35:~/git/flux-core.git$ flux python ../f.git/bulksubmit.py jobs/*.json
bulksubmit: Starting...
bulksubmit: scheduling disabled, reason=Testing
bulksubmit: submitted 5001 jobs in 10.17s. 491.96job/s
bulksubmit: scheduling enabled
bulksubmit: First job finished in about 5.350s
|██████████████████████████████████████████████████████████| 100.0% (21.9 job/s)
bulksubmit: Ran 5001 jobs in 228.1s. 21.9 job/s
This also shows a fairly consistent throughput.
After 10000 jobs, content.sqlite is ~269M. The flux-broker RSS is about 390M.
grondo
on 3 Jun 2020
Thanks @grondo. I'll try to replicate that on quartz, using the same script.
I just tried sched-simple (I also bumped up the window size to 5000), and it didn't improve the 5000-job timing:
bash-4.2$ $flux start flux module list | grep sched
sched-simple          1236896 DCDD2C6    0  S sched
bash-4.2$ /usr/global/tools/flux/toss_3_x86_64_ib/flux-0.17.0-pre-ft/bin/flux start python3 script.py 5000 0.0 5000
Total seconds: 328.2419569150079
Thanks @jameshcorbett. I was definitely able to reproduce with the version you linked above.
One thing I noticed in your benchmark is that jobs are submitted synchronously, instead of asynchronously. This will definitely slow down the job submission phase of the script, though it isn't a massive improvement:
 grondo@quartz19:~/git/flux-core.git$ /usr/global/tools/flux/toss_3_x86_64_ib/flux-0.17.0-pre-ft/bin/flux start python3 sub.py 5000 0.0 5000
Total seconds: 331.18528858100035
 grondo@quartz19:~/git/flux-core.git$ /usr/global/tools/flux/toss_3_x86_64_ib/flux-0.17.0-pre-ft/bin/flux start python3 ../f.git/bulksubmit.py jobs/*.json
bulksubmit: Starting...
bulksubmit: scheduling disabled, reason=Testing
bulksubmit: submitted 5001 jobs in 9.70s. 515.75job/s
bulksubmit: scheduling enabled
bulksubmit: First job finished in about 3.497s
|██████████████████████████████████████████████████████████| 100.0% (17.1 job/s)
bulksubmit: Ran 5001 jobs in 292.0s. 17.1 job/s
Edit: in case it wasn't clear bulksubmit.py submits jobs asynchronously, so the ingest phase of the benchmark only takes 9.7s. This will be much slower (assuming about 30s slower) if jobs are submitted back-to-back.
This doesn't explain any slowdown over time, however (unless job ingest gets slower, this would be amplified by synchronous submission)
grondo
on 3 Jun 2020
Thanks for the tip about bulksubmit.py. I wasn't really looking at the source, but that's good to know---I can work that into the UQP's source and the benchmarks.
I ran bulk_submit.py on quartz and saw a _slight_ slowdown. Not a lot of data, though. The job ingest rate certainly didn't get faster with more jobs...
bash-4.2$ $flux start python3 bulk_submit.py jobs/*.json
bulksubmit: Starting...
bulksubmit: submitted 5001 jobs in 12.86s. 388.75job/s
bulksubmit: First job finished in about 12.912s
|██████████████████████████████████████████████████████████| 100.0% (17.2 job/s)
bulksubmit: Ran 5001 jobs in 290.8s. 17.2 job/s
bash-4.2$ $flux start flux module list | grep sched
qmanager              1035800 4417607    0  S sched
bash-4.2$ export FLUX_QMANAGER_RC_NOOP=t
bash-4.2$ $flux start flux module list | grep sched
sched-simple          1236896 DCDD2C6    0  S sched
bash-4.2$ $flux start python3 bulk_submit.py jobs/*.json
bulksubmit: Starting...
bulksubmit: submitted 5001 jobs in 12.15s. 411.52job/s
bulksubmit: First job finished in about 13.166s
|██████████████████████████████████████████████████████████| 100.0% (18.1 job/s)
bulksubmit: Ran 5001 jobs in 276.2s. 18.1 job/s
bash-4.2$ $flux start python3 bulk_submit.py jobs/*.json
bulksubmit: Starting...
bulksubmit: submitted 10001 jobs in 32.65s. 306.34job/s
bulksubmit: First job finished in about 32.673s
|██████████████████████████████████████████████████████████| 100.0% (16.2 job/s)
bulksubmit: Ran 10001 jobs in 617.2s. 16.2 job/s
bash-4.2$ export FLUX_QMANAGER_RC_NOOP=t
bash-4.2$ $flux start flux module list | grep sched
sched-simple          1236896 DCDD2C6    0  S sched
bash-4.2$ $flux start python3 bulk_submit.py jobs/*.json
bulksubmit: Starting...
bulksubmit: submitted 10001 jobs in 27.10s. 369.08job/s
bulksubmit: First job finished in about 27.189s
|██████████████████████████████████████████████████████████| 100.0% (15.4 job/s)
bulksubmit: Ran 10001 jobs in 650.0s. 15.4 job/s
I just ran some tests on Quartz timing both synchronous and asynchronous job submission time for varying job counts. I just had scripts submit jobs as fast as they could.
Async (3 times each):
1000 jobs: ~1.1 sec
5000: ~6.5 seconds
10000: ~13.5 seconds
20000: ~29 seconds
Sync:
1000 jobs: ~47.4 seconds
5000 jobs: ~332 seconds
10000 jobs: ~865.64 seconds
Still not totally sure what's going on, but at least in the 1k and 5k cases, the synchronous submit rate is actually determining the execution rate (not sure what changed for 10k though)...
At least I know how slow the synchronous submission is now!
jameshcorbett
on 4 Jun 2020
In my work with @dongahn and @SteVwonder I developed a data collection and plotting framework, so I went ahead and plugged this particular issue in to collect a more substantial amount of data. I was using a slightly modified version of bulksubmit.py (modified so that I don't need to cp sleep0.json a couple thousand times). The timings definitely aren't linear, but it's nothing like a spike either. Not knowing what goes on under the hood, I don't really know what to expect. So unless you're shocked, I'll consider this issue closed.
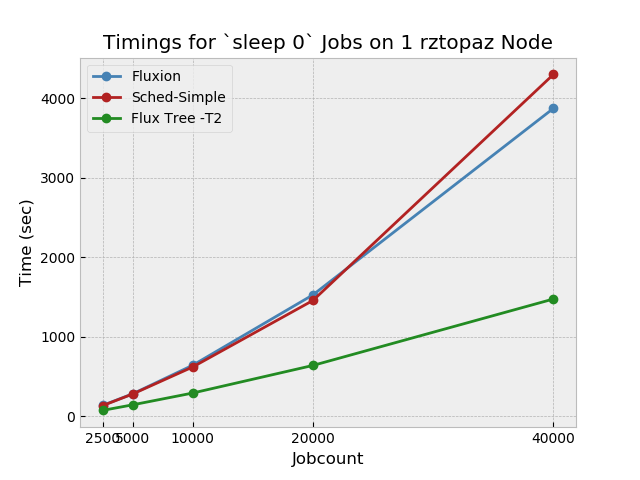
Unfortunately my own code continues to slow down substantially with larger job counts...
jameshcorbett
on 6 Jun 2020
Great rendition! Thank you @jameshcorbett!
dongahn
on 6 Jun 2020
Thanks @jameshcorbett, most enlightening discussion as per usual!
Nothing too surprising. We should be able to do better, but we really haven't had time to optimize anything yet.
Only if you are interested: One limiting factor in job throughput is the "single" allocation mode that scheduler (at least I think Fluxion also uses this mode by default), uses to get jobs from the job-manager. This limits jobs to running pretty much back-to-back, which limits scalability in terms of available resources.
You could try reloading sched-simple in "unlimited" alloc mode before running the scaling test to see if there is any effect
flux module reload sched-simple unlimited
You could try reloading sched-simple in "unlimited" alloc mode before running the scaling test to see if there is any effect
flux module reload sched-simple unlimited
How would I use that? Usually I would just execute flux start python3 timing_script.py, would that become something like flux start script.sh where script.sh is
#!/bin/bash
flux module reload sched-simple unlimited
python3 timing_script.py
?
jameshcorbett
on 6 Jun 2020
Yeah, that would work. Sorry it isn't more convenient.
grondo
on 6 Jun 2020
Would it be worthwhile to add an environment variable that passes settings through to the rc1 script like in flux-sched? For example, FLUX_SCHED_SIMPLE_OPTIONS=unlimited flux start timing_script.py. Not sure if that goes against any of our future plans for configuration. If it passes the smell test, maybe we open a separate issue. If it is smelly or conflicts, then no worries.
 SteVwonder
on 9 Jun 2020
SteVwonder
on 9 Jun 2020
It is simple enough to reload the module, so probably not worth it at this time. It would also be good to avoid going down the path of environment variables affecting rc scripts -- at least that is my opinion. I think you're right that we will handle this via config files (perhaps set on commandline) in the near future.
grondo
on 9 Jun 2020
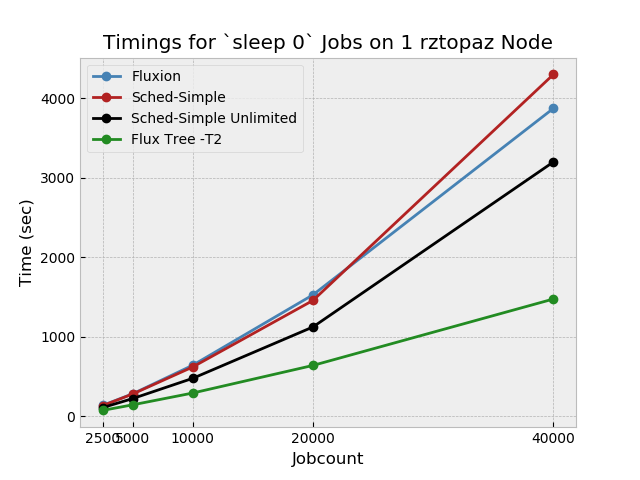
@grondo as you can see in the plot, I got universally better performance but with the same general trend. As with the previous configurations, I ran each the tests 3 times per jobcount, except the 40k which were only run twice since they take quite a while.
jameshcorbett
on 13 Jun 2020
@jameshcorbett, great thanks!
I'm hopeful that once we have a chance to optimize job throughput there will be some low hanging fruit to make this a bit better.
grondo
on 13 Jun 2020
Related issues
garlick
·
8Comments
dongahn
·
7Comments
 chu11
·
6Comments
grondo
·
7Comments
SteVwonder
·
7Comments
chu11
·
6Comments
grondo
·
7Comments
SteVwonder
·
7Comments
Most helpful comment
In my work with @dongahn and @SteVwonder I developed a data collection and plotting framework, so I went ahead and plugged this particular issue in to collect a more substantial amount of data. I was using a slightly modified version of
bulksubmit.py(modified so that I don't need tocp sleep0.jsona couple thousand times). The timings definitely aren't linear, but it's nothing like a spike either. Not knowing what goes on under the hood, I don't really know what to expect. So unless you're shocked, I'll consider this issue closed.Unfortunately my own code continues to slow down substantially with larger job counts...