Flutter-intellij: An improved console for logging.
The current console view is limited. Among other things, it:
- lacks structure,
- is not easily searched, and
- provides no affordances for filtering
The plan is to re-think the console log and feedback is most welcome.
A few leading questions:
- what kinds of problems are folks solving with the current console log; how might it better solve them?
- how might it be improved to solve other use cases?
- are there exemplars we can draw inspiration from?
Thanks in advance for your input!
See also: #2199 (cc @zoechi)
 pq
pq
All 50 comments
I use the logging package for printing logs.
Being able to filter for
loggerName(or parts of the.-separated hierarchical name),timemessagelevel
would be great.
Show/hide system log messages would also be great, they are often noisy.
I use logs to see if things are executed in the order I expect and if the values I expect are used.
Breakpoints are too cumbersome for code that is called often.
 zoechi
on 4 May 2018
zoechi
on 4 May 2018
Thanks @zoechi!
Popping up, are there other logging tools you use to aid flutter development? For example does network traffic interest you?
pq
on 6 May 2018
/cc @johnpryan @matthewtsmith
pq
on 6 May 2018
@pq I didn't run into a situation yet where I needed to debug the network traffic, but I'd use tools like WireShark for that.
zoechi
on 7 May 2018
Network traffic would be useful for us. For what it's worth, we are using a simple cURL logger right now. It would be much nicer to have some basic features that flutter_stetho provides more at-hand. Off the top of my head, here's what I think we could use in order of usefulness:
- view the URL, HTTP headers, and body of requests and responses
- filtering requests by type (XHR, image) and by filter text
- "preserve log" feature across app restarts (maybe this is useful for logging more generally?)
- copy the request as cURL
- timing of all requests the app has made
- redo a request
More generally, yes, we use the logging package mentioned above, and being able to filter, color-code, etc would come in handy.
What other solutions have people found for IntelliJ? Would there be a way to make the logging package compatible with an off-the-shelf IntelliJ plugin... perhaps writing to a .log file and opening with ideolog?
 johnpryan
on 7 May 2018
johnpryan
on 7 May 2018
Thanks for the ideas @johnpryan!
Incidentally, we should also kick off a conversation about how we'd support redux.dart. 👍
At the architectural level we're envisioning a pluggable system where tools, plugins, libraries, and frameworks could hook in to provide a holistic view of the app's lifecycle. Plugging redux logging into this story would be awesome.
pq
on 7 May 2018
I'm assuming you're talking about @brianegan's package: https://pub.dartlang.org/packages/redux_logging, which is using the logging package too. A naive (but workable) solution would just be to have users add a prefix to each redux log (e.g. [Redux] - my event information that could be used as a filter to hide non-redux logs from the view.
johnpryan
on 7 May 2018
I like it colorful:-)
There is an IntelliJ plugin to add/define colors, but this plugin doesn't work with the Run-Console :-(
https://plugins.jetbrains.com/plugin/7125-grep-console
As an inspiration: Take a look at the console from Android Studio: colors, search, filter
 the4thfloor
on 18 May 2018
the4thfloor
on 18 May 2018
@all, @the4thfloor
I found a workaround.
TLDR:
print output of flutter logs to a file then using grep console tool tail that file.
For now, you can do something like this one.
- In our project create a folder name
tmp - Open terminal.
cdto thetmpfolder.- run a command
(rm flutter.log; flutter logs >> flutter.log)
- Using grep console plugin tail console
flutter.logfile.
So now you can grep/filter as you want.
 quangson91
on 9 Jun 2018
quangson91
on 9 Jun 2018
Good tip @quangson91 !
The next update will bring some pretty big improvements to the logging view (including filtering). Are there any things in particular besides filtering you'd really like to see?
Thanks in advance for any input!
pq
on 9 Jun 2018
Hi @pq,
I think in logging view we make it same log cat in android.
- Filtering with regex.
- Coloring by log level.
(In debug mode, I would like to see the log come from. I mean I can see the log is print from file SourceFile.dart:LINE_NUMBER)
Thank all for your hard work.
quangson91
on 9 Jun 2018
Thanks @quangson91!
A few more follow-up questions:
- Out of curiosity, what log levels do you currently use?
- Are these events logged by your app or coming from the framework?
- Do you use the logging package?
pq
on 9 Jun 2018
Out of curiosity, what log levels do you currently use?
I often use levels info, shout (in flutter).
But shout looks strange for me. I love log level like android. (debug/info/warn/error)
Are these events logged by your app or coming from the framework?
I mostly check log only from my app.
Do you use the logging package?
Yes. I used it for flutter project.
I don't know why in flutter docs there are only some simple things to log - print/debugPrint.
Thank you for fast reply!
quangson91
on 9 Jun 2018
@quangson91 I use this script to print the method name and line, etc
import 'package:logging/logging.dart';
import 'package:meta/meta.dart';
import 'package:stack_trace/stack_trace.dart';

Logger log;

void initLogger({@required String package, String tag}) {
  assert(package != null);

  Logger.root.level = Level.ALL;
  Logger.root.onRecord.listen((LogRecord rec) {
    final List<Frame> frames = Trace.current().frames;
    final Frame f = frames.skip(1).firstWhere((Frame f) => f.package == package, orElse: () => frames.first);
    print('${rec.level.name}/${rec.loggerName}: ${f.member} (${f.library}:${f.line}): ${rec.message}');
  });

  log = Logger(tag?.toUpperCase() ?? package.toUpperCase());
}
and initialize it with:
initLogger(package: '<app>', tag: '<tag>');
@the4thfloor that's amazing.
I will try it.
Thank you so much!
quangson91
on 9 Jun 2018
colored log output would be nice.
at least errors (and not only log level error also this flutter errors) should be printed in red.
the4thfloor
on 9 Jun 2018
Awesome. Thanks for that @the4thfloor!
@quangson91 , when you say:
But shout looks strange for me.
could you elaborate? Look how? In logging output?
We have a great opportunity to get this right here, so all of your continued input is greatly valued.
Thank you all! 🎉
pq
on 9 Jun 2018
@quangson91 Hrm, I haven't seen the shout level, but I generally use the levels similar to those found in Android from the logging package (Level.debug, Level.info, Level.warning, Level.error, Level.fatal.): https://pub.dartlang.org/documentation/logger/latest/logger/Level-class.html
 brianegan
on 9 Jun 2018
brianegan
on 9 Jun 2018
colored log output would be nice.
@the4thfloor: in a perfect world, what differentiations would you see out of the box? A color corresponding to each level (debug, info, warning, error, fatal)? More? How important is configurability? (I'm thinking very, to accommodate folks who have a hard time differentiating certain colors.)
Cheers @brianegan! Nice to have you in the conversation. 🤗
pq
on 9 Jun 2018
I should add, @brianegan, and all: concrete use cases are hugely valued. Either here or in separate issues.
Thanks!
pq
on 9 Jun 2018
@pq @brianegan Thank all.
[1] shout level comes from this package: https://pub.dartlang.org/packages/logging
[2] debug, info, warning, error, fatal -> from this package https://pub.dartlang.org/packages/logger/versions/0.1.0
@pq I love seconds packages. (I have not used it yet. But I love levels like debug/info/warning/error)
Thank @brianegan for point it out.
quangson91
on 9 Jun 2018
@pq I love seconds packages.
🤔 Sorry. Early here and I need more coffee, but I'm not sure what you're referring to... (Do you mean the logger package you referenced?)
☕️
pq
on 9 Jun 2018
@pq for me, it would be enough when the grep console plugin works with the Flutter log output so I can configure the colors myself.
the4thfloor
on 9 Jun 2018
@pq yeap. logger package
quangson91
on 9 Jun 2018
@pq for me, it would be enough when the grep console plugin works with the Flutter log output so I can configure the colors myself.
Cool. Interop w/ the grep plugin is a little to the side of what I'm working on at the moment. The current approach is a drop-in replacement, using among other things a tree table rather than a text view but making the standard console work with it shouldn't be too hard. I haven't looked but I'm a little surprised that it doesn't "just work". Anyway, if that's high on your list, would you consider opening a fresh issue to track? Thanks @the4thfloor!
pq
on 9 Jun 2018
It isn't high on my list, in the end, I need an easy way to find all error messages, this can be a log statement in red or just a filter to search for "error"
the4thfloor
on 9 Jun 2018
How do folks feel about reloads/restarts? Would you value an option to auto-clear? I was also thinking about drawing a visual representation, like a waterline to make it clear when a reload / restart happened. And possibly a way to easily navigate to last reload / restart.
Any thoughts?
pq
on 9 Jun 2018
@quangson91 Ah, dang it, you're right. I somehow always mix up those two packages and was looking at the wrong docs. I've generally used the logging package in the past (for flutter_redux), not the logger package! :P
Reloads / Restarts
Just my two cents:
On Reload: I like the idea of a line, maybe with a timestamp or some way to uniquely identify that reload. That way if you add or remove print statements for example, you can clearly see where they start / stop. If you navigate between reloads, you'd have some idea of which one you're looking at by evaluating the timestamp.
On Restart: Not sure if I'd want a line or if I'd prefer to completely clear (aka "restart") the console. If it's not too onerous, an option would be nice to have so we could try both options. I do see restarts as: "Ok, let's start fresh here."
Network Inspection
Perhaps related to logging, but maybe separate, but I definitely agree with @johnpryan's points above. The flutter_stetho plugin I built to inspect network requests is limited to Android, and takes you out of your normal dev flow a bit by needing to use Chrome to inspect the traffic. It would be amazing if you could inspect this type of traffic within the IDE (that also might be a rather large chunk of work :P).
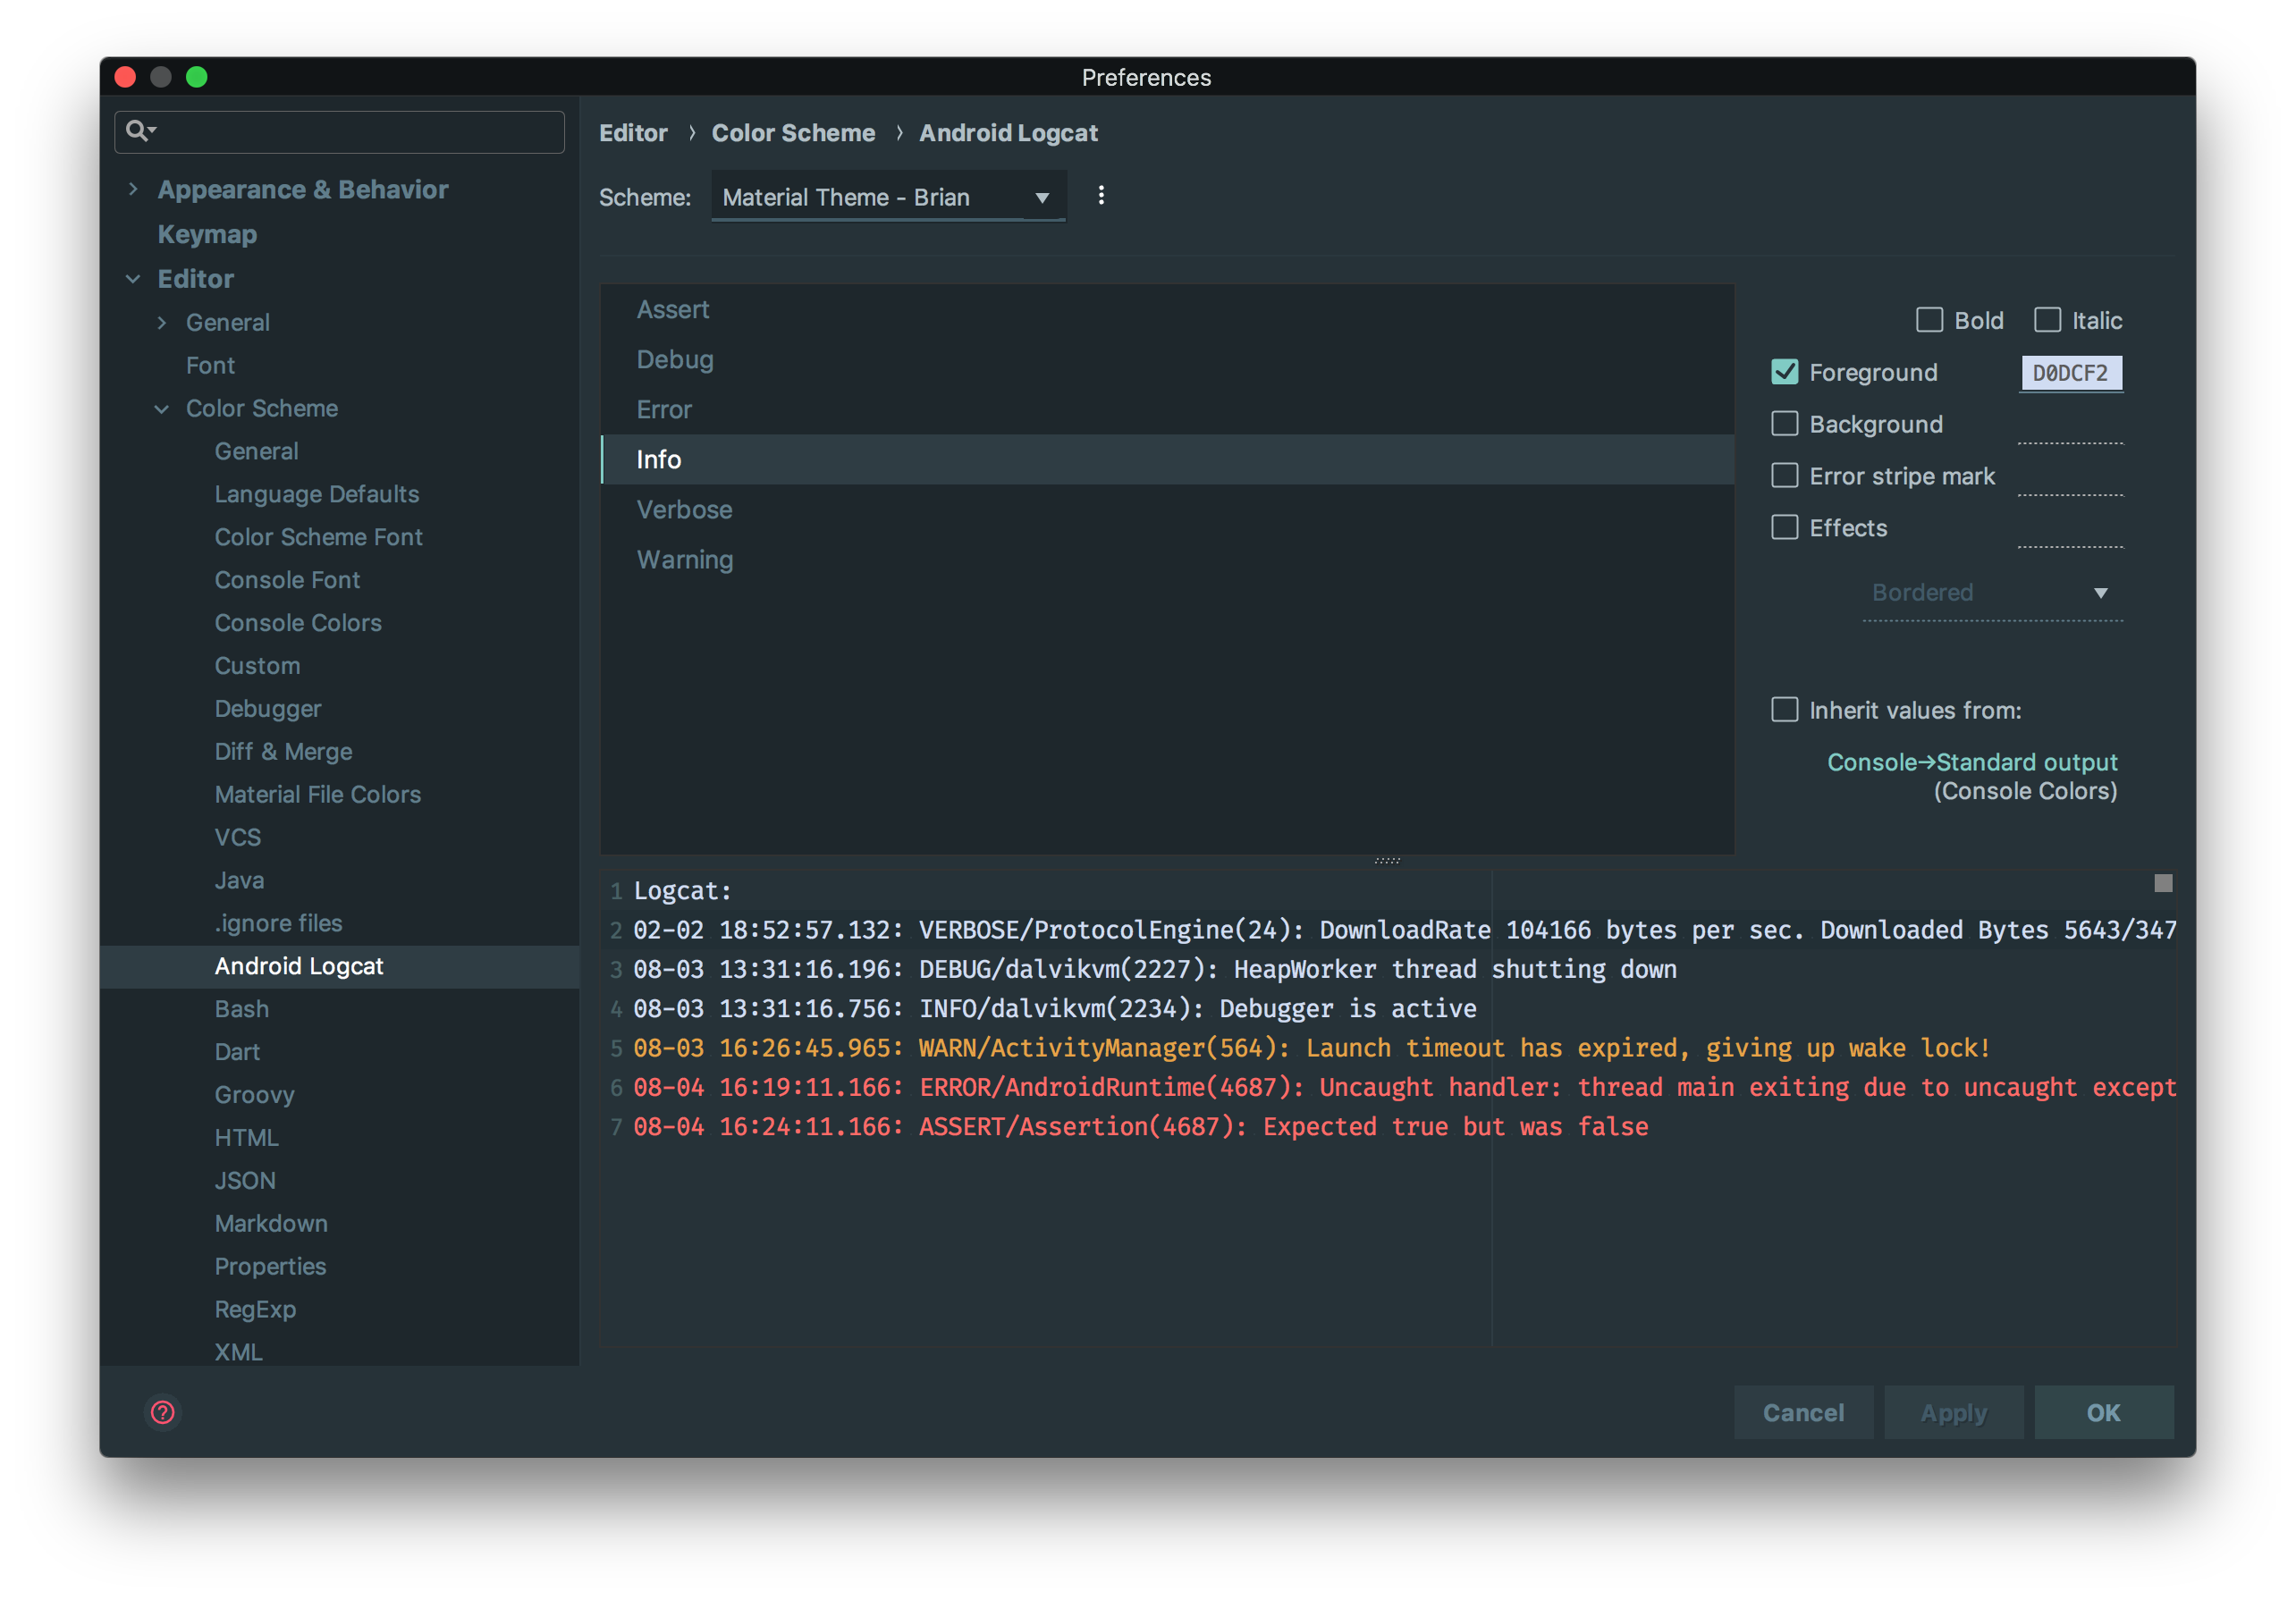
Logging Color Customizations
I could see it working similar to the ADB Logcat configuration (screenshot below).
I'm not sure if this new work is tied to the logging package, but if such an interface existed, it might make more sense to conform to the levels offered by the logging package instead of the android standard: https://pub.dartlang.org/documentation/logging/latest/logging/Level-class.html
brianegan
on 9 Jun 2018
Awesome. Thanks @brianegan!
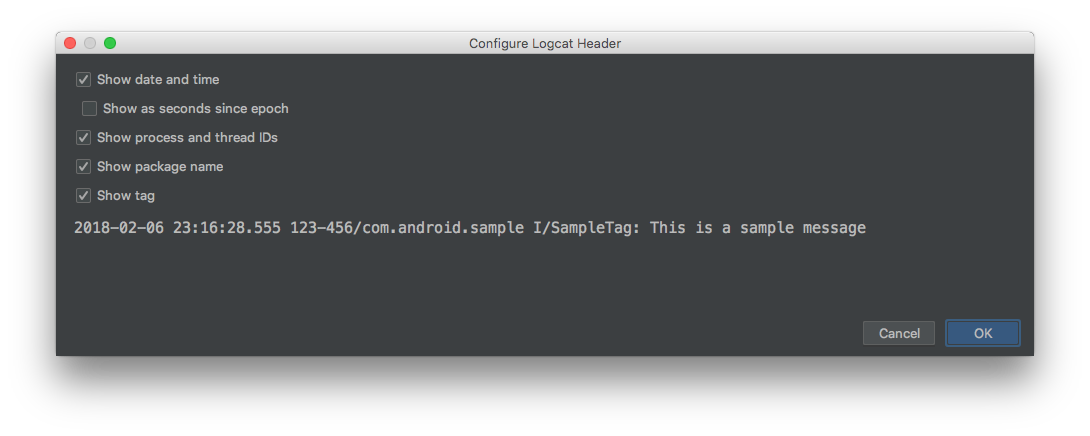
Looking at the logcat output reminds me of another question. Regarding the merits of event timestamps, do folks need them:
- always
- sometimes
- never?
Assuming you do use them, any reflections on specific problems they help solve would be greatly appreciated!
pq
on 9 Jun 2018
maybe you can make the timestamp and other things configurable
the4thfloor
on 9 Jun 2018
sometimes I miss another feature: add text and/or linebreaks with my keyboard
Yes I use print() to debug my app and sometime I have to do some more steps in my app to reproduce a crash or somethnig else.
So I use linebreaks in the log view to seperate the log message.
the4thfloor
on 9 Jun 2018
@the4thfloor: interesting! You mean you edit the log output directly in the console view? Or do you just mean the console faithfully shows the new lines sent from within your app?
pq
on 9 Jun 2018
I edit the log in the console view but not the log messages itself.
I add linebreaks to separate the log messages or add notes (for example to see which action produced which log messages).
the4thfloor
on 9 Jun 2018
@pq > Regarding the merits of event timestamps
A timestamp once after reload/restart would work for me and then a running number per log statement.
zoechi
on 10 Jun 2018
@pq I would like to support enable regex filter in the log view.
I created a PR: https://github.com/flutter/flutter-intellij/pull/2349
quangson91
on 10 Jun 2018
Thanks for all the feedback!
@the4thfloor:
I add linebreaks to separate the log messages or add notes (for example to see which action produced which log messages).
Great use case. Thanks! 👍
@zoechi:
A timestamp once after reload/restart would work for me and then a running number per log statement.
Do you mean a simple count or time elapsed since restart/reload?
pq
on 11 Jun 2018
@pq no I mean just an incrementing number to see how far the log is from the beginning or just to not lose track if a log entry I saw before was before or after the one I'm currently looking at.
The logging package has a running counter for each log entry since the app was started. I like that.
It's less noisy like timestamp at the beginning of each log line.
I guess if timing information is required something else than logging is a better fit anyway (https://api.dartlang.org/stable/1.24.3/dart-developer/Timeline-class.html)
zoechi
on 11 Jun 2018
@zoechi: In a ideal world, how would numbering be affected by reloads/restarts?
pq
on 11 Jun 2018
@pq
Cold restarts should always start with 0
Hot reload/restart should depend on

Depending on this setting hot reload cleans the buffer and then counting also should restart at 0
zoechi
on 11 Jun 2018
Bump w/ an update on the framework-side where I've got a PR out to plumb-in a basic API (https://github.com/flutter/flutter/pull/21505). Input on the associated issue (https://github.com/flutter/flutter/issues/21504) would be most welcome!
pq
on 6 Sep 2018
would love to see all of that happening :)
On my side I really like the Android logcat console with the ability to:
- have colors
- filter by regex or text
- filter by log level
Network log would be a huge feature for me, for now I'm using a log interceptor on Jaguar-retrofit lib and put everything to the output log. But very funny when you post a file ^^ so a dedicated tab for network stuff would be awesome.
 jaumard
on 15 Nov 2018
jaumard
on 15 Nov 2018
We currently can have colors but not on the console of the plugin ^^ this is working great on a terminal
const reduxLogLevel = Level('redux', 200);

void initLogger() {
  Logger.root.level = Level.ALL;
  Logger.root.onRecord.listen((record) {
    final time =  DateFormat.Hms().format(DateTime.now());
    final msg = Colorize('[$time ${record.level} ${record.loggerName}] ${record.message}');
    switch (record.level) { // ignore: case_expression_type_implements_equals
      case Level.SHOUT: msg..white()..bgRed(); break;
      case Level.SEVERE: msg.lightRed(); break;
      case Level.WARNING: msg.yellow(); break;
      case Level.INFO: msg.white(); break;
      case Level.CONFIG:
      case Level.FINE:
      case Level.FINER:
      case Level.FINEST: msg.darkGray(); break;
      case reduxLogLevel: msg.blue(); break;
      default:
        msg.default_slyle();
    }
    if (!isProductionMode) {
      debugPrint(msg.toString(), wrapWidth: 150);
    }
  });
}
But on the plugin console we have :
flutter: \^[[97m[17:10:23 INFO TransactionRepository] - Synchro transactions remote ones 3 1/1<…>
flutter: \^[[97m[17:10:23 INFO SynchroManager] - Synchro Transaction finished<…>
flutter: \^[[97m[17:10:23 INFO SynchroManager] Synchro finished<…>
flutter: \^[[97m[17:10:23 INFO CustomerSynchro] Finish sync of 0 customers<…>
flutter: \^[[97m[17:10:23 INFO AddressSynchro] Finished sync of 2 addresses<…>
flutter: \^[[97m[17:10:23 INFO TransactionSynchro] finish sync 3 transactions<…>
flutter: \^[[97m[17:10:23 INFO TransactionSynchro] finish sync 3 cart items<…>
flutter: \^[[97m[17:10:23 INFO SynchroMiddleware] Synchro finished set timestamp to  1542298223<…>
Witch is far from great lool :D
jaumard
on 15 Nov 2018
Thanks for the feedback @jaumard!
Currently you can configure entry coloring by level in the Flutter Log preferences.

If that's sufficient, you won't need to color yourself.
_Do note that you need the experimental Flutter Logging View enabled in preferences for this to work..._

Is getting Colorize to work important? Feel free to chime in on https://github.com/flutter/flutter-intellij/issues/2552 which is the related tracking issue.
pq
on 16 Nov 2018
Hum in fact it doesn't work for me...
I've configure this but there no color at all...

We're using colorize in case we're not using IntelliJ/AS but only command line to run the app, my friend for example is using command line because on his AS (windows) logs doesn't show at log, he has an empty tab.
jaumard
on 16 Nov 2018
@pq following our discussion here https://github.com/flutter/flutter-intellij/pull/3034#issuecomment-451165449
that corresponds to levels as defined by messages reported using the Dart package:logging
Is the current version also reporting message uses by package:logging because I'm using it and it give me the previous screenshot (it's doesn't report Fine but info).
Could you elaborate on this? It would be great to know what we could do to line this view up with your imagined use cases. What does the simple text view allow you to do that this view doesn't? Thanks in advance!
I mean for now the console give me:
timestamp, info, flutter.tools, [11:11:11 FINE CartRepository] my custom log...
But what I really want is:
timestamp, fine, CartRepository, my custom log...
So maybe I'm not using package:logging like I should... but from what I understand it should be the case right ? That why I'm saying that the text console is better because with this one it doesn't offer me anything more... is there something special to do with the logger ?
jaumard
on 3 Jan 2019
Thanks for the feedback @jaumard! I opened #3036 to follow-up.
pq
on 3 Jan 2019
@pq is there any update regarding network traffic profiling ?
 amadeu01
on 3 Sep 2019
amadeu01
on 3 Sep 2019
Hi @amadeu01! I'm not aware of any progress (I've been largely working on the Dart analyzer over the last few months) but I know there's a related feature request over here: https://github.com/flutter/devtools/issues/368. Thanks for the interest!
pq
on 3 Sep 2019
Closing as this is related to the experimental logging view.
Note that a networking page is being added to DevTools.
 devoncarew
on 7 Jan 2020
devoncarew
on 7 Jan 2020
Is the logging level still respected by the Android Studio Flutter Run Console? I didn't see any color with level toggle.

 AlexV525
on 24 Dec 2020
AlexV525
on 24 Dec 2020
Related issues
 branflake2267
·
68Comments
branflake2267
·
68Comments
 liorgonnen
·
24Comments
liorgonnen
·
24Comments
 marcglasberg
·
25Comments
marcglasberg
·
25Comments
 sethladd
·
36Comments
sethladd
·
36Comments
 mit-mit
·
37Comments
mit-mit
·
37Comments
Most helpful comment
I use the logging package for printing logs.
Being able to filter for
loggerName(or parts of the.-separated hierarchical name),timemessagelevelwould be great.
Show/hide system log messages would also be great, they are often noisy.
I use logs to see if things are executed in the order I expect and if the values I expect are used.
Breakpoints are too cumbersome for code that is called often.