Fluentui: Show a point in Line chart component when there is only one data
Describe the feature that you would like added
We are internal users of this Package in MSFT. My alias is niwa.
We are hoping someone can add a new feature or fix this bug in Line Chart component.
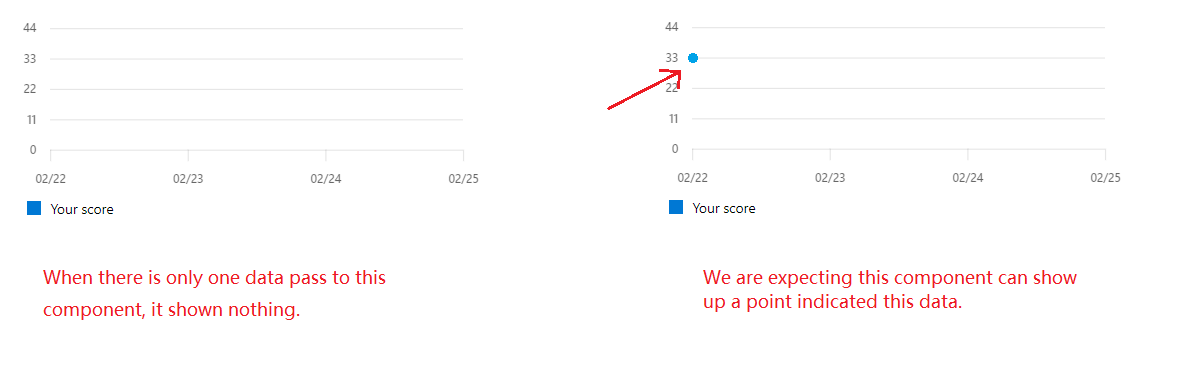
In @uifabric/charting LineChart component, when we have only one data pass to the component, the component shown nothing on UX just an empty chart. We are expecting the component to show up a point indicated this data on the line chart.
What component or utility would this be added to
Pls see the attached picture.
Have you discussed this feature with our team, and if so, who
No.
Additional context/screenshots
 kenibote
All 5 comments
I will get this fixed.
 Raghurk
on 2 Mar 2020
Raghurk
on 2 Mar 2020
hello @kenibote , could you please share us the data that you are passing to the chart, so that i could repro at my side and do the needful
 shivasai09
on 5 Mar 2020
shivasai09
on 5 Mar 2020
@shivasai09 Sure. For example, <LineChart data={data} tickFormat={'%m%d'} tickValues={values}/>
Here, the data=[
{
data:[{x:'2020-02-02', y:90}],
legend:'Your Point',
color: '#0078D4'
}
]. Here the values: Date[] = ['2020-02-02'] .
Then the UX just shows an empty Line chart. what we expect is that there should at least has a point on the UX.
Thanks. :)
kenibote
on 5 Mar 2020
This is resolved. Please take the latest charting package
Raghurk
on 20 Mar 2020
@Raghurk @shivasai09 @xugao Truly thanks~
kenibote
on 23 Mar 2020
Related issues
 gabrielruss
·
3Comments
gabrielruss
·
3Comments
 satbai
·
3Comments
satbai
·
3Comments
 nekoya
·
3Comments
gabrielruss
·
3Comments
nekoya
·
3Comments
gabrielruss
·
3Comments
 prashkan
·
3Comments
prashkan
·
3Comments
Most helpful comment
I will get this fixed.