Fluent-bit: Fluent-bit dropping events after upgrading to Fluent-bit 1.5
Bug Report
We are seeing events being dropped when we upgrade to fluent-bit 1.5.3 from fluent-bit 1.4.6. Here are the Load tests we are running using the fluent-bit dummy...
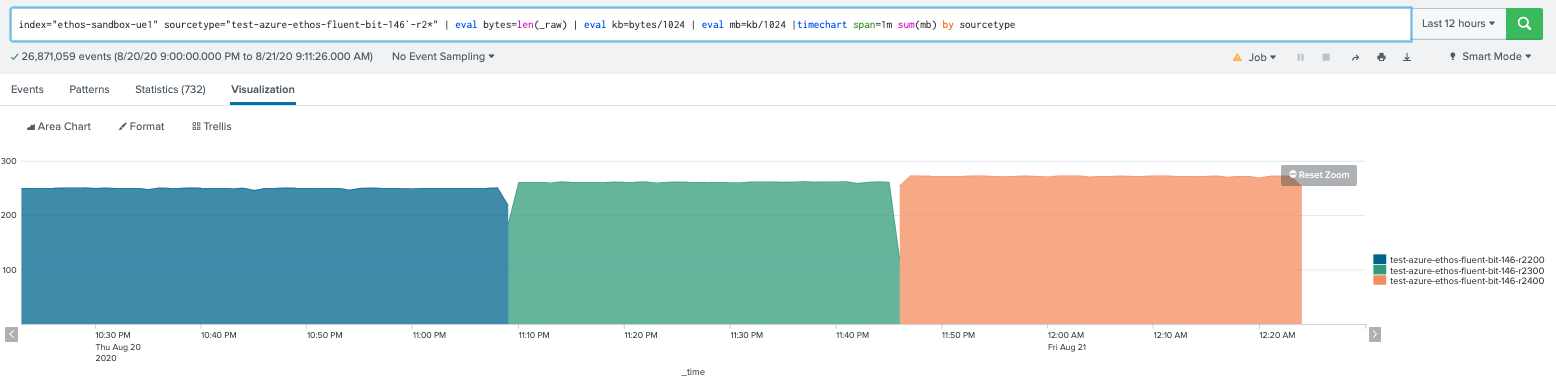
When running fluent-bit dummy at 2400 events/sec @2kb events. We see large log drops Here are our load test results.
fluent-bit 1.4.6 tests
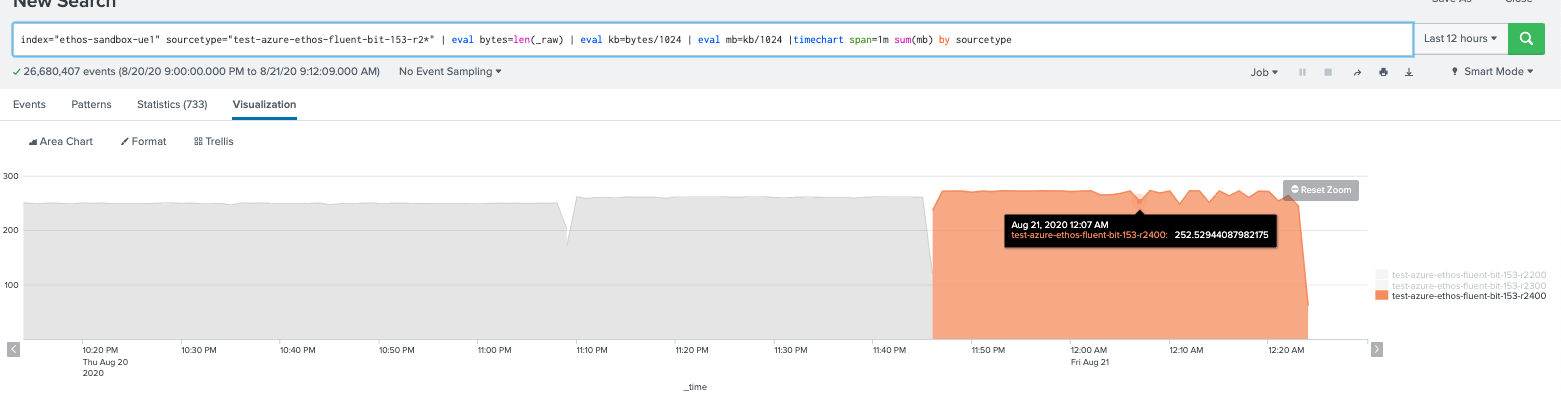
fluent-bit 1.5.3 tests, notice the last test has large dips, we notice logs are being dropped.
We also ran this in AWS at higher rates same problem observed in fluent-bit 1.5.3 but at 2500 events/sec we see drops where 1.4.6 we see no drops. So there seems to be a degradation when we upgrade, we think the issues is on the input plugin.
In the past we saw this behavior and added some custom settings we add on the input to stop drops.
      Rotate_Wait 60
      Refresh_Interval 1
Did anything change between 1.5.3 and 1.4.6 that would cause performance degradation for high log rotations? We reverted to 1.4.6 for now but we are now blocked to upgrade until we can obtain the same performance behavior between the versions.
To Reproduce
I have attached the 2 k8s manifests using the fluent-bit dummy plugin being the main service container to generate load.
fluent-bit-manifest-version-perf-degrade-146-153.zip
- Steps to reproduce the problem:
- Alter manifest with legit splunk endpoint and token in the manifest or change to different OUTPUT for analysis.
- kubectl -n
apply -f - Run load tests observe log drops.
Expected behavior
Performance of 1.5.x improved or sustained from 1.4.6.
Your Environment
- Version used: 1.4.6 vs 1.5.3
- Configuration:
- Environment name and version Kubernetes 1.17
- Server type and version: AWS and Azure
- Operating System and version: coreos
- Filters and plugins: Tail input plugin.
Additional context
Data loss. We are seeing this happen on services that seem to be high in log rotation.
 ts3ng
ts3ng
All 5 comments
+1. Based on what I've seen, fluent-bit 1.5.3 just processes messages more slowly, and eventually cannot keep up anymore, skipping the rest of the rotated 256 MB log files (max files: 2). At the same log rate, a much larger percentage is tagged as coming from the rotated file (ending in .1). As we've seen when 1.4.6 cannot keep up (at much higher rates), it seems like inotify events get skipped, leading to fluent-bit not realizing the new name of a rotated file, and so it keeps tagging them as the main file (not ending in .1).
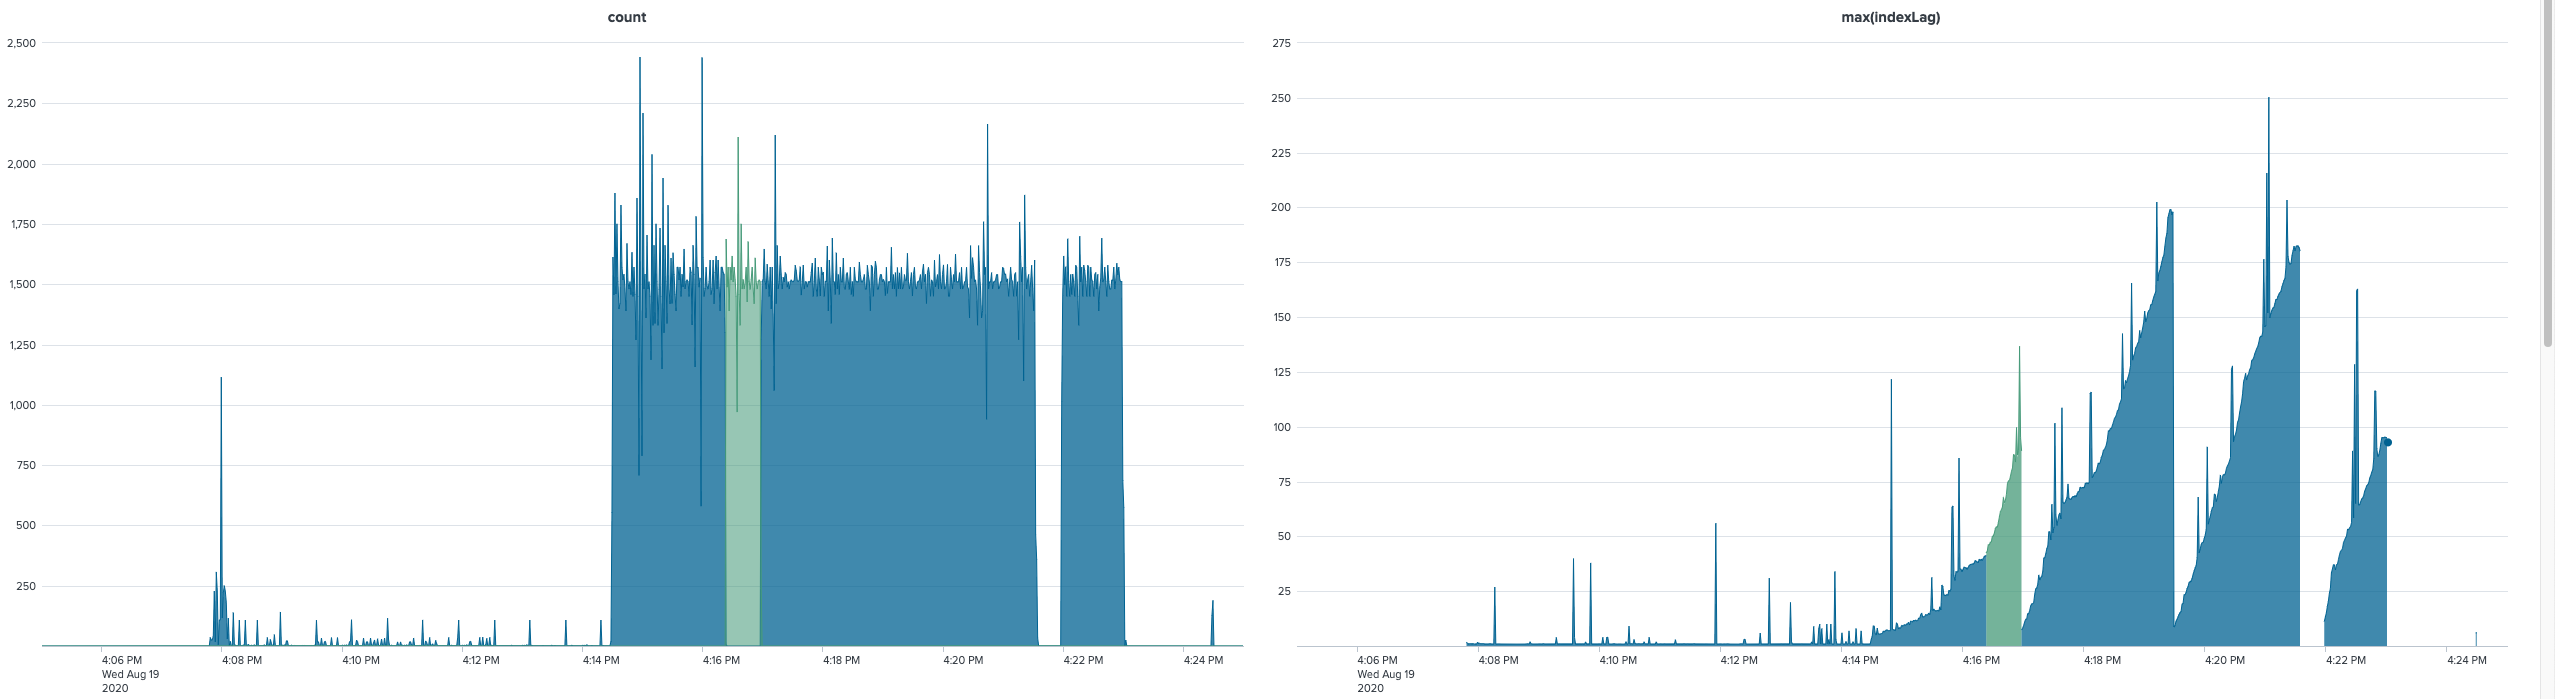
Resolution is one second (i.e. ~1500 log events per second). Green is when the file_path property in Splunk ends in .1. "indexLag" is calculated as _indextime-_time, i.e. the time (in seconds) by which Splunk indexed the event vs. when it actually happened. fluent-bit's performance acts as a lower bound, Splunk's own processing can add to that (I'm assuming that's where the brief spikes come from). As you can see, the index lag increases (presumably because we're logging faster than what fluent-bit can forward) and then drops suddenly (when it's done with the rotated file and sees more recent events). Every drop should have a green area before it, but that's not the case, and then the gap is where it wasn't able to finish a file, I think.
 DennisKehrig
on 26 Aug 2020
DennisKehrig
on 26 Aug 2020
@ts3ng @DennisKehrig Thank you both for this detailed report. I am the AWS maintainer of Fluent Bit, and recently I have seen a complaint from a user of one of the AWS outputs that sounds a lot like what you folks are seeing.
Unfortunately, I checked and there haven't been a lot of changes in the tail plugin since 1.4.6. Which means that if your report is correct, then the following statement from @DennisKehrig might be true: "Based on what I've seen, fluent-bit 1.5.3 just processes messages more slowly". That's worrying because it'll be difficult to narrow down what is causing this.
I think we will need @edsiper on this one.
 PettitWesley
on 27 Aug 2020
PettitWesley
on 27 Aug 2020
I've looked at when log messages arrive in Splunk (based on _indextime) and I'm seeing a less steady flow of messages this way. Basically both versions routinely manage to push the same typical number of messages per second into Splunk, but 1.5.3 somehow is slower than that more often, even had a 6s gap where no messages made it to Splunk at all.
I see 1.5.3 losing messages at much lower log rates than @ts3ng, but mine is a real world load that is much more taxing on the host machine, so my hunch right now is that it might be CPU related. Could it be that 1.5.3 consumes a lot more CPU for the same work?
DennisKehrig
on 28 Aug 2020
@DennisKehrig I have no reason to believe that that 1.5.3 would be more taxing on the CPU. But I'm not aware of all the changes that were made in the code between these two versions, may be something has changed. Someone needs to do some profiling/testing.
PettitWesley
on 31 Aug 2020
all, the problem was introduced in v1.5.3, the sockets were set to blocking mode. If you upgrade to v1.6.4 everything is fixed
 edsiper
on 11 Nov 2020
edsiper
on 11 Nov 2020
Related issues
 jsravn
·
31Comments
edsiper
·
78Comments
jsravn
·
31Comments
edsiper
·
78Comments
 fujimotos
·
132Comments
fujimotos
·
132Comments
 dawidmalina
·
31Comments
dawidmalina
·
31Comments
 hdiass
·
26Comments
hdiass
·
26Comments
Most helpful comment
all, the problem was introduced in v1.5.3, the sockets were set to blocking mode. If you upgrade to v1.6.4 everything is fixed