This is with Flow version 0.29.0, in our CI environment, which admittedly is not as resource-rich as our development laptops. Flow was working fine in our CI environment, with the exact same resources, under v0.26.0.
1) Does this indicate that the machine needs more RAM?
2) Is it possible to make the type-checker run with less shared memory?
[2016-07-28 01:15:11] Initializing Server (This might take some time)
[2016-07-28 01:15:11] executable=/usr/src/app/node_modules/flow-bin/vendor/flow
[2016-07-28 01:15:11] version=0.29.0
[2016-07-28 01:15:11] Parsing
[2016-07-28 01:15:13] Building package heap
[2016-07-28 01:15:13] Loading libraries
[2016-07-28 01:15:13] Running local inference
SharedMem.Out_of_shared_memory
 opensrcery
All 88 comments
i also got this problem in my laptop (osx, el capitan). Running flow will make the swapfiles getting bigger and bigger until i'm running out of disk space, I think it must be some kind of memory leak. The problem occured when using flow v0.27.0, v0.28.0 and v0.29.0. When using v0.26.0 there wasn't any problem
 arypurnomoz
on 28 Jul 2016
arypurnomoz
on 28 Jul 2016
Could you check with master? cc @gabelevi, who fixed a memory bug that will be in 0.30. Might be related...
 avikchaudhuri
on 28 Jul 2016
avikchaudhuri
on 28 Jul 2016
@avikchaudhuri, yes, I will check later today.
opensrcery
on 28 Jul 2016
The bin built against master seems to fix the memory issue. When will you be releasing 0.30.0?
opensrcery
on 29 Jul 2016
@opensrcken Awesome! 0.30 should go out early next week.
avikchaudhuri
on 30 Jul 2016
Hmm... A colleague and me are currently running into the same problem with 0.30.0. We have flow on our dev machines, and it just consumes all memory and swap until the HDDs are full and we need to reboot. This makes developing kind of a pain in the ass.
 frontendphil
on 9 Aug 2016
frontendphil
on 9 Aug 2016
@frontendphil Sorry that is happening, reopening...
 jamiebuilds
on 9 Aug 2016
jamiebuilds
on 9 Aug 2016
@thejameskyle nobodies perfect and going back to 0.26 solved the problem for now, so we don't have to work without flow
frontendphil
on 9 Aug 2016
@frontendphil Oh that's odd. Which operating system? How much physical memory is available? And how much swap was getting used?
 gabelevi
on 11 Aug 2016
gabelevi
on 11 Aug 2016
We're on latest Mac OS. I have 16GB of memory and my colleague 8.. Swap grows, till our HDDs run out of memory. I've seen 60GB of swap being used, but also 80GB on other machines..
frontendphil
on 11 Aug 2016
I'm seeing this too on Ubuntu 16.04, 8GB RAM, RES grows till I have to reboot.
0.26 works, however, with just 43M RES.
 unhammer
on 12 Aug 2016
unhammer
on 12 Aug 2016
still got this issue even when using 0.32.0 (osx el capitan)
arypurnomoz
on 4 Sep 2016
Me too.
Flow 0.32.0 on OsX El Capitan.
Available RAM 4 GB.
When running the flow process grows up to 10 GB of memory during the parsing task, then drop to 5 and raise again to 10 GB before producing the output.
 dej611
on 21 Sep 2016
dej611
on 21 Sep 2016
I think I finally know what's going on. I'm fixing it, expect something
pretty soon.
On Wednesday, September 21, 2016, dej611 [email protected] wrote:
Me too.
Flow 0.32.0 on OsX El Capitan.
Available RAM 4 GB.
When running the flow process grows up to 10 GB of memory during the
parsing task, then drop to 5 and raise again to 10 GB before producing
the output.—
You are receiving this because you modified the open/close state.
Reply to this email directly, view it on GitHub
https://github.com/facebook/flow/issues/2152#issuecomment-248564041, or mute
the thread
https://github.com/notifications/unsubscribe-auth/AFFNMQXlN6yYcwJ8wxgnloR7wL6VrHqPks5qsP3ngaJpZM4JWx77
.
avikchaudhuri
on 21 Sep 2016
Still there with flow 0.33 :(
dej611
on 30 Sep 2016
@dej611 can you describe your problem again? It's normal for flow to use
and release memory, the problem in other cases seemed to be memory leaking
forever. While there's still work to be done (and will be done), much of
the memory leak issue should be mitigated in 0.33.
On Friday, September 30, 2016, dej611 [email protected] wrote:
Still there with flow 0.33 :(
—
You are receiving this because you modified the open/close state.
Reply to this email directly, view it on GitHub
https://github.com/facebook/flow/issues/2152#issuecomment-250694337, or mute
the thread
https://github.com/notifications/unsubscribe-auth/AFFNMbQParjivWIEfE16C1w9T6LQtRnCks5qvM6zgaJpZM4JWx77
.
avikchaudhuri
on 30 Sep 2016
@avikchaudhuri 0.33.0 fixed the memory error. Thanks a lot!
arypurnomoz
on 2 Oct 2016
@avikchaudhuri
Currently I have flow going up to 10 GB of memory, then drop to 2 GB before starting raise again to 10 GB during the analysis. I want to isolate the issue, create a clean project so I can report something more more precise number for it this weekend.
dej611
on 3 Oct 2016
I've tried to reproduce this issue at home on two different projects on another MacBook Air but no luck.
Will try again in the office where I had this problem to isolate the issue with a simple project.
dej611
on 16 Oct 2016
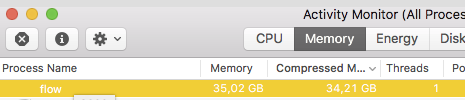
I am still experiencing this issue in Flow 0.33.0. I have 8GB RAM and it climbed to 18.3GB RAM in MacOS Activity Monitor. I am using built-in Flow support that comes with WebStorm 2016.3 EAP, so it may be attributed to the EAP's bugginess. However, the built-in flow support does use the flow-bin file.
 KylePalko
on 25 Oct 2016
KylePalko
on 25 Oct 2016
@KylePalko I have the same issue using Webstorm EAP and Flow, did u opened an issue there?
 sibelius
on 28 Oct 2016
sibelius
on 28 Oct 2016
@sibelius Good idea, I will do that now.
KylePalko
on 28 Oct 2016
@KylePalko could u link the webstorm issue here?
I wanna add some logs to it
sibelius
on 4 Nov 2016
I have the same issue when using Sublime Flow IDE and Nuclide in atom, so I think this is related to the autocomplete or type-at-pos commands which webstorm also presumably relies upon. If I disable the editor integrations I can't seem to replicate the issue by simply running flow manually.
(Macbook pro running sierra, flow eats all the swap and then I need to reboot)
 phpnode
on 7 Nov 2016
phpnode
on 7 Nov 2016
On v0.32.0, I was seeing the SharedMem.Out_of_shared_memory issue. Now on 0.34.0, I no longer see that issue but instead see Worker exited (code: 16) after the 'Running local inference' step.
(Macbook pro running El Capitan 10.11.6)
 jbbakst
on 7 Nov 2016
jbbakst
on 7 Nov 2016
in the latest Webstorm EAP flow is working fine
\o/
sibelius
on 11 Nov 2016
I experienced this today while using Flow in WebStorm 2016.3
Errors were not shown in WebStorm.

 levrik
on 23 Nov 2016
levrik
on 23 Nov 2016
I love flow. But disk consumption can be an issue.
My MBP has only a 128 Go SSD (8Go RAM).
I'ld like to force flow to stop eating disk space indefinitely (=defining memory consumption limits?).
Problem increases obviously when you have to keep opened more than 1 project at a time (more flow tasks).
When processing, I'm nearly ok (a bit too much space but...ok)...
But when flow tasks ends, it would be nice to be able to force flow to flush all disk space eaten.
I suspect that processing all
node_modulescontent does not help. But as far as I know it is necessary for flow (so that it knows about modules imported in the project)
Until now to free absolutely all space (closing all flow tasks is not effective), the only working solution is to reboot my computer.
 MacKentoch
on 12 Dec 2016
MacKentoch
on 12 Dec 2016

Having the same issue on OSX Sierra 10.12
➜ web-login git:(master) flow version
Flow, a static type checker for JavaScript, version 0.41.0
 bgdavidx
on 9 Mar 2017
bgdavidx
on 9 Mar 2017
Please edit your comments to add the value for $ flow version.
 nmn
on 9 Mar 2017
nmn
on 9 Mar 2017
I'm seeing the same issue.
Sierra 10.12, VSCode 1.10.2 (happened with 1.10.1 too)
$ flow version
Flow, a static type checker for JavaScript, version 0.40.0

 nickyhajal
on 12 Mar 2017
nickyhajal
on 12 Mar 2017
@nickyhajal try the newest version of Flow and report back. 0.41 is the newest version.
nmn
on 14 Mar 2017
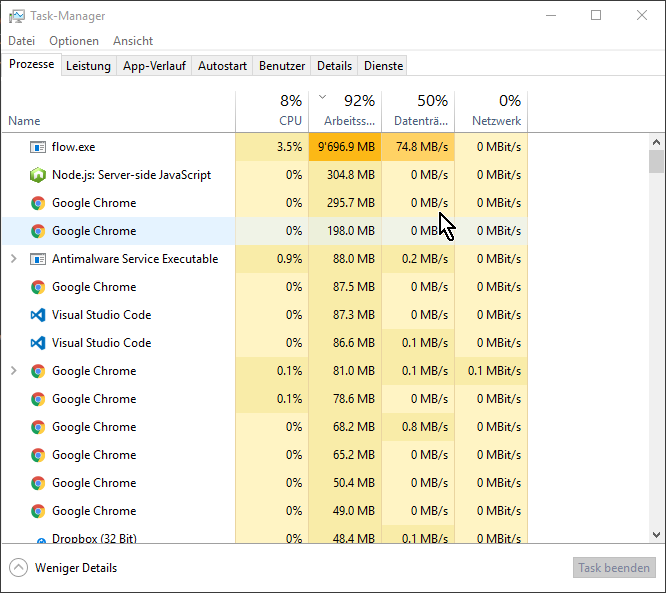
in mac 10.12.2, when i use vscode to edit js file, flow will out of my mac memory and all processes are terminated,this is my screenshot:

 wx-chevalier
on 20 Mar 2017
wx-chevalier
on 20 Mar 2017
I tried v0.44 today but got same issue again.... had to hard reset my AsusROG(128SSD/8Go/Windows10).
Maybe these infos can help:

 Sharlaan
on 14 Apr 2017
Sharlaan
on 14 Apr 2017
Same issue. OSX Sierra 10.12


 NickMalt
on 24 Apr 2017
NickMalt
on 24 Apr 2017
This also happens to me with the latest version (v0.44) on Bash on Windows. Tried version 0.26 and it works.
 gosukiwi
on 24 Apr 2017
gosukiwi
on 24 Apr 2017
0.43 has this issue as well on my MacBook Pro with macOS Sierra 10.12.4. Flow uses up to 17GB, while I have only 16GB in the machine.
[edit]
It turned out flow was analysing all node_modules packages as well. Added .*node_modules.* to the [ignore] block of the flowconfig. Now down to 38MB of memory usage.
[/edit]
 im-martijn
on 26 Apr 2017
im-martijn
on 26 Apr 2017
We've been using this workaround: https://github.com/facebook/flow/issues/3143#issuecomment-270946030
# .flowconfig
[options]
sharedmemory.hash_table_pow=21
 joeybaker
on 26 Apr 2017
joeybaker
on 26 Apr 2017
Running flow in my fairly small project on OSX causes the entire OS to lock up and programs to start pausing because there's no memory left.
 AndrewRayCode
on 1 May 2017
AndrewRayCode
on 1 May 2017
Same here. Attempting to use Flow version 0.45.0 with IntelliJ version 2017.1.2 but this issue is making it completely unusable.
As soon as I open any JavaScript file, Flow sits at around 10-12% CPU usage (6 cores) and steadily consumes memory until none is left. If I kill the process another one just starts up and does the same thing.
 SteveMellross
on 6 May 2017
SteveMellross
on 6 May 2017
Flow's about to blow (up my computer).
 robksawyer
on 7 May 2017
robksawyer
on 7 May 2017
Same here...I'm using atom and it's totally unusable as is...

 PCreations
on 15 May 2017
PCreations
on 15 May 2017
I was running into the same issue with flow 0.46.0, adding sharedmemory.hash_table_pow=21 as suggested fixed it for now. Previously it was just constantly restarting the server and using up swap (62GB was the max I saw it go before freezing my computer) until I had to restart my computer because everything started crashing.
 pib
on 23 May 2017
pib
on 23 May 2017
Sitting here with VS Code open. No files being checked as far as I can tell.
 chris-cooper
on 27 Jun 2017
chris-cooper
on 27 Jun 2017
sharedmemory.hash_table_pow=21 didn't help for me. I'm running flow 0.50.0, just updated from .49.0 trying to solve the issue. I find it interesting though, that it was working normally, and now it doesn't even start the server, well... it does start a server and then goes to town with memory and never completes local inference.
I can't recall doing any serious changes on the .flowconfig but I can't help but think that a recent change in my code could be causing this, considering it was working fine just yesterday.
Any suggestions on what I could be looking for in the code (or anywhere else) that could be driving flow crazy?
How could I get more details about flow execution? Anything that would help me debug.
[ignore]
.*/node_modules/*
.*/specs/preProcessWebpackAlias.js
.*/coverage/*
[include]
[libs]
[options]
all=true
module.name_mapper='^actions\/\(.*\)$' -> '<PROJECT_ROOT>/src/app/actions/\1'
module.name_mapper='^components\/\(.*\)$' -> '<PROJECT_ROOT>/src/app/components/\1'
module.name_mapper='^containers\/\(.*\)$' -> '<PROJECT_ROOT>/src/app/containers/\1'
module.name_mapper='^middlewares\/\(.*\)$' -> '<PROJECT_ROOT>/src/app/middlewares/\1'
module.name_mapper='^models\/\(.*\)$' -> '<PROJECT_ROOT>/src/app/models/\1'
module.name_mapper='^reducers\/\(.*\)$' -> '<PROJECT_ROOT>/src/app/reducers/\1'
module.name_mapper='^sagas\/\(.*\)$' -> '<PROJECT_ROOT>/src/app/sagas/\1'
module.name_mapper='^services\/\(.*\)$' -> '<PROJECT_ROOT>/src/app/services/\1'
module.name_mapper='^store\/\(.*\)$' -> '<PROJECT_ROOT>/src/app/store/\1'
module.name_mapper='^mocks\/\(.*\)$' -> '<PROJECT_ROOT>/mocks/\1'
This time a let it run it's course and well, it did crash at some point, these are the logs. I hope the exit code means something.
[2017-07-16 08:36:53] Initializing Server (This might take some time)
[2017-07-16 08:36:53] executable=/home/polo/.config/yarn/global/node_modules/flow-bin/flow-linux64-v0.50.0/flow
[2017-07-16 08:36:53] version=0.50.0
[2017-07-16 08:36:53] Parsing
[2017-07-16 08:36:54] Building package heap
[2017-07-16 08:36:54] Loading libraries
[2017-07-16 08:36:55] Resolving dependencies
[2017-07-16 08:36:55] Running local inference
Fatal error: out of memory.
Worker exited (code: 2)
Subprocess(7259): fail 2Worker.Worker_exited_abnormally(2)
 jhenriquez
on 16 Jul 2017
jhenriquez
on 16 Jul 2017
In my case, it was a silly problem. I was not ignoring my public directory, so flow was trying to infer the bundles.
running flow check --verbose is what helped me identify what it was doing. Hope this helps.
jhenriquez
on 16 Jul 2017
Deleting the local copy of my project and cloning a new version resolved this issue for me. I'll try to add more details if I run into this again.
 dmueller39
on 1 Aug 2017
dmueller39
on 1 Aug 2017
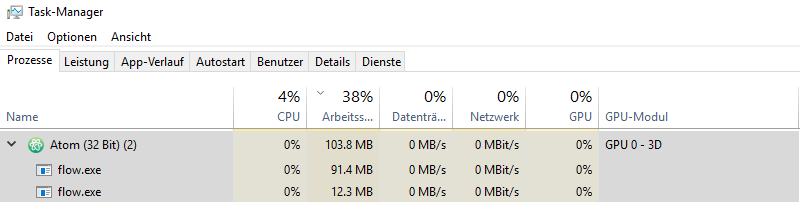
I am running flow-bin v0.56.0 on Windows 10 and node v.8.4.0
Until shortly I used atom and everything was fine.
Since I use vscode though, flow regularly consumes all my ram:
 barbalex
on 1 Oct 2017
barbalex
on 1 Oct 2017
This issue makes my capable computer unusable. I will have to stop using flow :-(
barbalex
on 2 Oct 2017
But that is no good Idea: I would have to change _a lot of_ code in all projects. Any alternatives?
barbalex
on 2 Oct 2017
I just realized that this issue is 16 months old. Any chance this will be tackled?
barbalex
on 2 Oct 2017
When I open vscode, flow starts grabbing cpu and ram.
It takes a several minutes but I need do nothing inside vscode to see flow's ram usage rise to over 11 gigabytes, by which time 96% of ram is in use.
CPU usage rises to about 14% too (by far the highest of any process).
Often additional flow processes appear, though they do not seem to use many ressources.
When I close vscode all the flow processes remain open and keep consuming all system ressources.
This seems to happen every time I open or close vscode.
Is there any way I can help debug this?
barbalex
on 2 Oct 2017
If I close vscode when flow has grabbed for instance 200 MB, that does not prevent flow from going on grabbing all the remaining ram.
barbalex
on 2 Oct 2017
Flow is - so far - much less obtrusive when I open the same project in Atom. So I guess this forces me to switch back from vscode to Atom.
barbalex
on 2 Oct 2017
@barbalex vscode flow plugins do not kill flow when you exit vscode, and start new ones when vscode starts. You can verify this with ps aux | grep flow after closing VSCode. Because Flow bricks computers I would not recommend using it for any projects.
AndrewRayCode
on 2 Oct 2017
Flow version 0.54.1
Mac OS 10.12.6
Node v8.4.0
using the Atom editor with nuclide
 Nederby
on 9 Oct 2017
Nederby
on 9 Oct 2017
Meanwhile this happens on my Windows 10 PC not only when using vscode but also when using atom. And now it even happens on my mac notebook :-(
The flow processes completely use up all system ressources. Which leads to very weird errors on all levels of apps and windows. I just spent an hour chasing ghost errors on all levels and restarting windows several times. Until I finally realized that flow was the cause behind this behaviour.
I am now completely out of options:
- all of my projects use flow
- flow makes my PC and my mac unusable
As this problem does not seem to be adressed it seems that my only option is one of these:
- stop using static typing > cry, then change thousands of lines of code
- use a different method of static typing
With the second option my hardest problem is: how to integrate typescript into create-react-app.
Is there an option other than flow that works with create-react-app out of the box?
barbalex
on 7 Nov 2017
This seems to be rather prominent in the issues. Maybe related issues found after a five minute search:
barbalex
on 7 Nov 2017
same issue on 0.55.0 also on latest 0.59.0
 Kepro
on 11 Nov 2017
Kepro
on 11 Nov 2017
Flow 59 is much better on this issue
sibelius
on 11 Nov 2017
Flow 59 is much better on this issue
That could actually be true. At least it does not happen all the time any more.
barbalex
on 11 Nov 2017
After working for an hour I have not had flow using all memory any more :-)
What still happens is that not all flow processes are killed when vscode is closed:

If this remains I am _one happy man_
barbalex
on 11 Nov 2017
@barbalex The issue with vscode was not an issue with Flow. It is fixed in the latest version of vscode (1.18).

levrik
on 11 Nov 2017
@levrik I had this problem also when using Atom. And on Windows as well as on macOS.
Now the problem does not seem to occur when using Atom any more either. Only remaining (in comparison minuscule) issue are the processes that remain after closing Atom:
barbalex
on 11 Nov 2017
@barbalex In vscode it takes about 15 seconds on my machine before the flow processes get killed.
levrik
on 11 Nov 2017
@levrik They remain on my machine, even after today's update of vscode
barbalex
on 11 Nov 2017
@barbalex 1.17.2 is an outdated version. The latest version with the fix included is 1.18.
levrik
on 11 Nov 2017
@levrik thanks
Still happening in v1.18.0 though.
But I really am _happy_ as this does not bother me :-)
barbalex
on 11 Nov 2017
@barbalex Mhh that's weird. Doesn't happen to me anymore since the upgrade to 1.18.
levrik
on 11 Nov 2017
Well, I don't know why but since a few days flow now uses all memory again on both my computers :-(
I am using:
- flow 0.59.0
- vscode 1.18.1
barbalex
on 23 Nov 2017
Sorry to say: flow is misbehaving again. I spend my whole day killing it's processes every few minutes after having all kinds of things go crazy on my computer while the cooler fan sounds like a power plant.
As this happens also on the notebook it kills it's batteries in no time.
Not to mention my poor nerves :-(
I have never said anything as rude sounding before in an open source project. But this is a high profile project that has an extremely serious flaw. So: please get your shit together and address this issue.
I know it is open source and I should really offer a pull request. But that would unfortunately be completely out of my league. Sorry.
barbalex
on 27 Nov 2017
@barbalex One thing that worked for me was carefully going over the project I was working on and making sure I was ignoring the right directories/files. For instance there was a file of uglified packaged js code, and flow was trying to parse/type check that whole thing.
I am NOT a maintainer, but I would guess that there is something going on with your project config otherwise this would be a much more widespread problem.
dmueller39
on 27 Nov 2017
@dmueller39 thanks a lot for your tip.
I am using create-react-app for all my projects and have this .flowconfig file in my root folder:
[ignore]
<PROJECT_ROOT>/build/.*
Plus one of my projects was never even built yet.
So I believe that flow does not check build residues.
The weird thing is that flow does not plague me 100% of the time. More like 60%. Once it seemed to work fine for about one week. Now it usually starts using all memory - but not always immediately.
So it is more likely to be caused by something in my code that does not always exist/run. Or something else on my system.
barbalex
on 27 Nov 2017
I see no one has actually pasted any code here, so it's hard to conclude, but I _have_ discovered one area that causes problems and that's reduce operations. Specifically reduce on arrays of objects that of potentially unknown shape - e.g. API responses. So for instance this will probably memory leak:
const result = apiResponse.reduce((running, entry) => {
  return [...running, entry]
}, [])
However if you apply types to both function arguments the memory leaks go away
type ApiResponseEntryType = {
  a: string,
  b: string,
}

const obj1 = apiResponse.reduce((
  running: Array<ApiResponseEntryType>,
  entry: ApiResponseEntryType
) => {
  return [ ...running, entry ]
}, [])
(Apologies if the code doesn't compute or actually trigger as I'm coding in the browser. But my point is 100% reproducible in all instances in my project)
 JofArnold
on 16 Feb 2018
JofArnold
on 16 Feb 2018
Great point @JofArnold, have you identified the same problem with other operations(map, filter, etc)?
 felippepuhle
on 16 Feb 2018
felippepuhle
on 16 Feb 2018
Just reduce.
JofArnold
on 16 Feb 2018
It's not an issue with how type annotations are added to any particular source file. It's an issue with the number of source files that are being checked. This is why nobody can post source code that demonstrates the issue.
The issue can be reproduced by doing this.
Create a directory containing a single JavaScript file.
Create a sibling directory containing several hundred JavaScript files.
Do not create a .flowconfig file in either of those directories or in any of their ancestor directories.
Now run flow in the original directory containing the single JavaScript file.
Flow will search upward for .flowconfig and not find one.
When it reaches your home directory, Flow will begin checking every JavaScript file below your home directory.
It will be really slow when it hits the directory containing hundreds of JavaScript files.
It should not be checking those files.
 mvolkmann
on 16 Feb 2018
mvolkmann
on 16 Feb 2018
That's definitely not the case for me. I've [ignore]'d all files, whitelisted just one, and actually only have one single source file where in I can turn the issue on and off by using what I mention in my comment above. The issue is 100% reproducible by running flow-bin 0.65.0 on the command line and automatically in vim. It is, for me, solely due to reduce. I'll see if I can post a project/test in due course 👍
JofArnold
on 16 Feb 2018
Note that your issue is real (I remember hitting it a while ago) but unrelated to my note above. I may raise a separate issue and test actually. Main thing is that people will discover my comment via Google Search for now
JofArnold
on 16 Feb 2018
@JofArnold can u create a repro of this?
@calebmer how can we provide breaking js tests to make sure flow does not have this kind of regressions?
sibelius
on 16 Feb 2018
No problem; I'll have a go tomorrow (Saturday) if I get chance.
JofArnold
on 16 Feb 2018
@sibelius @calebmer Here is a minimal repo that replicates the issue. https://github.com/JofArnold/flow-memory-leak-test
Note: there's a huge amount of stuff in node_modules. Sorry for that. I've included everything as I've not had time to filter them out.
So the cause seems to be a type file including another type file combined with a reduce. If you remove the two type files and where those types are used I believe the reduce doesn't trigger the bug.
JofArnold
on 17 Feb 2018
Turns out it needs moduleNameMapper in the package.json too. Let me know if you have issues 👍
JofArnold
on 17 Feb 2018
@JofArnold
I tried your fix and it works great for me.
Thank you for the problem identification and furthermore for the fix.
:+1:
 RaynalHugo
on 22 Mar 2018
RaynalHugo
on 22 Mar 2018
@JofArnold
Thanks! Had memory leak in my flow extension for vs-code. After I added types to .reduce method, it had gone.
 ilgiznice
on 6 Apr 2018
ilgiznice
on 6 Apr 2018
I have the same problem, flow eating up all my ram, only killall flow helps.
I use flow 0.87.0 and have no reduce() in my code.
Is there any easy way to debug it, to help pinpointing this issue? I was not able to reproduce it with a small repo.
This holds us from using flow at all as it freezes our computers completely.
 burka
on 29 Nov 2018
burka
on 29 Nov 2018
We've just today run into a similar issue where flow was using over 10 GB of ram on one of our Windows 10 dev machines; computer was extremely slow. We were using Visual Studio Code v131.1, Flow-language-support 1.1.0. I have to agree with my fellow team members that is a great detriment to using Flow to have to kill it when the computer starts becoming slow on Windows, even if it gives very helpful messages and annotations. It would be reassuring for our own usage of Flow to know when, or even if high memory usage for large node_modules folders are a priority to fix.
 jeffvandyke
on 28 Feb 2019
jeffvandyke
on 28 Feb 2019
I am running flow on a read-only file system and getting this issue on very trivial JS file.
Input:
// @flow

import type test from './something'
Error:
{
  "flowVersion":"0.108.0",
  "exit":{
    "code":15,
    "reason":"Out_of_shared_memory",
    "msg":"Out of shared memory:\nRaised at file \"map.ml\", line 135, characters 10-25\nCalled from file \"hack/utils/collections/myMap.ml\", line 15, characters 26-36\nRe-raised at file \"src/core/lwt.ml\", line 2999, characters 20-29\nCalled from file \"src/unix/lwt_main.ml\", line 26, characters 8-18\nCalled from file \"src/commands/checkCommands.ml\", line 159, characters 29-88\nCalled from file \"src/commands/commandUtils.ml\", line 13, characters 4-32\n"
  }
}
I tried to use --sharedmemory-dirs=/tmp as well as --temp-dir=/tmp and flow is still returning me this error. It looks like something is trying to write to the disk but unsuccessfully. Is there any other option I can change to /tmp that is the only writable?
 michal-simon
on 29 Sep 2019
michal-simon
on 29 Sep 2019
Related issues
 funtaps
·
3Comments
funtaps
·
3Comments
 l2silver
·
3Comments
l2silver
·
3Comments
 philikon
·
3Comments
philikon
·
3Comments
 davidpelaez
·
3Comments
davidpelaez
·
3Comments
 glenjamin
·
3Comments
glenjamin
·
3Comments
Most helpful comment
I see no one has actually pasted any code here, so it's hard to conclude, but I _have_ discovered one area that causes problems and that's
reduceoperations. Specificallyreduceon arrays of objects that of potentially unknown shape - e.g. API responses. So for instance this will probably memory leak:However if you apply types to both function arguments the memory leaks go away
(Apologies if the code doesn't compute or actually trigger as I'm coding in the browser. But my point is 100% reproducible in all instances in my project)