Flipper: Hermes Debugger appears to connect but is empty on Flipper 0.55 win in clean RN 0.63.2 project
🐛 Bug Report
Hermes Debugger simply does nothing when connected to a clean RN 0.63.2 project with Hermes enabled on windows. Elements, Console, Sources, Network, Application, etc are all empty of normal content. Doctor passes all tests. Remote debugging is off. No other RN apps running. Verified Hermes running. Android SDK is valid and accessible. All other Flipper functions work fine. There are no problems indicated in the Flipper debug logs.
edit: Sometimes the "Debugging connection was closed" window pops up in the Hermes Debugger. It seems it can be dismissed by clicking outside of it. Pushing "Reconnect DevTools" flashes the window as if refreshing but has no effect.


Debug logs:
(electron) crashReporter.start is deprecated in the renderer process. Call it from the main process instead.
Secure server started on port 8088 server
Certificate server started on port 8089 server
Device connected: TestCleanRNAndroidErrors#Android#sdk_gphone_x86_64_arm64 - 11 - API 30#emulator-5554 server
{id: 0, method: "getPlugins", params: undefined}
"message:call"
Device client initialised: TestCleanRNAndroidErrors#Android#sdk_gphone_x86_64_arm64 - 11 - API 30#emulator-5554. Supported plugins: CrashReporter, Databases, Fresco, Inspector, Network, Preferences, React server
To Reproduce
- npx react-native init TestApp
- set
enableHermes: truein build.gradle - yarn react-native run-android
- Observe that there is no content in the hermes debugger tab of Flipper and no relevant content in Flipper debug logs indicating any sort of issue.
Environment
- Android API 30 on Android Studio emulator x86_64 google_apis
- React Native 0.63.2 (fresh project, only change is
enableHermes: true) - Flipper 0.55.0
- Windows 10 insider preview build 20206.rs_prerelease_200828-1431
 AndrewMorsillo
All 14 comments
I've reproduced the same issue on my Windows 10 machine. I'm wondering wether Hermes debugger works for someone on Win 10?
 nikoant
on 8 Sep 2020
nikoant
on 8 Sep 2020
Same problem here
 cklinx
on 21 Sep 2020
cklinx
on 21 Sep 2020
Same problem for me
 petr7555
on 1 Nov 2020
petr7555
on 1 Nov 2020
RN 0.63.3
IOS
Nothin in Hermes tab as well.
I think Javascript debugging is not quite working with Flipper & Hermes which make this tool useless for me - I mean: debugging, breakpoints, variables is the basic.
Please correct me if I'm wrong and there is a way to debug.
 chenop
on 8 Dec 2020
chenop
on 8 Dec 2020
Same issue. Are there any solutions?
 alexfov
on 12 Jan 2021
alexfov
on 12 Jan 2021
Having the same issue. I am unable to run on my windows machine. In ios, it works well.
 nishan-wtv
on 24 Feb 2021
nishan-wtv
on 24 Feb 2021
Is there a solution yet ?
 batuhansahan
on 1 Apr 2021
batuhansahan
on 1 Apr 2021
Same problem for me.
 Oraci
on 4 Apr 2021
Oraci
on 4 Apr 2021
Would be great if someone with a windows machine at hand would be interested in taking a closer look at this, our wrapper is pretty thin (plugin source), so it would be great if someone could investigate a bit deeper and check if...
- Stand alone debugging does work: https://reactnative.dev/docs/hermes#debugging-js-on-hermes-using-google-chromes-devtools
- If there are any errors in the Flipper log / Flipper devtools
- navigating to http://localhost:8081 lists the correct debugging targets
 mweststrate
on 6 Apr 2021
mweststrate
on 6 Apr 2021
same problem
 pranaydutta89
on 12 Apr 2021
pranaydutta89
on 12 Apr 2021
Same issue here.
localhost:8081/json shows the following:
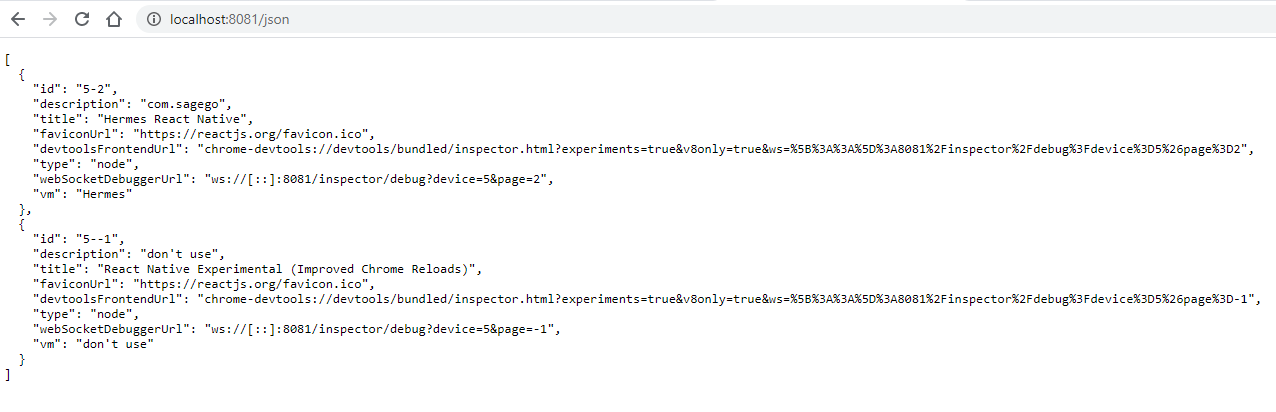
Flipper shows error connecting to websocket. I wonder if it is because of the IPV6 webSocketDebuggerUrl.
Workaround
I fixed it by starting metro with react-native start --host 0.0.0.0. After that webSocketDebuggerUrl is ws://localhost:8081/inspector/debug?device=0&page=2.
For an older app I needed to run with react-native start --host localhost.
Breakpoints don't seem to trigger though.
 patrickgalbraith
on 14 Apr 2021
patrickgalbraith
on 14 Apr 2021
@mweststrate Looks like this is an issue in metro. I've opened https://github.com/facebook/metro/pull/662 which should hopefully fix this by providing a valid IPV6 localhost websocket url.
I had a look at the chrome developer tools source and how it initialises the connection and it is done by creating a new WebSocket(...) and passing the webSocketDebuggerUrl (which makes sense).
As you can see ws://[::] is not a valid url:

patrickgalbraith
on 16 Apr 2021
same problem on 0.64.2
 ghasemikasra39
on 30 Jun 2021
ghasemikasra39
on 30 Jun 2021
Working in 0.98.0 starting bundle manually with the command bellow:
react-native start --host localhost
 eltonea
on 28 Jul 2021
eltonea
on 28 Jul 2021
Related issues
 davidmcraejr
·
4Comments
davidmcraejr
·
4Comments
 justintuchek
·
3Comments
justintuchek
·
3Comments
 xstable
·
4Comments
xstable
·
4Comments
 richardtop
·
3Comments
richardtop
·
3Comments
 bojankoma
·
4Comments
bojankoma
·
4Comments
Most helpful comment
@mweststrate Looks like this is an issue in metro. I've opened https://github.com/facebook/metro/pull/662 which should hopefully fix this by providing a valid IPV6 localhost websocket url.
I had a look at the chrome developer tools source and how it initialises the connection and it is done by creating a new WebSocket(...) and passing the webSocketDebuggerUrl (which makes sense).
As you can see
ws://[::]is not a valid url: