Fl_chart: show dotData with x- and y-values instead of y-value only
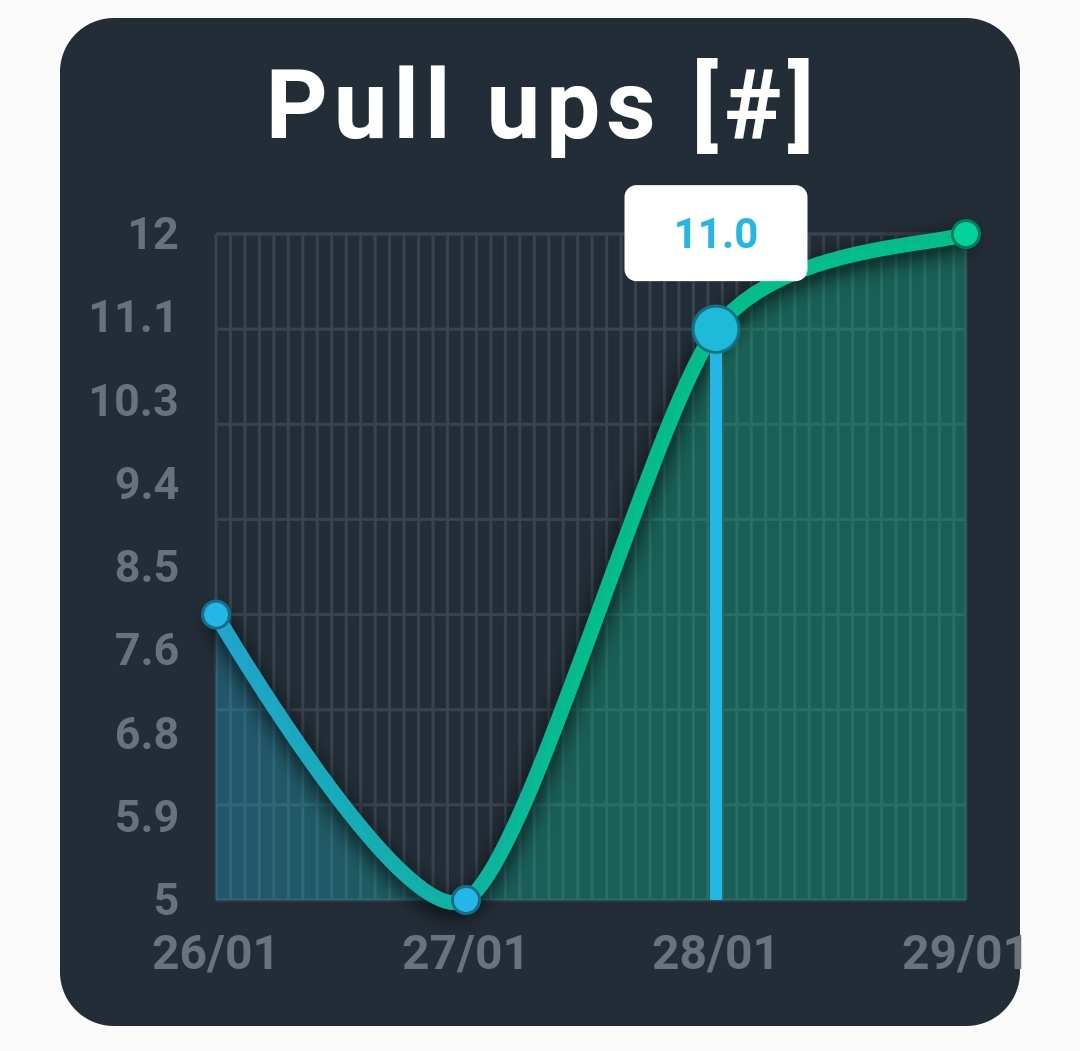
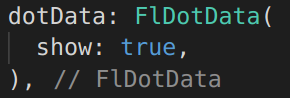
Currently, by opting to show dotData only the y-value is shown.
It would be great to be able to show the x-value in the same box. For instance:
x = 28/01
y = 11.0
 lgwds
lgwds
All 2 comments
You must override the LineTouchData then override the touchTooltipData.
I know it is complicated. We will improve its accessibility.
BTW check this sample code, We did something like that.

 imaNNeoFighT
on 30 Jan 2021
imaNNeoFighT
on 30 Jan 2021
👍1
Thanks, this works! :)
lgwds
on 1 Feb 2021
👍1
Was this page helpful?
0 / 5 - 0 ratings
Related issues
 wukongssl
·
3Comments
wukongssl
·
3Comments
 joaorpalma
·
3Comments
joaorpalma
·
3Comments
 alexodus
·
3Comments
alexodus
·
3Comments
 enyo
·
4Comments
enyo
·
4Comments
 davidmarinangeli
·
6Comments
davidmarinangeli
·
6Comments