Firebase-js-sdk: calling firebase.initializeApp(...) creates ~ 2 event listeners / seconds from then on (Chrome)
- Operating System version: Win10 64bit
- Browser version: Chrome 71
- Firebase SDK version: 5.5.8 & 5.7.0
- Firebase Product: firebase-app
Make an html file with boilerplate, and in head:
- Load these scripts: firebase-app.js & firebase-auth.js
- Put this in a script with your project infos:
firebase.initializeApp( {
    apiKey: '...',
    authDomain: '...',
    databaseURL: '...',
    projectId: '...',
    storageBucket: '...',
    messagingSenderId: '...'
})
- Open html file in Chrome and open devTools -> performance monitor
see the number of event listeners constantly rise until garbage collection.
 ncodefun
All 23 comments
I found a few problems with this issue:
- I couldn't figure out how to label this issue, so I've labeled it for a human to triage. Hang tight.
- This issue does not seem to follow the issue template. Make sure you provide all the required information.
 google-oss-bot
on 7 Dec 2018
google-oss-bot
on 7 Dec 2018
@wti806 There appears to be a memory leak in auth. Can you please take a look?
 Feiyang1
on 19 Dec 2018
Feiyang1
on 19 Dec 2018
@Feiyang1 this does not seem to be leak in auth. I can reproduce the issue just by importing firebase and calling the initializeApp function.
This seems to be a issue for long running applications. Would be nice to get some feedback, a workaround or preferably a fix.
 FallenRiteMonk
on 21 Mar 2019
FallenRiteMonk
on 21 Mar 2019
initializeApp automatically initialize Auth if Auth is being imported.
The number of listeners only increases when Auth is included. I can see it right away (don't need to be long running).
@FallenRiteMonk Maybe you are talking about a different issue?
Feiyang1
on 21 Mar 2019
@Feiyang1 no it should be exactly this one as I can see the 2 listeners per second being added in the chrome dev tools. I didn't know that, then it might still be auth that makes the problem as i import all of firebase.
I'll try to analyse it furter, but in the mean time, is there something I can do to prevent it? Or do I have to wait for a fix (or even try to fix it my self and make a PR)?
FallenRiteMonk
on 21 Mar 2019
@Feiyang1 you were right, it is a auth problem.
I have create a small reproduction of the problem,
code: https://stackblitz.com/edit/js-1bvnlf
test page: https://js-1bvnlf.stackblitz.io/
Steps: Open test page, open chrome dev tools, do a performance analysis over a couple of seconds
result:

removing the import of "@firebase/app" prevents the problem from happening.
FallenRiteMonk
on 21 Mar 2019
I fixed my issue with this by leaving Firebase and moving to AWS/NodeJS/MongoDB. You'd be surprised at how much more control and options you have. Auth is easy and NodeJS is what the "Firebase Functions Server" is. Applying "security rules" to db access is way better as you have more control. The best part is you're not loading any bloated up client libraries in your javascript. You make asynchronous http calls and process the return. If you're going for the "realtime" effect then socket.io is easy enough to implement and you're all set.
This is such a critical problem that was reported months ago. Having a Firebase website crash client browsers for months until they fix it isn't something I plan on building a product around.
 grant1842
on 21 Mar 2019
grant1842
on 21 Mar 2019
Any progress here? I have the same problem without any workaround!
I have a long running monitoring app which starts to become slow and laggy due to this problem.
On Safari and Edge it got even as far as killing the whole browser tab after a few hours of running.
 obirider
on 4 Apr 2019
obirider
on 4 Apr 2019
This behavior existed since we launched the SDK. We set polling functions to listen to indexedDB changes to detect cross tab changes (user opens multiple tabs and either signs in or signs out or modifies the user in one tab, etc). The session will be synchronized across the tabs.
Unfortunately there are no cross browser reliable API to detect changes on indexedDB. There is an experimental API for this but until it is a W3C standard, we can't use it.
If you don't require this functionality, our V6 modularization efforts will allow you to switch to localStorage which has storage events for detecting changes cross tabs, and possibly will provide you the ability to define your own storage interface.
 bojeil-google
on 17 Apr 2019
bojeil-google
on 17 Apr 2019
Are there any plans to revisit this as I can see that it is still an open issue even with the latest version as the event listeners are increasing linearly without bounds it would seem.
 shaunwallace
on 17 Jul 2019
shaunwallace
on 17 Jul 2019
@Feiyang1 @wti806 Is there any workaround for this issue? Anything really?
This is critical bug for our app because it requires the tab to be always open for more than 20 hours
 tolotrasamuel
on 29 Nov 2019
tolotrasamuel
on 29 Nov 2019
Isn't this fixed in #1121?
 joscmw95
on 10 Dec 2019
joscmw95
on 10 Dec 2019
The issue that 2 listeners are added per second has already been fixed. You can try from here: https://js-1bvnlf.stackblitz.io
 wti806
on 10 Dec 2019
wti806
on 10 Dec 2019
This issue still exists for me. @wti806 The demo too shows this isn't fixed.
ncodefun
on 11 Dec 2019
Still reproduces at the 0.5.0
 tabtrader
on 18 Dec 2019
tabtrader
on 18 Dec 2019
Seriously? A confirmed, reproducible memory leak at a rate of ~ 5MB a minute in Google's official SDK for A YEAR AND A HALF???? From v5 (first report) to the latest [email protected], over 3 major versions? For a product which is meant for SPAs?

I'm speechless. I wouldn't have complained about any open source product which is maintained by volunteers and would have dug in myself to fix. But Firebase is maintained by paid google employees for a proprietary product. I mean, 99% of Firebase apps on the web require auth and they are all affected. :exploding_head:
Edit: I was hoping to overcome the issue by using the new service worker sessions, which _"eliminate the need to include Firebase Auth source code on each page"_, but the exact same problem is reproduced in the demo app linked in the docs.

Edit2: Apparently, if you wait long enough, the number of listeners drops from over 1300 to 100:

The interesting part is that the event listener count drop doesn't immediately GC the memory. The memory is reclaimed too, eventually - if you wait a few more minutes. Very strange. :thinking:
 elektronik2k5
on 11 May 2020
elektronik2k5
on 11 May 2020
I thought the leak is fixed and the linearly increasing listener count is expected behavior and will be removed upon GC? https://stackoverflow.com/a/59259004/9758160
joscmw95
on 12 May 2020
@joscmw95 thanks for the very detailed info. Basically, you're saying that Chrome DevTools real time memory usage metrics are unreliable? If true, it seems like an even worse problem to me cause it means that those numbers are basically useless. I find it hard to believe that such a fundamental issue would be overlooked by Blink, Chrome and DevTools engineers.
I wish Firefox had similar/better tools to monitor these metrics so we could compare the two.
As for the bug itself, even though the event listeners and memory are periodically cleaned, the current behaviour seems broken. I mean, even if for some good reason it can't be prevented, then at least the cleanup should be triggered much more often.
elektronik2k5
on 12 May 2020
The memory leak in the original issue has been fixed. What we're seeing now is normal memory growth that is eventually garbage collected. We'd like to eventually reduce our total memory usage but that's long-term and out of scope for this issue.
 MeghaB
on 12 May 2020
MeghaB
on 12 May 2020
@elektronik2k5 The tone of your feedback is unhelpful and not up to the standards of the Firebase community. If you find a bug in the future please open a new issue and follow the guidance of the issue template and contributing guide
MeghaB
on 12 May 2020
@MeghaB I am afraid @elektronik2k5 is just saying what everybody is thinking. On our end, this bug makes it impossible to use the firebase js client on our browser side web app (a game). The memory/event listener leak eventually makes the game unplayable. We had to resort to reverting to server side authentication as as result, and lost a lot of time.
 jtestard
on 18 May 2020
jtestard
on 18 May 2020
Adding here parts of my correspondence with Firebase support for the sake of transparency:
Although the issue was closed, claiming that it is resolved, it clearly isn't.
You can observe the memory leaking on the documentation page:
- Open https://auth-service-worker.appspot.com/?authuser=0.
- Open Performance monitor in DevTools and enable tracking the JS event listeners count
- Observe listener count increasing at a rate of 2 per second
- Open Chrome's Task Manager, find the relevant tab
- Observe Memory footprint and JavaScript memory increasing continuously
The "fix" does clear the listener count and memory usage every few minutes - but during that interval the memory increases continuously. I'd categorize that as a temporary hotfix/bad workaround and not a proper resolution of the root root cause. If there's no resources for a proper fix, then at the very least the memory clearing should be triggered every few seconds instead of every few minutes.
I mean, really, on the one hand Google advocates for using best practices on the web and offers tooling like DevTools and Lighthouse - on the other hand this bug is affecting every single Firebase web app - wasting CPU, memory and as a result device battery. Just the few minutes it took me to write this response the event handler count has reached from 100 to over 2000 and the memory consumption from 60MB to 90MB.
This can't possibly be considered as "fixed" and I believe Firebase users deserve better.
Responding later to a request for more details and screenshots:
Looking at your screenshot, the event listener count is clearly seen constantly increasing. That's exactly the problem I'm pointing out. The other way the issue is observable is in memory usage.
Here, a few seconds after opening a the tab in question:
Memory footprint is just under 37MB and 8,600/5,300k JavaScript memory - highlighted in the selected tab of the task manager.Same tab after just 5 minutes:
Memory footprint is just over 53MB and 8,900/5,900k JavaScript memory.And again, after a few more minutes:
Memory footprint is at 87MB and 9,900/7,400k JavaScript memory.Should I go on? I mean it is an idle tab, which I opened less than 20 minutes ago.
At some point it does reset. But this isn't "fixed" or normal.


I think I'm out of quota for images per thread, so _
elektronik2k5
on 19 May 2020
Adding some new information I discovered today when collecting data for Firebase support, which are working on this issue.
On an older (but still modern) laptop the CPU load 2 hours after opening the same tab looks like so:

And here you can clearly see the moment I closed that single tab:

My other, newer laptop tells a similar story:
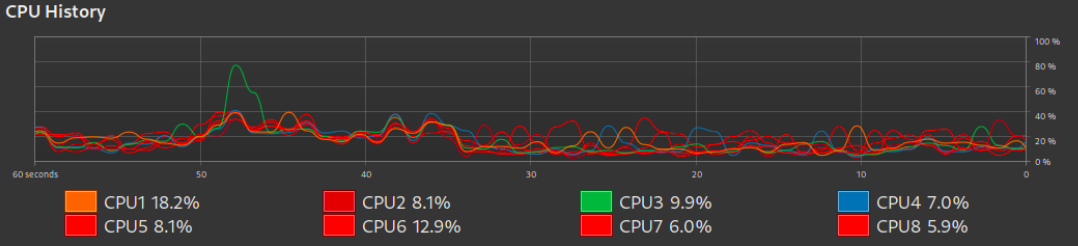
I closed the tab at around the 35s mark - though it is much harder to spot.
elektronik2k5
on 24 May 2020
Related issues
 henrylearn2rock
·
4Comments
henrylearn2rock
·
4Comments
 suparnavg
·
3Comments
suparnavg
·
3Comments
 fabianmarcus
·
3Comments
fabianmarcus
·
3Comments
 camden-kid
·
4Comments
camden-kid
·
4Comments
 stamler
·
3Comments
stamler
·
3Comments
Most helpful comment
Seriously? A confirmed, reproducible memory leak at a rate of ~ 5MB a minute in Google's official SDK for A YEAR AND A HALF???? From v5 (first report) to the latest
[email protected], over 3 major versions? For a product which is meant for SPAs?I'm speechless. I wouldn't have complained about any open source product which is maintained by volunteers and would have dug in myself to fix. But Firebase is maintained by paid google employees for a proprietary product. I mean, 99% of Firebase apps on the web require auth and they are all affected. :exploding_head:
Edit: I was hoping to overcome the issue by using the new service worker sessions, which _"eliminate the need to include Firebase Auth source code on each page"_, but the exact same problem is reproduced in the demo app linked in the docs.
Edit2: Apparently, if you wait long enough, the number of listeners drops from over 1300 to 100:

The interesting part is that the event listener count drop doesn't immediately GC the memory. The memory is reclaimed too, eventually - if you wait a few more minutes. Very strange. :thinking: