Firebase-ios-sdk: iOS OOM crash on GDTCORFlatFileStorage
[REQUIRED] Step 1: Describe your environment
- Xcode version: 12.0
- Firebase SDK version:
FirebasePerformance (3.3.0):
    - FirebaseCore (~> 6.9)
    - FirebaseInstallations (~> 1.5)
    - FirebaseRemoteConfig (~> 4.7)
    - GoogleDataTransport (~> 7.0)
- Installation method:
CocoaPods - Firebase Component: Performance
[REQUIRED] Step 2: Describe the problem
we got an oom crash, the firebase don't catch the crash.we use some other method got this crash stack.
-[GDTCORFlatFileStorage pathsForTarget:eventIDs:qosTiers:mappingIDs:onComplete:]_block_invoke_2 (in xxx) (GDTCORFlatFileStorage.m:681)

[GDTCORFlatFileStorage checkForExpirations]_block_invoke (in xxx) (GDTCORFlatFileStorage.m:0)
Most of the crash user are crash when start input message. when start input the memory useage increase fast.
Steps to reproduce:
I can't reproduce.
Relevant Code
Any help apperciate.
 chinabrant
All 13 comments
Can you run an Instruments trace with the latest version of FirebasePerformance?
 morganchen12
on 19 Nov 2020
morganchen12
on 19 Nov 2020
Can you run an Instruments trace with the latest version of FirebasePerformance?
i can't reproduce this crash.
chinabrant
on 19 Nov 2020
Even if you cannot get the app to crash, it would still be useful to see the memory spike and allocations that happen when the user starts inputting a message.
morganchen12
on 19 Nov 2020
I got the same issue, all those people are from china Mainland, Is it possible to the sdk to keep trying something ?
 KorolZhu
on 19 Nov 2020
KorolZhu
on 19 Nov 2020
This potentially may be related to #6903.
 maksymmalyhin
on 19 Nov 2020
maksymmalyhin
on 19 Nov 2020
I'll investigate on my end if GoogleDataTransport may lead to excessive memory usage in the case of bad network connectivity.
@KorolZhu The info on your application memory usage is still needed as the core reason of the may be outside Firebase. Thanks!
maksymmalyhin
on 19 Nov 2020
@maksymmalyhin @morganchen12
Hello, Let me first describe the issue I encountered
The user opens the app, and then opens the app's memory usage display and CPU usage display. you will see that the memory keeps growing, and the speed is very fast. In about one minute, it grows to 2098M (OOM limit), and then crash.
in the whole process the CPU usage always being in 60% - 90%
Then I integrated oom monitoring. When oom happens, I grab the stack information. The main stack information is as follows (not very perfect, I can only take a look at it)
    {
        "tag": "MemStat",
        "info": "",
        "scene": "",
        "name": "Malloc 1.78 KiB",
        "size": 1087314526, (Memory size allocated:1036M)
        "count": 597754,
        "stacks": [
            {
                "caller": "5a94c9aac64532278938f578b18c9b9c@20415780",
                __44-[GDTCORFlatFileStorage checkForExpirations]_block_invoke (in xxx) (GDTCORFlatFileStorage.m:0)

                "size": 1087314526,
                "count": 597754,
                "frames": [
                    {
                        "uuid": "32e63b4b0cb63798a0d0ceb99793bb08",
                        "offset": 62940

                        libsystem_malloc.dylib

                    },
                    {
                        "uuid": "32e63b4b0cb63798a0d0ceb99793bb08",
                        "offset": 65616

                        libsystem_malloc.dylib

                    },
                    {
                        "uuid": "14223db57ae5302a9495de26da6f9724",
                        "offset": 102720

                        Foundation

                    },
                    {
                        "uuid": "14223db57ae5302a9495de26da6f9724",
                        "offset": 331816

                        Foundation
                    },
                    {
                        "uuid": "14223db57ae5302a9495de26da6f9724",
                        "offset": 331624

                        Foundation
                    },
                    {
                        "uuid": "5a94c9aac64532278938f578b18c9b9c",
                        "offset": 20415780

                        __44-[GDTCORFlatFileStorage checkForExpirations]_block_invoke (in xxx) (GDTCORFlatFileStorage.m:0)

                    },
                    {
                        "uuid": "e749b178a64d336383ef863a6073a06b",
                        "offset": 8500

                         libdispatch.dylib

                    },
                    {
                        "uuid": "e749b178a64d336383ef863a6073a06b",
                        "offset": 13740

                         libdispatch.dylib

                    },
                    {
                        "uuid": "e749b178a64d336383ef863a6073a06b",
                        "offset": 39524

                         libdispatch.dylib

                    },
                    {
                        "uuid": "e749b178a64d336383ef863a6073a06b",
                        "offset": 42136

                         libdispatch.dylib
                    },
                    {
                        "uuid": "e749b178a64d336383ef863a6073a06b",
                        "offset": 80476

                         libdispatch.dylib
                    },
                    {
                        "uuid": "1fb3935b8af63f3cbb260b1f8e6f6fcd",
                        "offset": 14104

                         libsystem_pthread.dylib
                    },
                    {
                        "uuid": "1fb3935b8af63f3cbb260b1f8e6f6fcd",
                        "offset": 39368

                         libsystem_pthread.dylib
                    }
                ]
            }
        ]
    }
According to the above stack information, it is preliminarily determined that it is the firebase SDK problem, and then I try to modify the source code of the SDK:

Continue to contract out to the user for verification, but the problem is not solved, the memory will continue to grow, but the growth is very slow, and the CPU utilization rate is still the same.
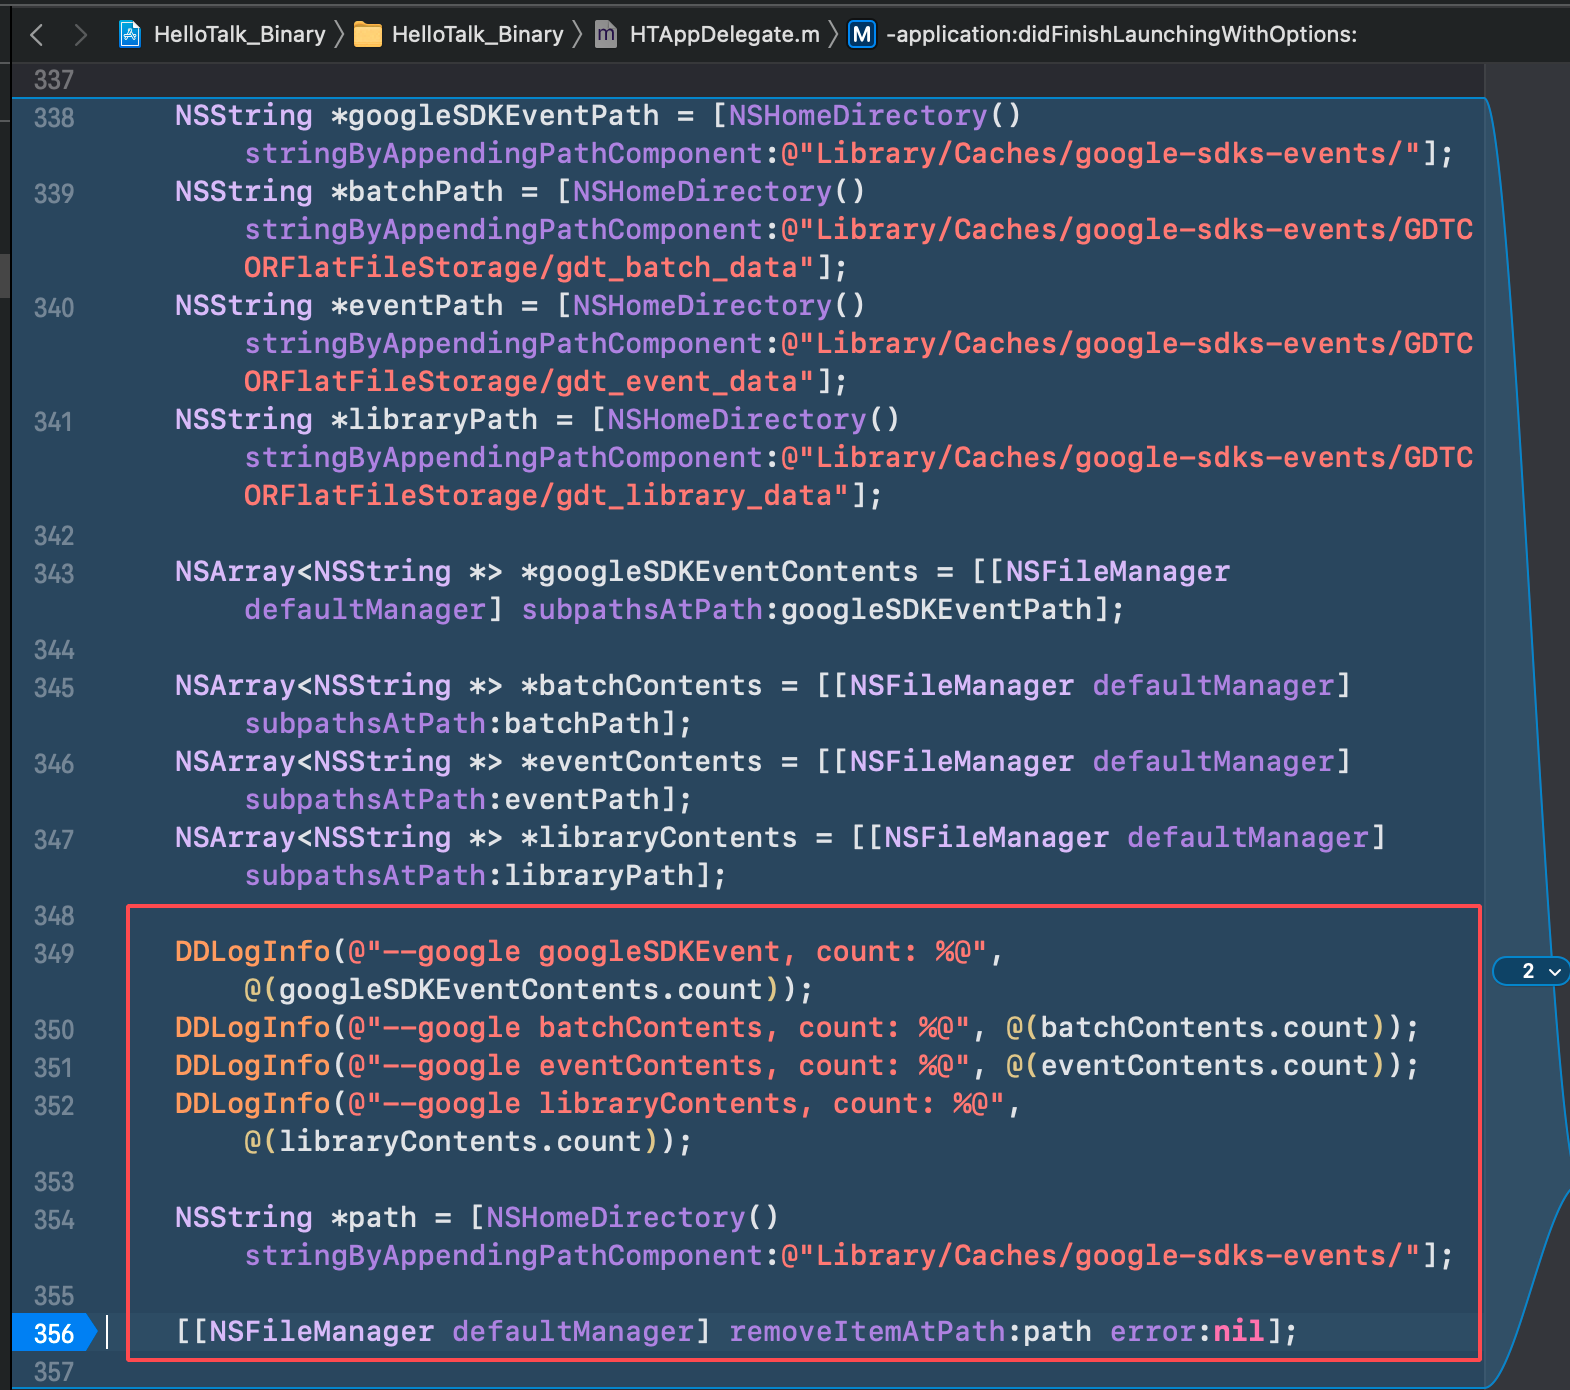
Then I went on to try to modify it as follows:
- print the directory file count : xxx/Library/Caches/google-sdks-events/, then remove this path
- remove Firebase/Core Firebase/Analytics Firebase/Performance Firebase/Crashlytics, and remove all those call: [FIRAnalytics logEventWithName:@"xxx" parameters:xxx];
- remove this call [FIRApp configure];


Continue to contract out to the user for verification, and the user's log is printed as follows:
2020/11/19 23:03:52:574  --google googleSDKEvent, count: 64045
2020/11/19 23:03:52:574  --google batchContents, count: 0
2020/11/19 23:03:52:574  --google eventContents, count: 63893
2020/11/19 23:03:52:574  --google libraryContents, count: 3

Then when users install the package, they will be stuck in the startup screen when they open the application (maybe because there are too many directory files in Google sdkevent, so it takes a lot of time to remove them?) When the user tries to open the app for many times, it will be normal, and the CPU and memory consumption are at normal levels. So it was confirmed that 100% of the oom was caused by firebase SDK
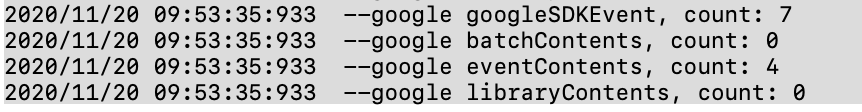
Then extract the user log again:
2020/11/20 09:53:35:933  --google googleSDKEvent, count: 7
2020/11/20 09:53:35:933  --google batchContents, count: 0
2020/11/20 09:53:35:933  --google eventContents, count: 4
2020/11/20 09:53:35:933  --google libraryContents, count: 0
So can you identify the problem from what I described above?
Is googleSDKEvent can not uploaded to Google servers in Chinese mainland? and led to an increase in the number of those events cache. and when the number is large, and the user open the app, the sdk keep try upload or something?
need help, thanks
KorolZhu
on 20 Nov 2020
@KorolZhu Thank you for your investigation, it is really helpful!
We are working on the optimization of the events cleanup logic for such a big amount of pending events.
GoogleDataTransport debug logs will be very helpful to understand how so many events were accumulated on the devices. You can enable debug logging by following these steps. @KorolZhu Would it be possible to share the logs?
Note:
It would be interesting to understand why so many events accumulated on the device. It may be either because of a huge amount of events logged or the events not being sent or both. Firebase Performance and Firebase Crashlytics use GoogleDataTransport SDK to send data to the backend. As Crashlytics usually logs only one event per app startup I would assume that the main source of the events is Performance traces. @KorolZhu Does the application log any custom performance traces? If so, reducing amount of them may mitigate the issue a bit.
maksymmalyhin
on 20 Nov 2020
@maksymmalyhin
Hi, My application does not use any custom performance traces, I just integrated performance SDK through pod, without any code call related to performance SDK。
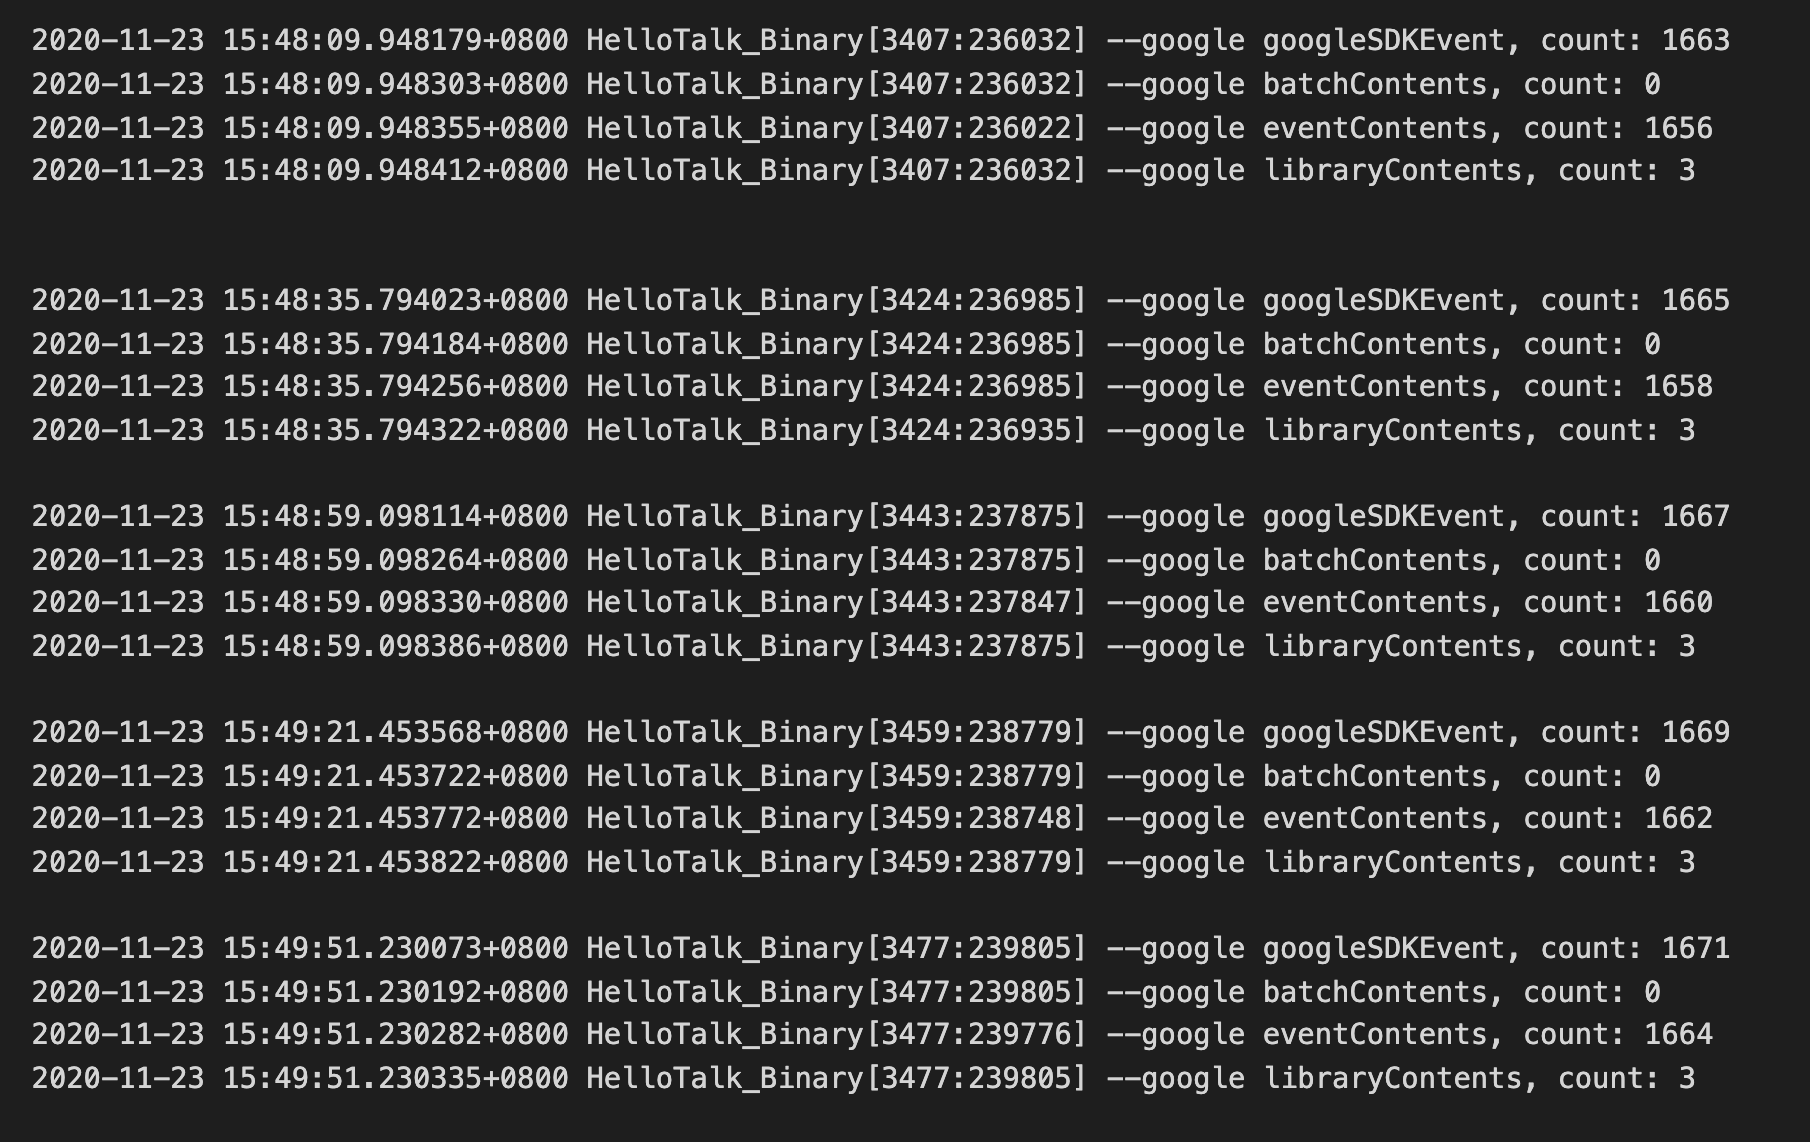
The GoogleDataTransport debug log (When I integrated performance SDK)
And I did some experiments as follows:
First I added some logs in this method didFinishLaunchingWithOptions:
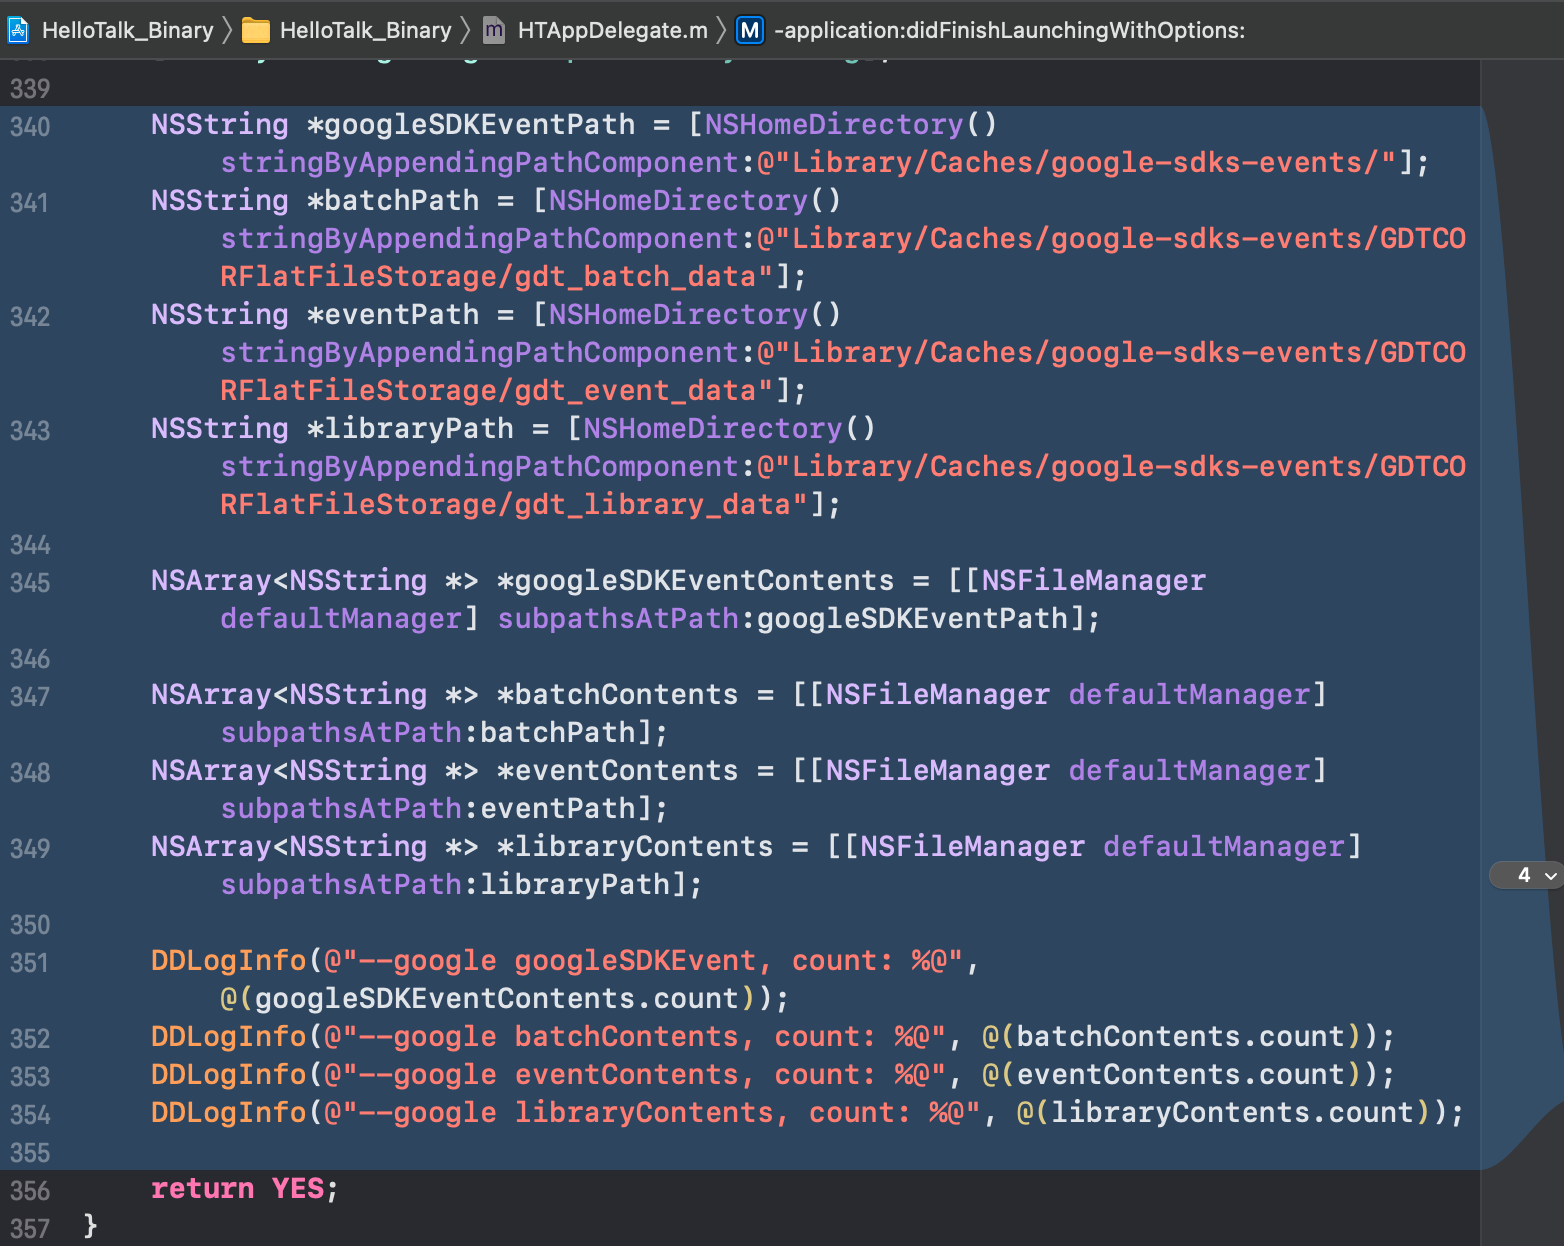
After I integrated performance SDK, Every time I start the app(just start app, not use app), dozens of new files will be generated, and the number of files never decreases
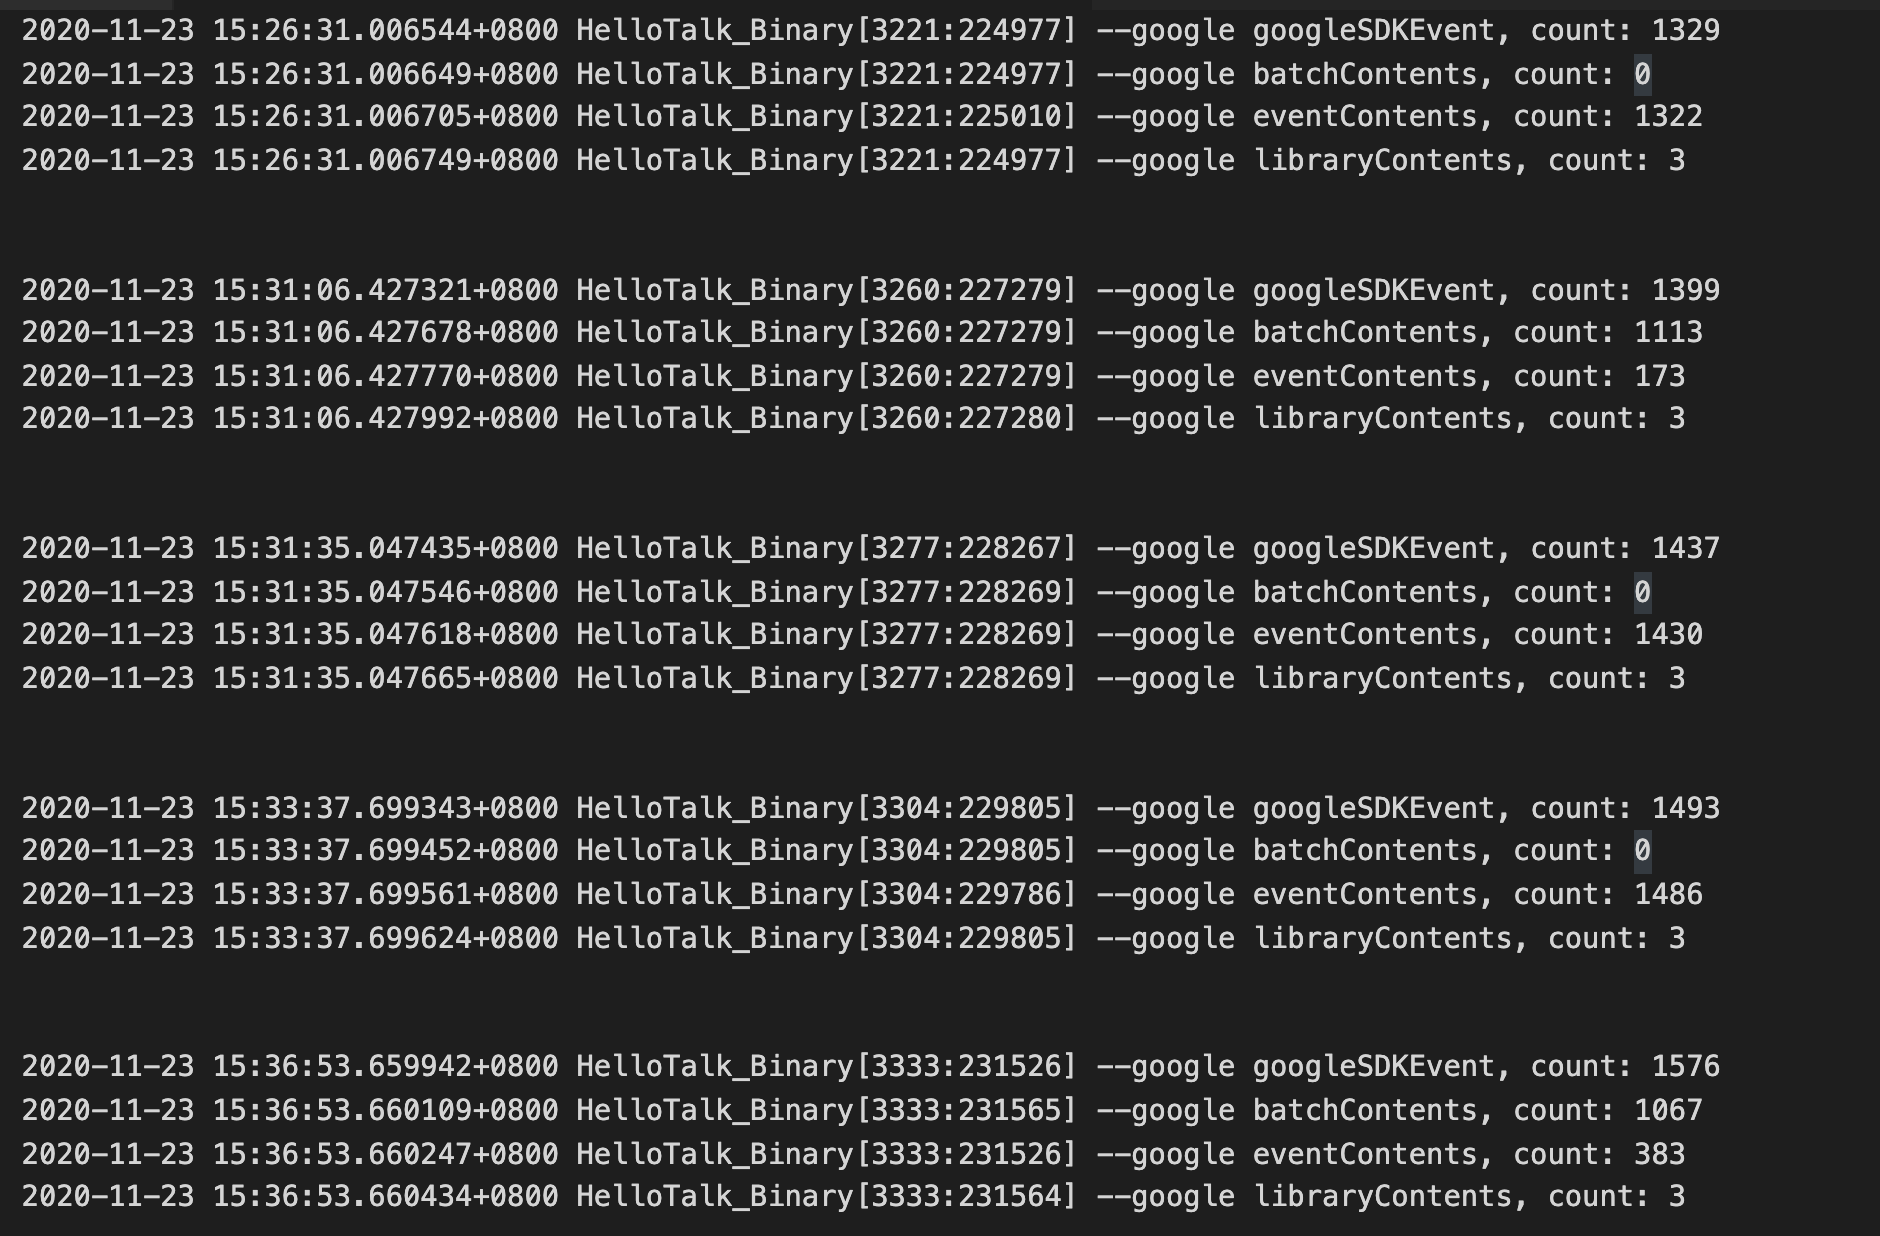
After I integrated performance SDK, Every time I start the app, and scroll some table view (lots of image will download), Hundreds of new files will be generated, and the number of files never decreases

After I removed performance SDK, Only 2 new files are generated each time app is started, No matter how you use the app
KorolZhu
on 23 Nov 2020
@KorolZhu Thank you for the provided logs. Entires like the following indicate that the device with the issue cannot reach the Firebase endpoint:
There was an error uploading events: Error Domain=NSURLErrorDomain Code=-1001 "请求超时。" UserInfo={_kCFStreamErrorCodeKey=-2102, NSUnderlyingError=0x283a2c030 {Error Domain=kCFErrorDomainCFNetwork Code=-1001 "(null)"
It may be because of some network restrictions, firewall settings, connectivity issues, etc. It means that the part of application that relies on GoogleDataTransport will not function on such devices (currently Firebase Performance and Crashlytics rely on GoogleDataTransport).
On our end we will optimize the code for such cases to prevent performance degrading in the case of a big amount pending events. But it won't fix the connectivity issue and the app missing features.
maksymmalyhin
on 23 Nov 2020
@KorolZhu I'm closing the issue so far. After the optimization done in #7014 the big amount pending events should not lead to the OOM crashes. The change scheduled for the next Firebase release, but you may test the version of GoogleDataTransport from master. Your feedback is appreciated.
Please note that #7014 fixes only the excessive memory usage and doesn't fix the server reachability issue that you experience.
Feel free to comment or reopen the issue with additional info if needed.
maksymmalyhin
on 24 Nov 2020
@maksymmalyhin This only fixes the excessive memory usage issue caused by a large number of pending events, but as long as I integrate firebase performance SDK, there will be more and more pending events, this large number of events will take up disk space and may consume CPU resources? Is there any way to continue to optimize, such as setting a maximum number of pending events, and replacing the oldest events when the number exceeds this number, or Is it possible to fix the server reachability, For example, provide a proxy setting to let my server upload these events.
KorolZhu
on 26 Nov 2020
@KorolZhu As the API to register a custom endpoint to send events to - it is an interesting idea. I'm not sure it solve the issue because, e.g. if the client has a network with a very restrictive firewall the proxy server endpoint may be blocked as well, so it doesn't looks like a universal solution. You may try to suggest the affected users to the global proxy or VPN settings on their devices to test if this approach works. You may create a separate ticket with a feature request describing the use case and the proposed solution, so we may keep a focused discussion there.
As for further optimization. Currently the amount of events is limited by the combined on-disk size to 20MB, so no new events will be added to the storage until older events are sent or removed due to expiration. We keep experimenting with other types of limit looking for a proper balance between the implementation complexity, supported use cases and performance. Potentially more updates are expected in the future.
Also we are working with Firebase Performance team to reduce storage utilization without compromising accuracy of the performance metrics (cc @visumickey b/168729571).
Your feedback is appreciated and will be taken into account in the future optimization work. Feel free to the Profiler traces or other measurements along with the use case description that may be helpful.
maksymmalyhin
on 26 Nov 2020
Related issues
 mlmcgrath
·
3Comments
mlmcgrath
·
3Comments
 subdan
·
3Comments
subdan
·
3Comments
 WillLewis
·
4Comments
WillLewis
·
4Comments
 terryworona
·
4Comments
terryworona
·
4Comments
 paulharter
·
3Comments
paulharter
·
3Comments
Most helpful comment
@maksymmalyhin @morganchen12
Hello, Let me first describe the issue I encountered
The user opens the app, and then opens the app's memory usage display and CPU usage display. you will see that the memory keeps growing, and the speed is very fast. In about one minute, it grows to 2098M (OOM limit), and then crash.
in the whole process the CPU usage always being in 60% - 90%
Then I integrated oom monitoring. When oom happens, I grab the stack information. The main stack information is as follows (not very perfect, I can only take a look at it)
According to the above stack information, it is preliminarily determined that it is the firebase SDK problem, and then I try to modify the source code of the SDK:

Continue to contract out to the user for verification, but the problem is not solved, the memory will continue to grow, but the growth is very slow, and the CPU utilization rate is still the same.
Then I went on to try to modify it as follows:
Continue to contract out to the user for verification, and the user's log is printed as follows:
Then when users install the package, they will be stuck in the startup screen when they open the application (maybe because there are too many directory files in Google sdkevent, so it takes a lot of time to remove them?) When the user tries to open the app for many times, it will be normal, and the CPU and memory consumption are at normal levels. So it was confirmed that 100% of the oom was caused by firebase SDK
Then extract the user log again:
So can you identify the problem from what I described above?
Is googleSDKEvent can not uploaded to Google servers in Chinese mainland? and led to an increase in the number of those events cache. and when the number is large, and the user open the app, the sdk keep try upload or something?
need help, thanks