Fec-cms: Mockup changes to raising and spending by the numbers time periods
What we're after: With the introduction of the new raising map, we are changing the way the By the numbers pages function. We're making it so that each table is individual and distinct and with therefore require its only time period filter - as opposed to the time period at the top of the page dictating all the data shown.
Completion criteria:
- [x] Mock up the new time period filter for both the raising and spending pages so they function the same way.
- [x] Introduce way to traverse between raising and spending: by the numbers pages
- [x] Design where totals will be on raising/spending breakdown feature
- [x] Confirm methodology language is accurate
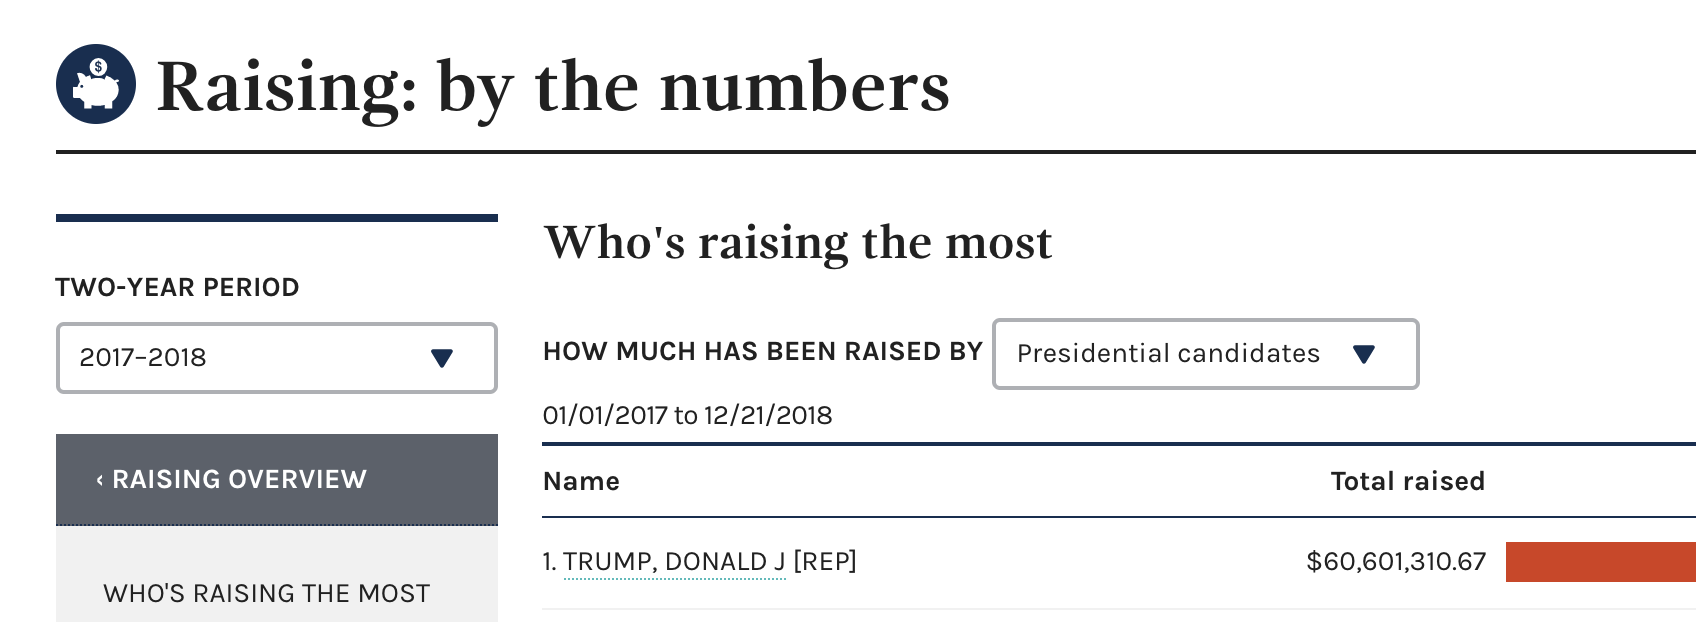
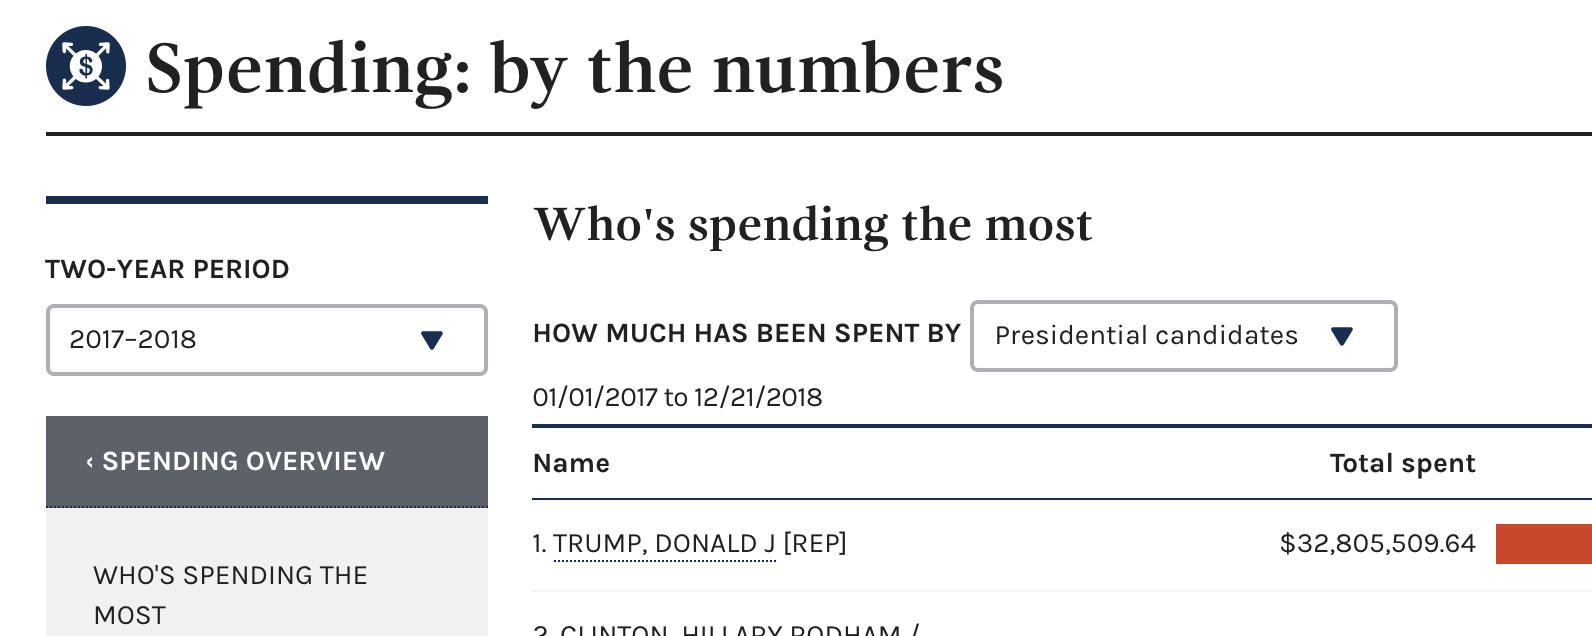
Currently on .gov:
Raising
Spending
 JonellaCulmer
All 25 comments
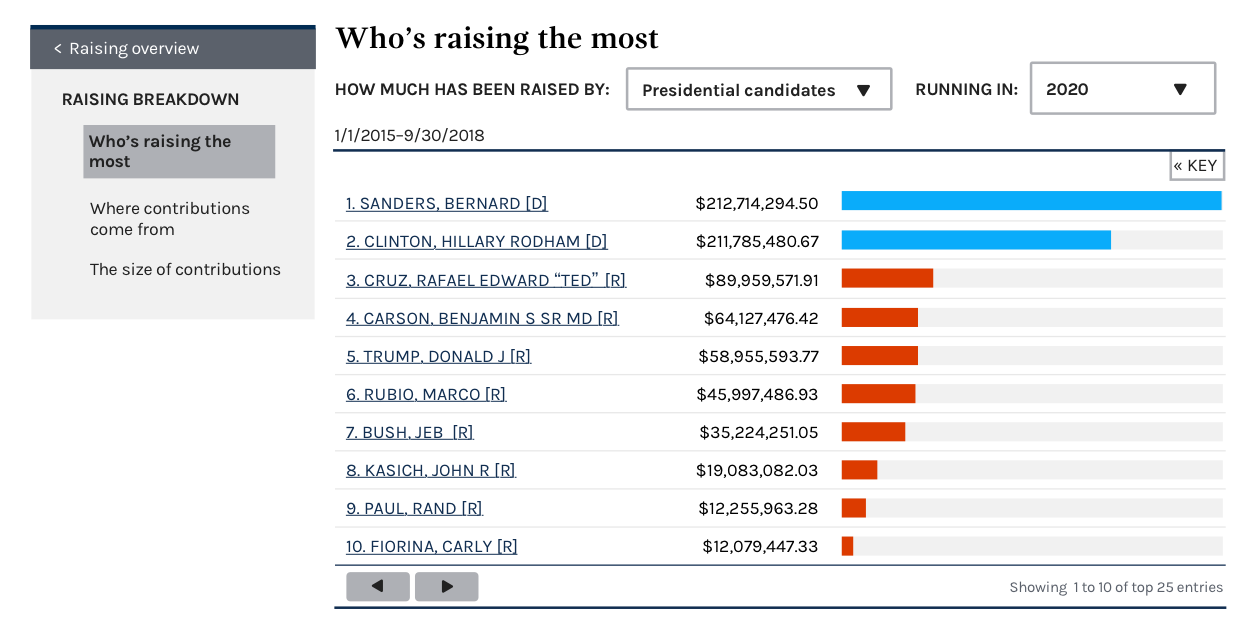
First pass at updating the Who's raising the most chart to change the time filter:
JonellaCulmer
on 21 Dec 2018
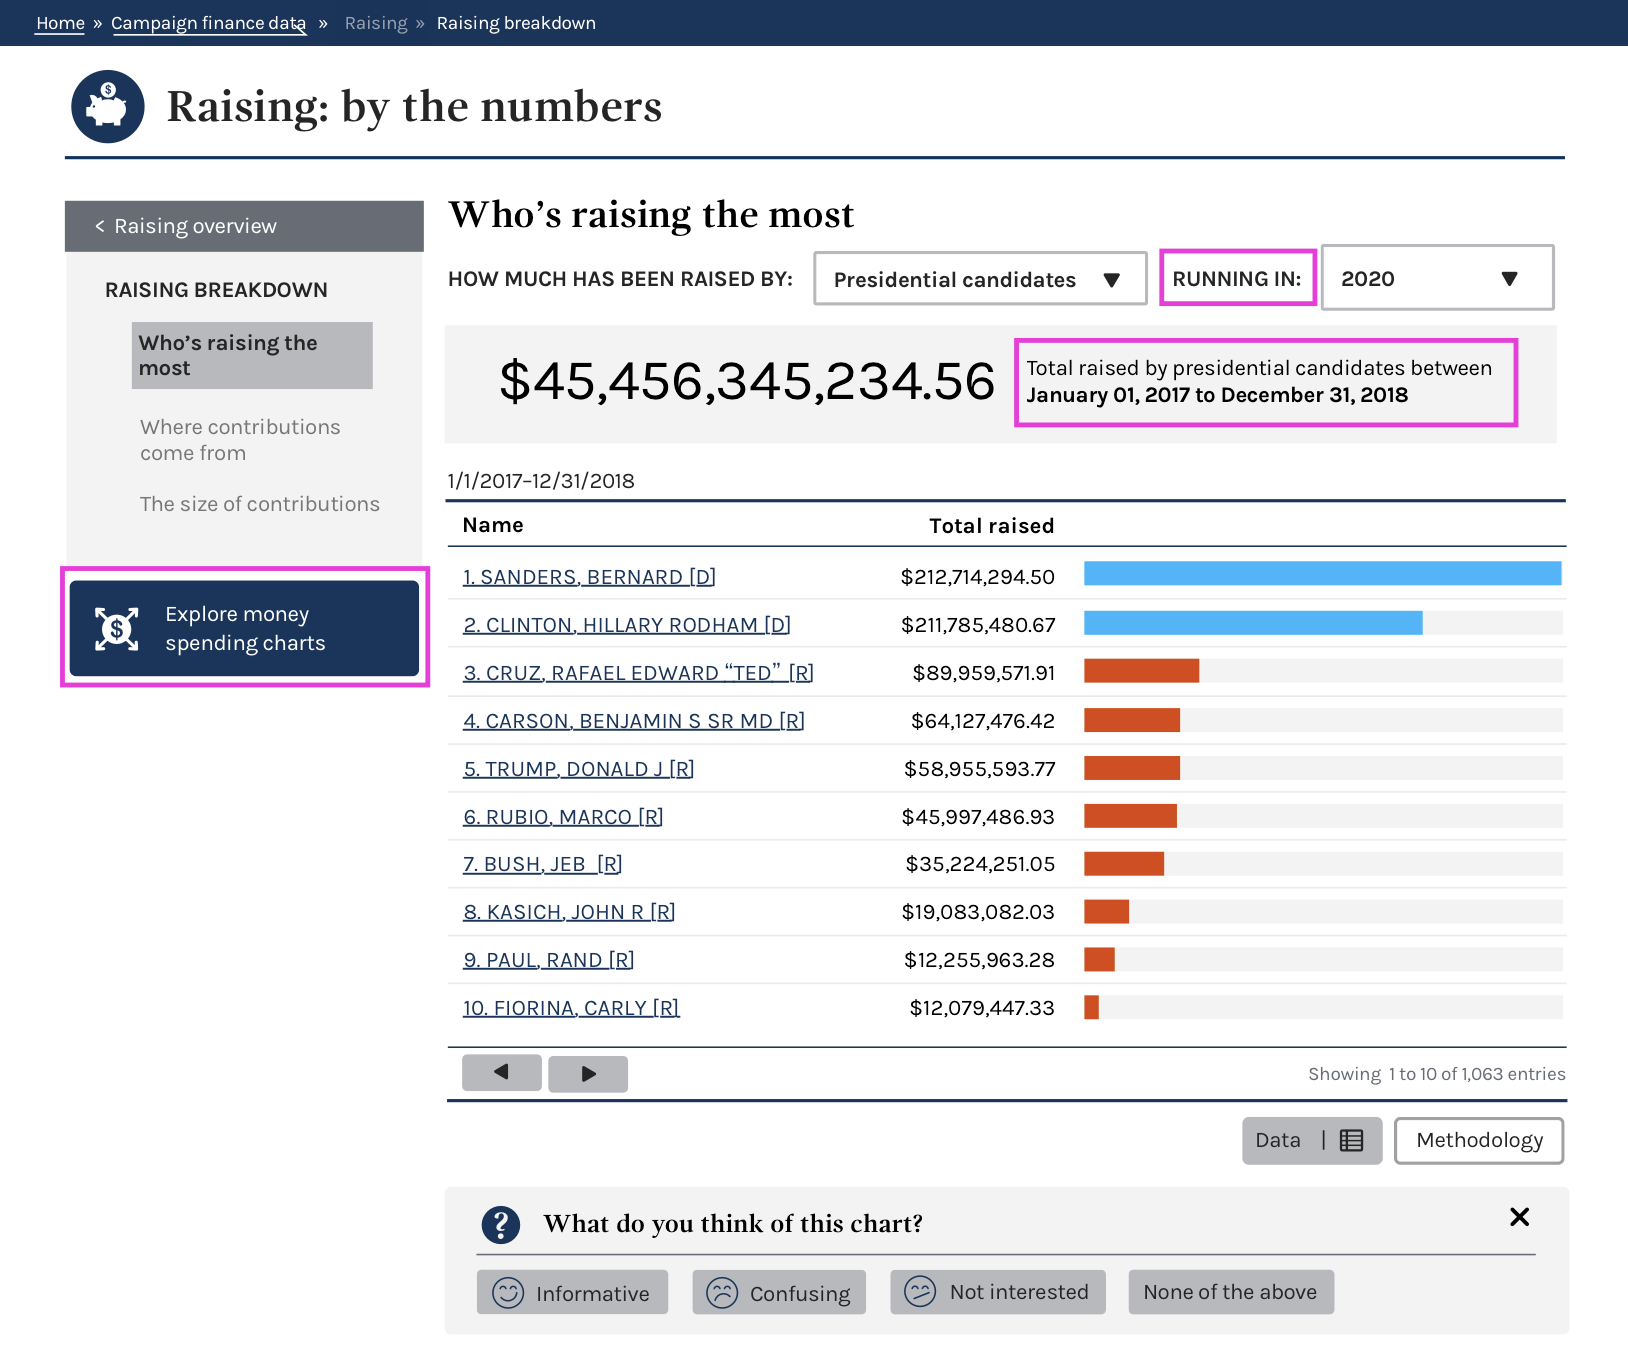
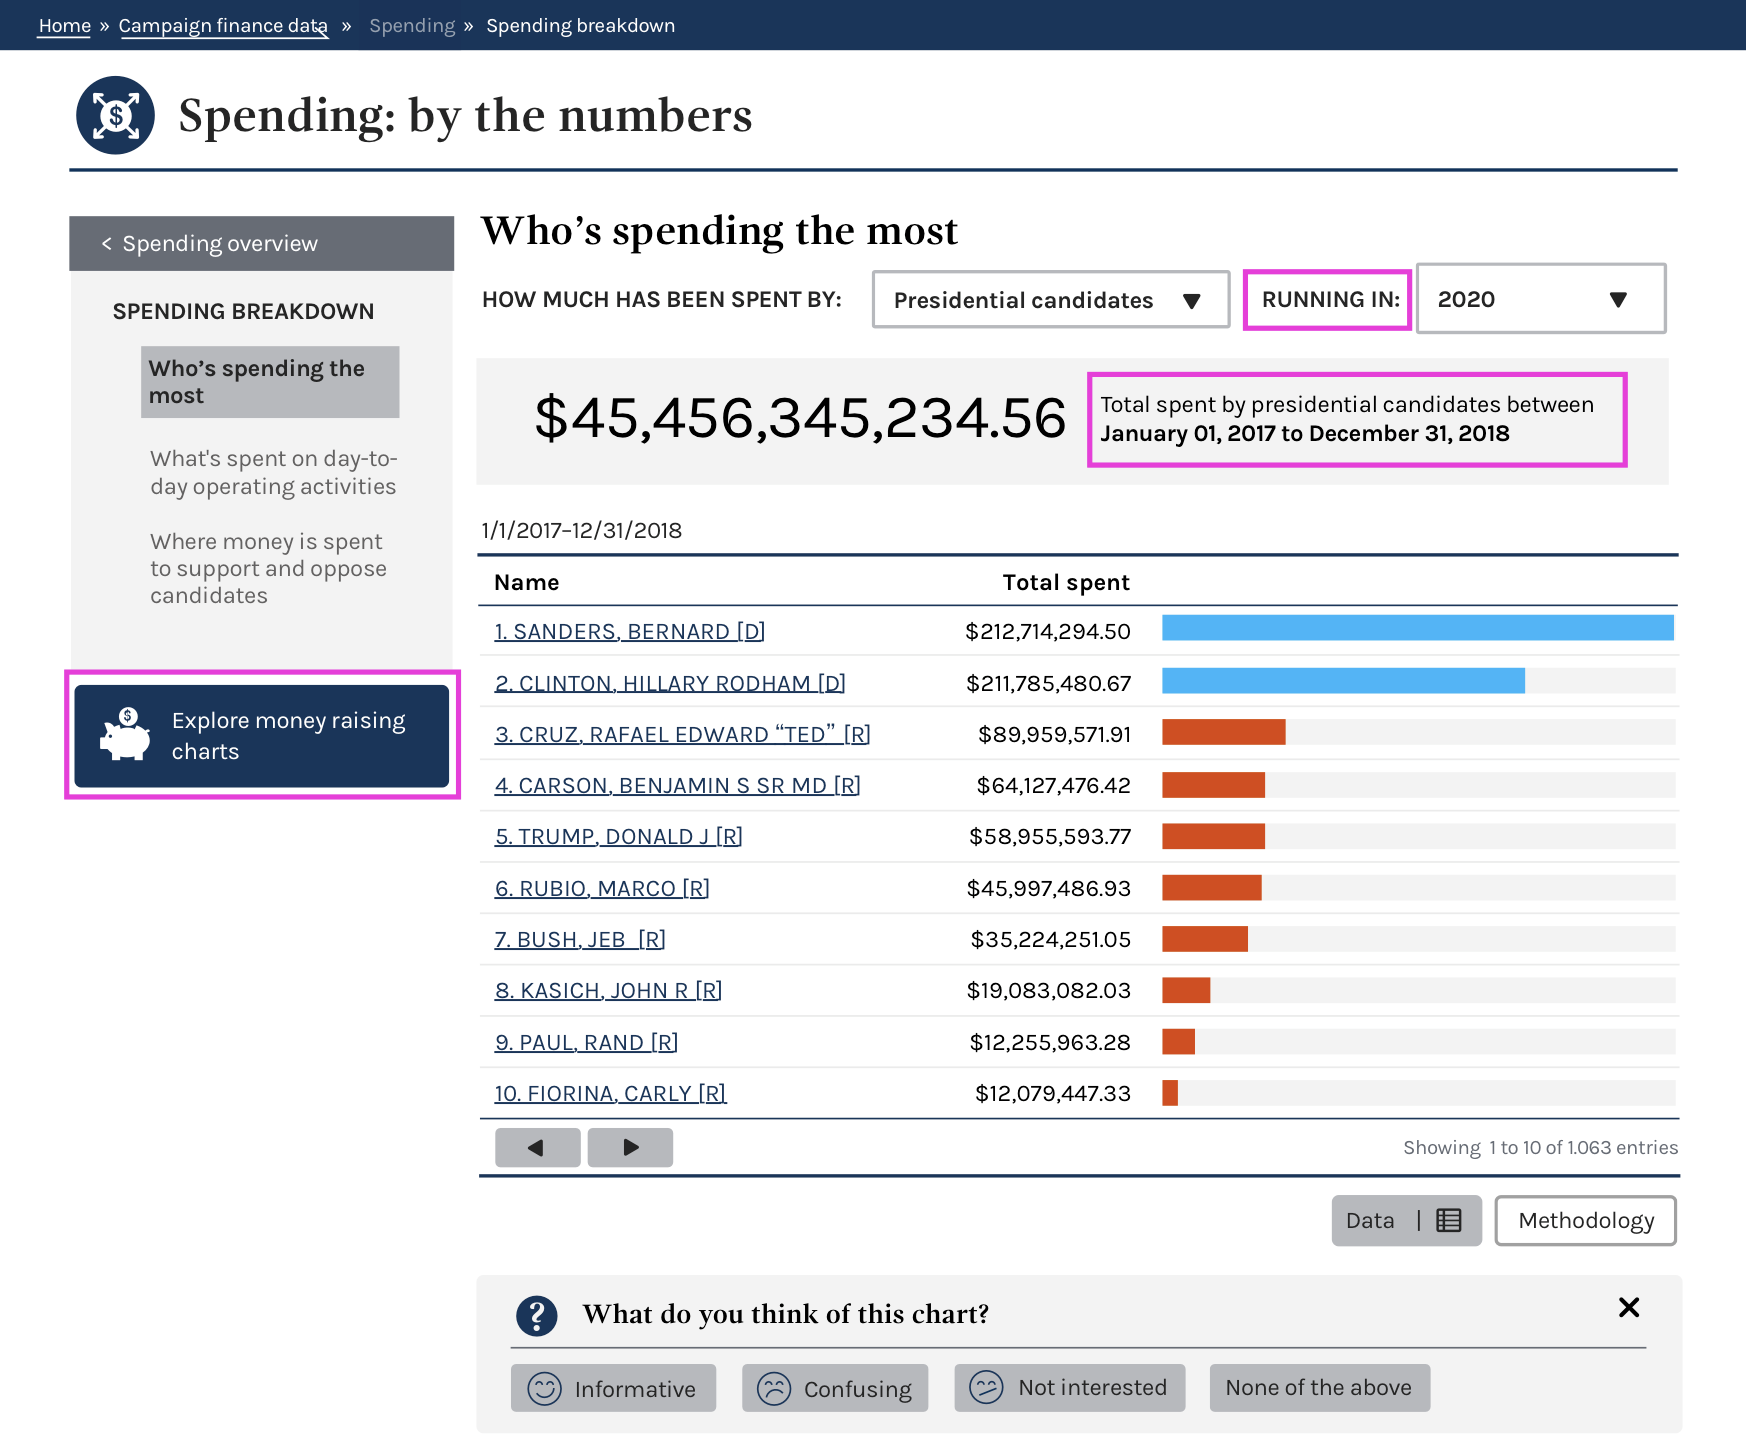
Below are updated versions of the bar charts on each of the 'by the numbers' pages: raising and spending. These updates include an aggragate total for all money raised by a committee type, add a button to move between the raising and spending by the numbers pages, and change the time filter from a two-year period to election.
The content team needs to review the language used in three places: the new button below the left-hand navigation, the description text for the total data figure, and the text to introduce the elections dropdown "Running in". For the "running in" language, it makes sense when we're talking about candidates, but doesn't make sense in the case of PACs or Parties, which are data sets that are also available on this bar chart. The "running in" language needs to accommodate all of them. cc: @AmyKort @dorothyyeager @kathycarothers @bmathesonFEC
Raising design
Spending design
Happy to have a chat with content team if there are any questions.
JonellaCulmer
on 12 Feb 2019
I like these a lot, @JonellaCulmer . The totals bar is very effective at pulling out the big number and also making it clear where we got that figure. I might tweak the language to say: The total raised by all presidential candidates between January 01, 2017 and December 31, 2018.
For the "running in" box--I think that language is great. I'd like to revisit the idea of not including PAC and Party spending/raising on these particular charts. I think it is confusing to put candidate and other spending on the same chart. Also, now that we are adding totals, I think we risk confusing users by providing different totals here than what we show for PACs and parties on the "cost of the election" chart that accounts for transfers, etc.. cc @PaulClark2 and @jwchumley
 AmyKort
on 12 Feb 2019
AmyKort
on 12 Feb 2019
@AmyKort @JonellaCulmer we mix committee types in our "cost of election" chart. We do need to think about how to make it clear that the totals on the "by the numbers" chart will be different than the numbers on the "cost of election" chart. Of course, we can add information about the "by the numbers" methodology to the methodology pop-up.
I'd be interested in others opinions about mixing committee types. Is there anything in the navigation path to the "by the numbers" charts that would lead a user to expect they are only going to see candidate data? If we restrict the chart above to candidate data, where are we going to visualize PAC and party data?

 PaulClark2
on 12 Feb 2019
PaulClark2
on 12 Feb 2019
Amy's right ......
PaulClark2
on 12 Feb 2019
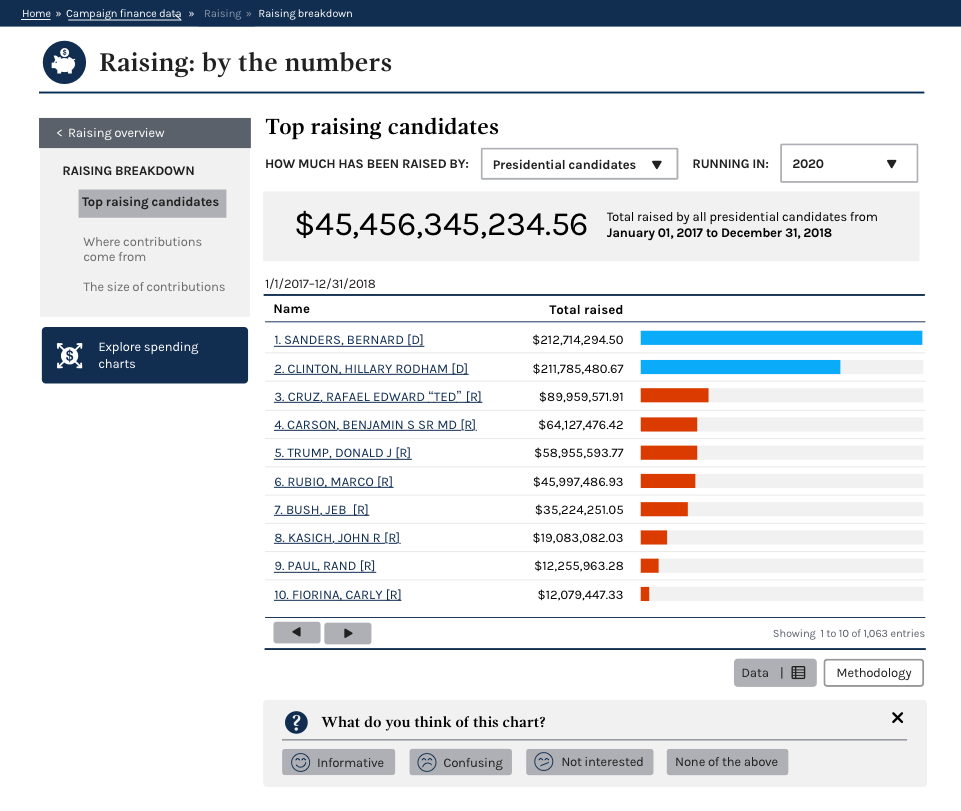
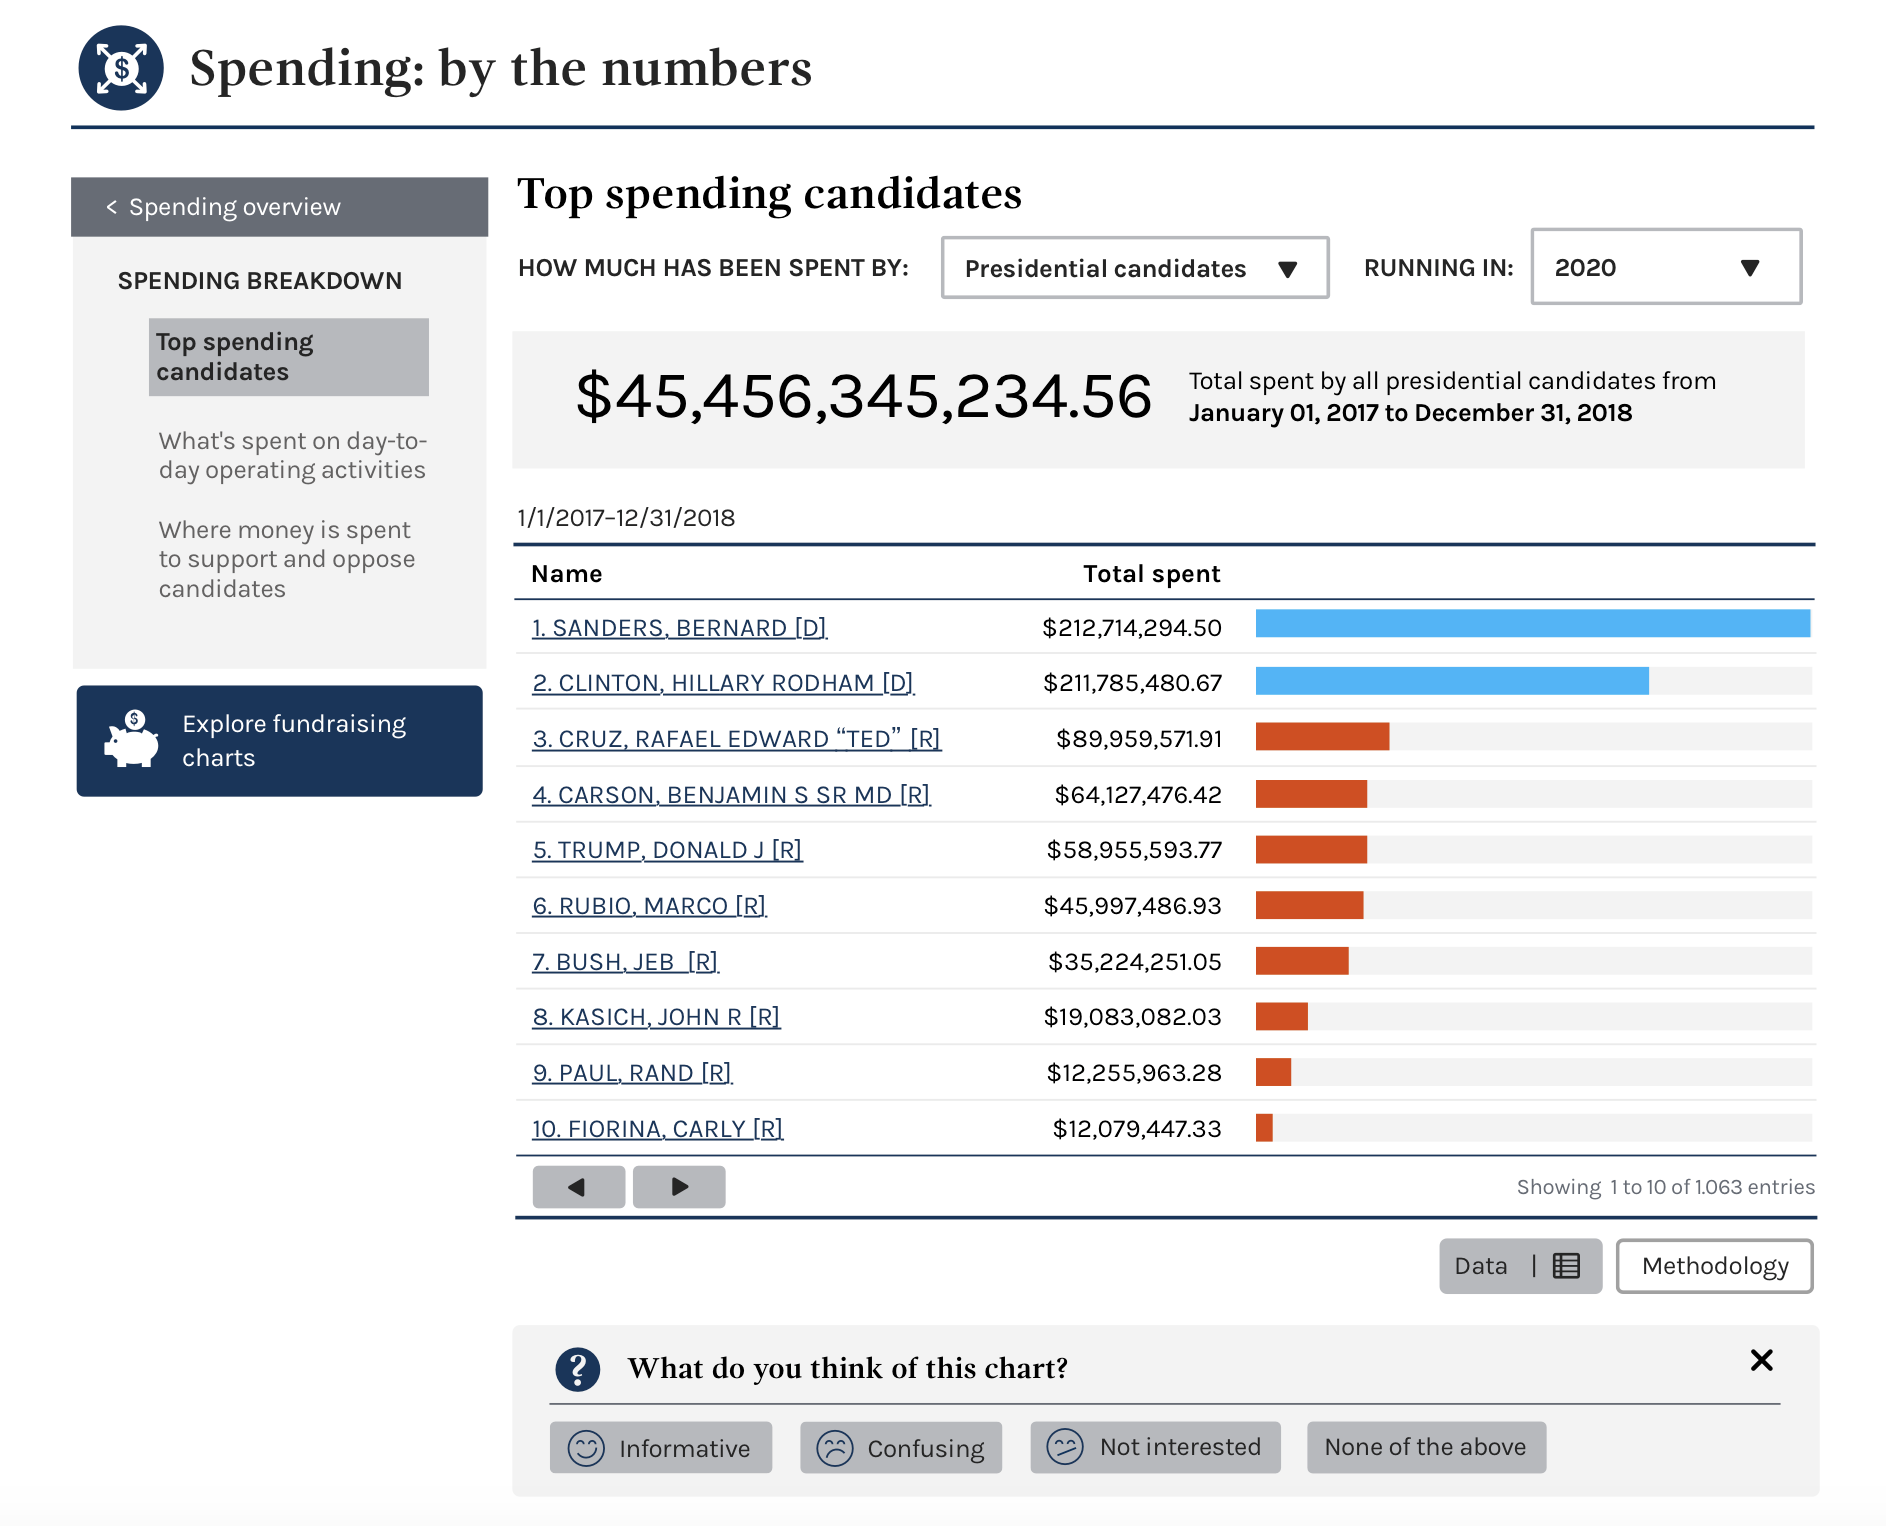
Final mockups for the raising and spending by the number bar charts are below.
While updates have been made to the charts based on the completion criteria (changing two-year period, adding aggregate total, and a button to switch between raising and spending pages), modifications have also been made to remove PACs and Parties now that we are moving to cycle-specific time periods, depending on the seat.
Because the previous testing has not been on the time periods, we don't have enough information to show that users will or won't be confused. We hope to conduct additional testing to ensure that users are not confused by the removal and will explore new ways to present this data. This also gives us an opportunity to enhance the data for PACs specifically, since including ActBlue numbers tends to skew the results. (ActBlue will always be the top raising PAC).
Raising design
Spending design
JonellaCulmer
on 12 Feb 2019
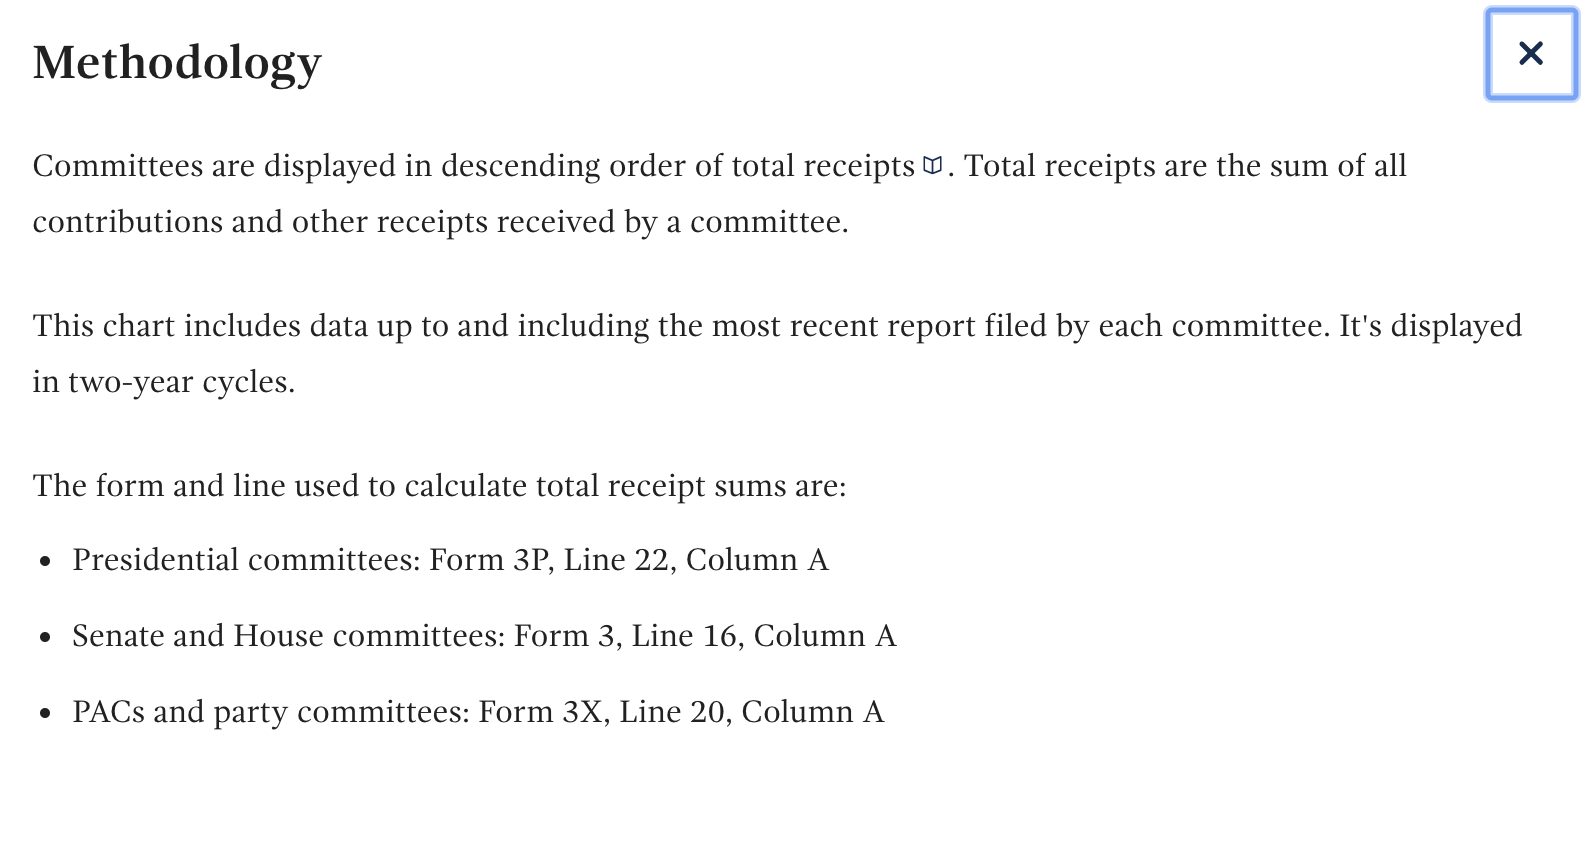
@PaulClark2 Do you have the bandwidth to review the methodology? I know we now need to drop the last line at least.
JonellaCulmer
on 13 Feb 2019
@JonellaCulmer here's my first pass. We'll need to ask @dorothyyeager @AmyKort and @bmathesonFEC to make to better. Note for content reviewers: we are including financial data from a candidate's PCC and other authorized committees, committee designations "P" and "A." We do _not_ include JFs.
This chart includes data up to and including the most recent report filed by each campaign. It displays an overall total for the selected office and it displays totals for individual candidate campaigns.
The overall total is the sum of the total receipts of the campaign committees of the selected office.
Candidates are displayed in descending order of total receipts. Total receipts are the sum of all contributions and other receipts received by the candidate’s authorized committees: two-year cycles for House candidates, four-year cycles for presidential candidates and six-year cycles for Senate candidates.
The form and line used to calculate candidate campaign total receipt sums are:
- Presidential campaigns: Form 3P, Line 22, Column A
- Senate and House campaigns: Form 3, Line 16, Column A
PaulClark2
on 15 Feb 2019
This looks good to me. I have a small suggested edit below, but I would defer to @PaulClark2 and @bmathesonFEC about the best way to communicate this information.
"This chart includes data up to and including the most recent report filed by each campaign. It displays an overall total for the selected office and also displays totals for individual candidate's campaigns."
AmyKort
on 15 Feb 2019
@AmyKort I like your edit.
PaulClark2
on 15 Feb 2019
I do too.
For this line: "The overall total is the sum of the total receipts of the campaign committees of the selected office." - should it be "candidate" instead of "office"? (Unless we mean the big billion dollar overall total, in which case, I'm still finding "office " a little confusing. Maybe "race"?
 dorothyyeager
on 15 Feb 2019
dorothyyeager
on 15 Feb 2019
@dorothyyeager Office or seat. Race would work for Presidential elections, but not for House and Senate when there are multiple races.
JonellaCulmer
on 15 Feb 2019
@dorothyyeager @JonellaCulmer I don't have a preference. My reason for using the word "office" was simply because the drop-down options are "Presidential candidates," "House candidates" and "Senate candidates." I will defer to the content folks about word choice there.
PaulClark2
on 15 Feb 2019
How about "The overall total is the sum of the total receipts of the campaign committees of all candidates for the selected office."
dorothyyeager
on 15 Feb 2019
@dorothyyeager I like it. It's clearer than my version.
PaulClark2
on 15 Feb 2019
Should we include something here about processed vs. raw data? Am I right that these figures won't be updated until the filing is processed?
 bmathesonFEC
on 15 Feb 2019
bmathesonFEC
on 15 Feb 2019
I'm not sure. The sums are generated from Pass 1 data. So the delay is typically 24 hours or less. What do other folks think?
PaulClark2
on 15 Feb 2019
My suggesting is based on the assumption that press/info gets calls when candidates don't think their numbers are up-to-date. If that's not a problem then we don't need to add anything.
bmathesonFEC
on 15 Feb 2019
@bmathesonFEC I checked with Christian about adding a note about processed data. He doesn't think it's necessary because the sums are calculated from summary level data (pass 1) that is updated nightly.
This version incorporates edits by @AmyKort and @dorothyyeager.
This chart includes data up to and including the most recent report filed by each campaign. It displays an overall total for the selected office and also displays totals for individual candidate's campaigns.
The overall total is the sum of the total receipts of the campaign committees of all candidates for the selected office.
Candidates are displayed in descending order of total receipts. Total receipts are the sum of all contributions and other receipts received by the candidate’s authorized committees: two-year cycles for House candidates, four-year cycles for presidential candidates and six-year cycles for Senate candidates.
The form and line used to calculate candidate campaign total receipt sums are:
- Presidential campaigns: Form 3P, Line 22, Column A
- Senate and House campaigns: Form 3, Line 16, Column A
PaulClark2
on 15 Feb 2019
@PaulClark2 Great! So we've got the raising methodology down. Assuming there are only a few places that need to be changed for the spending chart. I bolded some areas.
This chart includes data up to and including the most recent report filed by each campaign. It displays an overall total for the selected office and also displays totals for individual candidate's campaigns.
The overall total is the sum of the total receipts of the campaign committees of all candidates for the selected office.
Candidates are displayed in descending order of total receipts. Total receipts are the sum of all contributions and other receipts received by the candidate’s authorized committees: two-year cycles for House candidates, four-year cycles for presidential candidates and six-year cycles for Senate candidates.
The form and line used to calculate candidate campaign total receipt sums are:
- Presidential campaigns: Form 3P, Line 22, Column A
- Senate and House campaigns: Form 3, Line 16, Column A
JonellaCulmer
on 15 Feb 2019
@JonellaCulmer here's my first pass. We'll need to ask @dorothyyeager @AmyKort and @bmathesonFEC to make to better.
For the spending bar chart:
This chart includes data up to and including the most recent report filed by each campaign. It displays an overall total for the selected office and also displays totals for individual candidate's campaigns.
The overall total is the sum of the total disbursements of the campaign committees of all candidates for the selected office.
Candidates are displayed in descending order of total disbursements, Total disbursements are the sum of all expenditures and other disbursements made by the candidate’s authorized committees: two-year cycles for House candidates, four-year cycles for presidential candidates and six-year cycles for Senate candidates.
The form and line used to calculate candidate campaign total disbursement sums are:
- Presidential campaigns: Form 3P, Line 30, Column A
- Senate and House campaigns: Form 3, Line 22, Column A
PaulClark2
on 15 Feb 2019
I don't have any edits to that -seems clear to me!
dorothyyeager
on 15 Feb 2019
I agree with @dorothyyeager
AmyKort
on 15 Feb 2019
Yep, looks good.
bmathesonFEC
on 15 Feb 2019
This issue is complete. Closing in favor of implementation issue: https://github.com/fecgov/fec-cms/issues/2678
JonellaCulmer
on 15 Feb 2019
Related issues
AmyKort
·
6Comments
 jenniferthibault
·
6Comments
jenniferthibault
·
6Comments
 lbeaufort
·
5Comments
JonellaCulmer
·
5Comments
AmyKort
·
5Comments
lbeaufort
·
5Comments
JonellaCulmer
·
5Comments
AmyKort
·
5Comments
Most helpful comment
How about "The overall total is the sum of the total receipts of the campaign committees of all candidates for the selected office."