Fastapi: Connection Error 104 when swarming the server
So i have a project that was made back in the days using Flask, and I wanted to test it with FastAPI.
I made the changes, and it worked normally, the problem occured when I made a swarm test using Locust.
With Flask, I got 0 failures in 10.000 requests, with 1.000 users at the same time.
With FastAPI, I got 387 failures in 10.000 requests, with 1.000 users at the same time.
The error is:
ConnectionError(ProtocolError('Connection aborted.', ConnectionResetError(104, 'Connection reset by peer')),)
I started my app with the following command:
gunicorn -w 3 -k uvicorn.workers.UvicornH11Worker -b 0.0.0.0:5005 main:app --timeout 200
Anyone knows why I got this connection error with FastAPI and not with Flask?
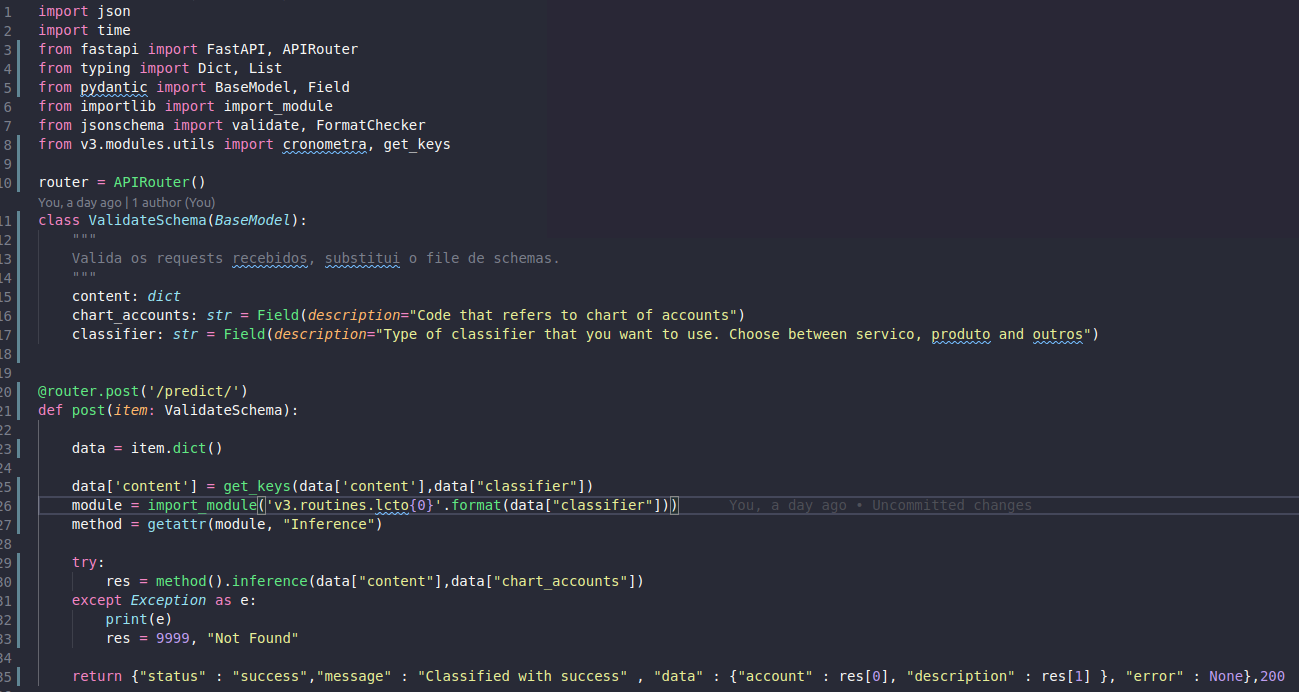
This is my main.py FastAPI file:

This is the service that was tested:
This is the results that I got with FastAPI:

This is the results that I got with Flask:

 rodrigo-roth
All 18 comments
1) You're running the H11 worker so i assume you're running pypy?
2) Good rule when defining number of workers is workers = 2 * number_of_cores + 1
3) Why run with 1000 users? The important metric is requests/second which is extremely low compared to what i'm running, i have about 70 requests per second with 100 users
 ArcLightSlavik
on 19 Aug 2020
ArcLightSlavik
on 19 Aug 2020
Hi @ArcLightSlavik i think there is a missunderstanding, he's running under pure Python with H11Worker. UvicornWorker uses httptools and uvloop to run under PyPy that's why UvicornWorker class is much faster.
 ycd
on 19 Aug 2020
ycd
on 19 Aug 2020
@ycd Yeah. Was just clarifying if he was actually running under PyPy, since i don't think there's any reason to run H11Worker under CPython?
ArcLightSlavik
on 19 Aug 2020
@rodrigo-roth for a additional test I'd consider making another version of your endpoint that doesn't use a pydantic schema for input validation/parsing, just to see if the pydantic-related pieces of fastapi are causing potential slowdowns, as I've heard people say that in the past. You could try reading directly from the body. It could be worth just seeing the difference.
Personally, my very high volume endpoints are built directly on top of starlette, whereas internal/general endpoints are done with fastapi/pydantic.
 shawnwall
on 19 Aug 2020
shawnwall
on 19 Aug 2020
- You're running the H11 worker so i assume you're running pypy?
- Good rule when defining number of workers is
workers = 2 * number_of_cores + 1- Why run with 1000 users? The important metric is requests/second which is extremely low compared to what i'm running, i have about 70 requests per second with 100 users
Interesting, I will make another test with tis metrics to see the results.
rodrigo-roth
on 19 Aug 2020
@rodrigo-roth for a additional test I'd consider making another version of your endpoint that doesn't use a pydantic schema for input validation/parsing, just to see if the pydantic-related pieces of fastapi are causing potential slowdowns, as I've heard people say that in the past. You could try reading directly from the body. It could be worth just seeing the difference.
Personally, my very high volume endpoints are built directly on top of starlette, whereas internal/general endpoints are done with fastapi/pydantic.
Thanks! I'll test with your sugestion and post here the results.
rodrigo-roth
on 19 Aug 2020
- You're running the H11 worker so i assume you're running pypy?
- Good rule when defining number of workers is
workers = 2 * number_of_cores + 1- Why run with 1000 users? The important metric is requests/second which is extremely low compared to what i'm running, i have about 70 requests per second with 100 users
How do you set the number os requests per second? I'm facing a little bit of trouble to find that (I'm relative new at this, sorry).
rodrigo-roth
on 19 Aug 2020
@rodrigo-roth I believe he was stating that _observing_ the requests per second in the result is a valuable result metric to view.
shawnwall
on 19 Aug 2020
@rodrigo-roth I believe he was stating that _observing_ the requests per second in the result is a valuable result metric to view.
I see, my RPS always stay between 10 and 20, I wondered how he run with 70 RPS with fewer users.
rodrigo-roth
on 19 Aug 2020
@rodrigo-roth the lower the number of users, the faster the server response time is normally, so you end up with higher result request per second. It's all shifting numbers around. I personally can push a starlette service running locally on docker to 7000 requests per second or more, hitting it with 1000 a time similar to you (but using ab).
shawnwall
on 19 Aug 2020
It might be because my average response time is lower? Your average response time is 46000 ms while mine are usually between 150 and 1500. Also check your hatch rate because for 1000 users it takes 16 minutes to create all of them (i think the default is one second but don't quote me on this)
ArcLightSlavik
on 19 Aug 2020
I used uvicorn.workers.UvicornWorker with async def function, and got around 10% connection error, with uvicorn.workers.UvicornWorker with sync function got 3% connection error. Maybe is because I'm running it locally? Both of them I tested with 100 users, spawning 1 per second.
rodrigo-roth
on 19 Aug 2020
How many workers do you have?
What's the status code of error?
ArcLightSlavik
on 19 Aug 2020
I have 3 workers, the error that i got is:
ConnectionError(ProtocolError('Connection aborted.', ConnectionResetError(104, 'Connection reset by peer')),)

rodrigo-roth
on 19 Aug 2020
Number of workers is low unless you have a single core CPU.
The 104 error is weird though it seems to be a urllib issue. Try recreate the virtualenv and reinstall the packages, if that doesn't work try start locust in headless mode.
ArcLightSlavik
on 19 Aug 2020
Number of workers is low unless you have a single core CPU.
The 104 error is weird though it seems to be a urllib issue. Try recreate the virtualenv and reinstall the packages, if that doesn't work try start locust in headless mode.
Will try with more Workers, and in a new virtualenv to see if it get the same results. Thanks!
rodrigo-roth
on 19 Aug 2020
I figured it out, just had to increase the wait time on the locust file so it don't overload the requests.
wait_time = between(0.5, 3.0) to wait_time = between(0.5, 50.0)
My notebook can't handle a large number of requests/s, so thats why the connectionerror occured.
Thanks to everyone that tried to help me
rodrigo-roth
on 25 Aug 2020
Thanks for the help here everyone! :clap: :bow:
If that solves the original problem, then you can close this issue @rodrigo-roth :heavy_check_mark:
 tiangolo
on 16 Dec 2020
tiangolo
on 16 Dec 2020
Related issues
 RenanAlonkin
·
3Comments
RenanAlonkin
·
3Comments
 cjw296
·
3Comments
cjw296
·
3Comments
 KoduIsGreat
·
3Comments
KoduIsGreat
·
3Comments
 RogerioDosSantos
·
3Comments
RogerioDosSantos
·
3Comments
 iwoloschin
·
3Comments
iwoloschin
·
3Comments