Fastapi: [FEATURE] Provide timing data for things FastAPI does outside of user code
Is your feature request related to a problem? Please describe.
I currently find myself using FastAPI as an API frontend for a database running queries of varying levels of complexity that usually return fairly large quantities of data. The problem I have is that, when attempting to figure out why an API request is taking time to respond, there's a lot going on outside of what fencing the code inside your route with the usual time_start = time.time(), time_delta = time.time() - time_start won't tell you.
In your average FastAPI application, there's 4 main causes for slowdowns:
- Endpoint code running (app)
- Waiting for the database (io)
- Data validation (pydantic)
- Data serialization (json/ujson)
Of those 4, only the first two are actually part of the user code, the other two are handled behind the scenes by FastAPI. If I'm testing a route that's returning 50MBs of JSON (for whatever reason), it's actually rather tricky to determine whether switching from json to ujson or orjson will have any performance benefit or if the slowdown is coming from Pydantic choking on the sheer amount of data being fed to it or the database being slow.
Describe the solution you'd like
Given FastAPI is performing operations outside of what the user can observe or measure, it should probably expose timing data for those things in some way (especially validation and serialization, since I doubt routing is going to factor a lot in the processing time). I don't know how the implementation should go, though, given any middleware is only going to receive a Starlette Response object and FastAPI probably shouldn't be doing this sort of thing automatically anymore than it does with CORS. The Response object could probably be extended in some way to contain some sort of timing dict, though that's sure to cause all sorts of compatibility issues, so I don't know whether that can be done without some upstream work with Starlette.
Describe alternatives you've considered
I was initially trying to write a middleware for this, but python's own cProfile is limited to text file export, so processing the data in Python becomes an extra hurdle, if the format is even stable enough for that. Without using a profiler, ASGI middlewares simply don't have access to timing information for the app besides the total time spent awaiting the callable.
Additional context
The recently introduced Server-Timing HTTP header seems like a perfect way to push coarse profiling information to make debugging those cases somewhat easier, especially given how it's supported in the Chrome devtools and that Firefox support for it is just around the corner. That's probably beyond the scope of that issue, though.
 sm-Fifteen
All 54 comments
A couple tangential profiling-related notes that may be of interest to anyone working with "50MBs of JSON"-sized payloads:
Click to expand
- Serialization may also involve two (potentially very costly!) steps: 1) if specifying a
response_model, where the returned data is parsed into theresponse_model, and 2) in all cases unless you return aResponsedirectly, wherefastapi.encoders.jsonable_encoderis used to convert your output to json.
- For payloads with long lists or dicts with many keys this function call is not cheap, and unless you return a
Responseor one of its subclasses from your endpoint, in most cases, the cost ofjsonable_encoderwill probably dwarf the call tojson.dumpsor faster alternatives from other packages.
- For payloads with long lists or dicts with many keys this function call is not cheap, and unless you return a
- For faster creation of pydantic model instances, consider using
BaseModel.constructif you know the input data doesn't require parsing (e.g., whenever you perform the instantiation yourself in a type-safe way, rather than relying on fastapi's parsing machinery).
- I profiled this method at ~30-40x faster than calls to
BaseModel.__init__, even for relatively small payloads. - The API is a little awkward in pydantic v0.32.2 since you have to pass the values as a dict (and have to specify the fields set), but starting in v1 it has the same API as the
__init__calls and is even type-checked by the pydantic mypy plugin (a good reason for FastAPI to update to pydantic v1 as soon as possible!).
- I profiled this method at ~30-40x faster than calls to
Addressing the main point brought up in this issue, I think it might be worth looking into yappi -- if you look at the docs for the get_func_stats function and the YFuncStat class, it looks like it should be relatively easy to package up the profiling results inside an ASGI middleware. (Also, for what it's worth, it has built-in support in PyCharm.)
I'm not very familiar with the Server-Timing header, but based on a quick skim of the linked docs, it seems that such a yappi ASGI middleware could return Server-Timing headers for each of its YFuncStat instances, presumably with some (configurable) filtering and formatting. (Obviously it could also just log the results to the console.)
 dmontagu
on 11 Nov 2019
dmontagu
on 11 Nov 2019
A couple tangential profiling-related notes that may be of interest to anyone working with "50MBs of JSON"-sized payloads:
Ah, that's interesting, I'd usually just build my own RawJSONResponse class and handle json conversion on my own so I could bypass Pydantic entirely, but this is certainly much cleaner if you trust your input source.
Addressing the main point brought up in this issue, I think it might be worth looking into yappi -- if you look at the docs for the get_func_stats function and the YFuncStat class, it looks like it should be relatively easy to package up the profiling results inside an ASGI middleware. (Also, for what it's worth, it has built-in support in PyCharm.)
I'm not very familiar with the
Server-Timingheader, but based on a quick skim of the linked docs, it seems that such a yappi ASGI middleware could return Server-Timing headers for each of its YFuncStat instances, presumably with some (configurable) filtering and formatting. (Obviously it could also just log the results to the console.)
Thanks for pointing out yappi. I've tried the middleware solution with it, and while it's working well enough, it runs into the issue where, since profiling is global, if a route is called while another one is running, the profiler gets confused and the resulting profiling data will be incorrect or missing.
from starlette.middleware.base import BaseHTTPMiddleware
from starlette.responses import Response
from starlette.requests import Request

import fastapi
import json
import sqlalchemy

import yappi

class BenchMiddleware(BaseHTTPMiddleware):
    async def dispatch(self, request: Request, call_next) -> Response:
        yappi.start()
        response = await call_next(request)
        yappi.stop()

        #yappi.get_func_stats().sort('ttot', sort_order="desc").print_all() # All time

        db_exec_time = yappi.get_func_stats(dict(name=sqlalchemy.engine.base.Engine.execute.__qualname__))
        #db_fetch_time = yappi.get_func_stats(dict(name=sqlalchemy.engine.result.ResultProxy.fetchone.__qualname__))
        pydantic_time = yappi.get_func_stats(dict(name=fastapi.routing.serialize_response.__qualname__))
        render_time = yappi.get_func_stats(dict(name=response.render.__qualname__))

        server_timing = []

        if not db_exec_time.empty():
            server_timing.append(f"db_exec;dur={(db_exec_time.pop().ttot * 1000):.3f}")

        if not pydantic_time.empty():
            server_timing.append(f"pydantic;dur={(pydantic_time.pop().ttot * 1000):.3f}")

        if not render_time.empty():
            server_timing.append(f"render;dur={(render_time.pop().ttot * 1000):.3f}")

        yappi.clear_stats()
        response.headers["Server-Timing"] = ','.join(server_timing)
        return response
Because of that, I doubt that can be "correctly realized" on an async framework like FastAPI using a regular profiler, since I'd ideally want to leave this sort of performance collection online to facilitate performance analysis in real-world use cases.
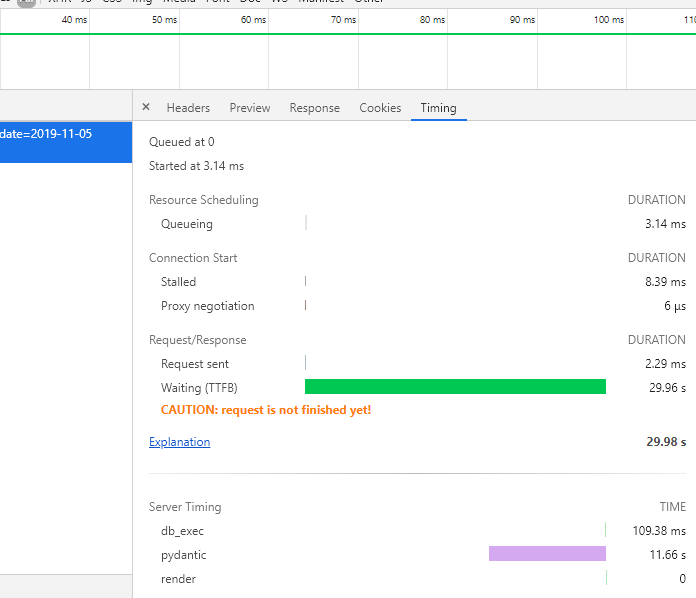
Server-Timing is working as I'd hoped, though.
sm-Fifteen
on 11 Nov 2019
Haha, that's some heavy pydantic!
Yappi is able to track threads appropriately; I'm wondering if there is a way to use async contextvars in python 3.7 to achieve similar functionality. I'll look into it.
dmontagu
on 11 Nov 2019
Aha! It looks like you can override the context id callback with yappi!
See here: https://github.com/sumerc/yappi/blob/master/yappi.py#L938
I think we could use a contextvar for this and should be able to get proper per-request profiling! (In Python >=3.7)
dmontagu
on 11 Nov 2019
Haha, that's some heavy pydantic!
Seems like it's actually half jsonable_encoder and half Field.validate. But yeah, it's 6 or so sets of 9600 datapoints each, separated in arrays of 100 floats keyed by ISO8601 datetime. It's a good stress test, I'd say, even if common sense would advise to just return this as a CSV instead.
Aha! It looks like you can override the context id callback with yappi!
See here: https://github.com/sumerc/yappi/blob/master/yappi.py#L938
I think we could use a contextvar for this and should be able to get proper per-request profiling! (In Python >=3.7)
You seem to have a pretty clear idea of how that could be done. I haven't had the occasion to use contextvars yet, so could you show me how you would go about doing that?
sm-Fifteen
on 11 Nov 2019
I looked into it a little, and I'm assuming you mean something along those lines?
import contextvars

profiler_ctx_id = contextvars.ContextVar('profiler_ctx_id')

yappi.set_context_id_callback(lambda: profiler_ctx_id.get())

class BenchMiddleware(BaseHTTPMiddleware):
    async def dispatch(self, request: Request, call_next) -> Response:
        ctx_token = profiler_ctx_id.set(id(asyncio.current_task())) # Set unique id in context

        yappi.start()
        response = await call_next(request)
        yappi.stop()
(Guess I should update to python 3.7 or 3.8, since the contextvars backport for 3.6 doesn't work with asyncio)
sm-Fifteen
on 11 Nov 2019
I think there is a package called aiocontextvars which works with python 3.6.
This is what I have in mind:
from contextvars import ContextVar
from typing import Dict

import yappi
from starlette.middleware.base import BaseHTTPMiddleware
from starlette.requests import Request
from starlette.responses import Response
from starlette.types import ASGIApp
from yappi import YFuncStats

yappi_request_id = ContextVar('yappi_request_id')
yappi_request_id.set(-1)


def get_context_id() -> int:
    try:
        return yappi_request_id.get()
    except LookupError:
        return -2


yappi.set_context_id_callback(get_context_id)


class BenchMiddleware(BaseHTTPMiddleware):
    def __init__(self, app: ASGIApp, calls_to_track: Dict[str, str]) -> None:
        self.calls_to_track = calls_to_track
        super().__init__(app, None)

    async def dispatch(self, request: Request, call_next) -> Response:
        ctx_id = id(request)
        yappi_request_id.set(ctx_id)
        response = await call_next(request)

        tracked_stats: Dict[str, YFuncStats] = {}
        for name, call_to_track in self.calls_to_track.items():
            tracked_stats[name] = yappi.get_func_stats({"name": call_to_track, "ctx_id": ctx_id})

        server_timing = []
        for name, stats in tracked_stats.items():
            if not stats.empty():
                server_timing.append(f"{name};dur={(stats.pop().ttot * 1000):.3f}")
        if server_timing:
            response.headers["Server-Timing"] = ','.join(server_timing)
        return response


# ######################
# ##### Usage test #####
# ######################
import asyncio

import fastapi
import sqlalchemy
from httpx import AsyncClient
from fastapi import FastAPI

yappi.start()  # If you don't start yappi, stats.empty() will always be true
app = FastAPI()


@app.get("/")
async def context_id_endpoint() -> int:
    await asyncio.sleep(1)
    return get_context_id()


track: Dict[str, str] = {
    "db_exec": sqlalchemy.engine.base.Engine.execute.__qualname__,
    "pydantic": fastapi.routing.serialize_response.__qualname__,
    "render": Response.render.__qualname__,
    "endpoint": context_id_endpoint.__qualname__
}
app.add_middleware(BenchMiddleware, calls_to_track=track)


async def main():
    client = AsyncClient(app=app, )
    tasks = [client.get("http://www.example.org/") for _ in range(5)]
    resps = await asyncio.gather(*tasks)
    for resp in resps:
        print(f"Request ID: {resp.json()}")
        print(f"Server Timing: {resp.headers.get('server-timing')}")
        print("-----")


if __name__ == '__main__':
    asyncio.run(main())

"""
Request ID: 4451087568
Server Timing: pydantic;dur=0.980,render;dur=0.003,endpoint;dur=0.248
-----
Request ID: 4451120784
Server Timing: pydantic;dur=0.083,render;dur=0.003,endpoint;dur=0.227
-----
Request ID: 4451140944
Server Timing: pydantic;dur=0.057,render;dur=0.002,endpoint;dur=0.296
-----
Request ID: 4451161168
Server Timing: pydantic;dur=0.048,render;dur=0.003,endpoint;dur=0.196
-----
Request ID: 4451169104
Server Timing: pydantic;dur=0.047,render;dur=0.004,endpoint;dur=0.192
-----
"""
There is a little more tweaking to do here, but I wanted to share progress now.
dmontagu
on 11 Nov 2019
Potential problems:
I can't figure out how to track time spent awaiting async calls -- clearly that isn't showing up in the printouts of the endpoint duration. Using
yappi.set_clock_type("wall")also doesn't help withawaitcalls.This shouldn't matter too much if the goal is just to find cpu bottlenecks (e.g., related to serialization), and it shouldn't be a problem if you use def endpoints to achieve non-blocking IO, but it means that you can't get wall-time profiling for asyncio-based io. This seems kind of unfortunate for an ASGI middleware.
It would be nice if there was an easier way to track stats by module and function name; there is a way to filter by the "full_name", and to strip dirs from the filenames, but it annoyingly includes line numbers. Maybe that's fine for now, or maybe there is an easy way to just pass the callable itself to the middleware, and use the yappi function directly to determine the full_name.
dmontagu
on 11 Nov 2019
1. I can't figure out how to track time spent awaiting async calls -- clearly that isn't showing up in the printouts of the endpoint duration. Using `yappi.set_clock_type("wall")` also doesn't help with `await` calls.
Yeah, that's going to be tricky, since you'd probably have to monitor something like Task._step() or whatever the event loop stays parked in when it has nothing to do (if that's even possible). I looked it up and asyncio doesn't offer any sort of hook to keep track of how much time a task has spent running or suspended (or blocked from resuming because the event loop is busy). A lot of existing profilers "work" with async, but they don't neccesarily make it easy to get that sort of metric.
2\. It would be nice if there was an easier way to track stats by module and function name; there is a way to filter by the "full_name", and to strip dirs from the filenames, but it annoyingly includes line numbers. Maybe that's fine for now, or maybe there is an easy way to just pass the _callable itself_ to the middleware, and use the yappi function directly to determine the full_name.
I've seen a dir-stripping method in their doc, so that part shouldn't be an issue. Regarding gearing the middleware to take callables as parameters... yeah, that's not a bad idea. Those functions have enough introspection data to make it possible to derive what to feed the profiler to get info on them. Your other concerns would probably only affect the result of printing the complete output, though, not the headers I was planning to use, so that shouldn't be too much of a problem (although that could also be logged somewhere else, I don't know).
sm-Fifteen
on 11 Nov 2019
Also, I can't seem to get your version running properly, I only get the following error message.
[*] [yappi-err] context id callback returned non-integer
Request ID: 2466563236480
Server Timing: None
-----
Request ID: 2466563267168
Server Timing: None
-----
Request ID: 2466563273776
Server Timing: None
-----
Request ID: 2466563274736
Server Timing: None
-----
Request ID: 2466563275696
Server Timing: None
-----
https://github.com/sumerc/yappi/blob/afb2cffa815bae84c649fee43ea2b63419716a7a/_yappi.c#L227-L242
I'm not entirely sure what's causing this, no exception seems to even be thrown and debugging C modules is not as straightforward as pure Python.
sm-Fifteen
on 11 Nov 2019
Hello everyone, I am the author of yappi and as I said in the issue opened by @dmontagu https://github.com/sumerc/yappi/issues/21 , I would be more than happy to try my best helping you guys regarding profiling async. code.
I have not been able to digest all the information in this thread but if you need help please do not hesitate.
For the last question:
[*] [yappi-err] context id callback returned non-integer
This error means the context_id_callback returns a value that fails PyLong_AsLong() like you have suggested. Is it possible you return None or any other object other than an integer in that function somehow?
 sumerc
on 11 Nov 2019
sumerc
on 11 Nov 2019
And regarding the other problem(wall time is not being correct). IIRC, this was something we have solved for gevent library. See this code here: https://github.com/ajdavis/GreenletProfiler/blob/700349864a4f368a8a73a2a60f048c2e818d7cea/_vendorized_yappi/_yappi.c#L577
_pause_ctx()
_resume_ctx()
So, every time a ctx switch occurs, meaning context_id returned a different value, we simply pause_ctx and when it is resumed we call _resume_ctx which updates the internal call_stack time values by the factor of pause duration which should probably give correct results.
Please tell me this was your problem. I might have misunderstood the root of the problem here.
sumerc
on 11 Nov 2019
@sumerc Thanks for all the help! This may well solve the problem; I'll try it out.
@sm-Fifteen I'm running it in Python 3.7; is that a difference? Maybe try using aiocontextvars instead of contextvars in python 3.6?
dmontagu
on 11 Nov 2019
Hello everyone, I am the author of yappi and as I said in the issue opened by dmontagu sumerc/yappi#21 , I would be more than happy to try my best helping you guys regarding profiling async. code.
I have not been able to digest all the information in this thread but if you need help please do not hesitate.
Don't worry about the FastAPI and other web-framework specifics, the main thing you should know is that we're trying to get profiling results (mainly just total runtime) for specific functions and coroutines, and having multiple concurrent but unrelated async Tasks running on the same thread is leading to some interesting issues.
[*] [yappi-err] context id callback returned non-integer
This error means the context_id_callback returns a value that fails PyLong_AsLong() like you have suggested. Is it possible you return None or any other object other than an integer in that function somehow?
I'm running it in Python 3.7; is that a difference? Maybe try using aiocontextvars instead of contextvars in python 3.6?
Disregard that, it's most likely related to how I upgraded my venv from Python36 to Python38; I did some more tests and I have a number of other libraries that are now complaining about version mismatches.
Traceback (most recent call last):
    from pyexpat import *
ImportError: Module use of python36.dll conflicts with this version of Python.
I'll try again with a fresh venv when I get time. If not, it's probably just my environment variables being misconfigured.
sm-Fifteen
on 11 Nov 2019
I am also writing here for reference: (along with https://github.com/sumerc/yappi/issues/21)
I have done few experiments on python 3.7 for coroutine wall-time profiling. It is in very alpha stage(far from production ready) but seems to work on cases I had thrown. It would be great if you guys would like to play with it.
The test branch name is coroutine-profiling.
Please send your valuable feedback.
sumerc
on 13 Nov 2019
I would like to give a small update:
This problem is wayyy harder than I originally thought as multiple threads are involved and coroutines are not profile friendly as various profiler events are happening in YIELD operations in coroutine switches.
But: I think we are pretty close to end: I have started writing more and more tests based on @dmontagu 's work and the only missing piece is a new API for tagging different functions/coroutines and being able to filter on them. The previous solution using set_context_id_cbk is not working with edge cases like: multithreaded recursive calls as an example. We NEED to have separate call stacks per thread in the profiler.
in short: stay tuned. I will be updating here once all the testing/implementation is finished.
sumerc
on 19 Nov 2019
Latest update:
Implementation is mostly finished, I am currently extensively writing more and more tests to validate corner cases, but initial tests seems pretty promising and somewhat stable.
A new API is added to yappi: set_tag_callback. You can basically any function, code together and filter by its tag (multithreaded or not). I am hoping that you can use this new API to make your own coroutine/context/request...etc aware profiling.
coroutine aware wall-time profiling support is also implemented. You can see the overall wall-time spent per-coroutine with correct call count(normally YIELDs are seen another callcount which is the default behaviour of cProfile, too.)
I would be more than happy to hear your feedback on this latest work. The branch name is coroutine-profiling. Here is the link: https://github.com/sumerc/yappi/tree/coroutine-profiling
sumerc
on 26 Nov 2019
I adapted @dmontagu example using set_tag_callback and set yappi to calculate wall times.
The result is weird : if you increase tasks number the endpoint is slower and slower.
Not sure if AsyncClient is the best way to test that, or if I'm doing something bad
adapted profile middleware snippet
import time
from contextvars import ContextVar
from typing import Dict, Tuple

import fastapi
import yappi
from starlette.middleware.base import BaseHTTPMiddleware
from starlette.requests import Request
from starlette.responses import Response
from starlette.types import ASGIApp
from yappi import YFuncStats

yappi_request_id = ContextVar('yappi_request_id')
yappi_request_id.set(-10)


def get_context_id() -> int:
    try:
        return yappi_request_id.get()
    except LookupError:
        return -2


yappi.set_tag_callback(get_context_id)


class BenchMiddleware(BaseHTTPMiddleware):
    def __init__(self, app: ASGIApp, calls_to_track: Dict[str, str]) -> None:
        self.calls_to_track = calls_to_track
        super().__init__(app, None)

    async def dispatch(self, request: Request, call_next) -> Response:
        ctx_id = id(request)
        yappi_request_id.set(ctx_id)
        assert yappi_request_id.get() == ctx_id
        response = await call_next(request)
        tracked_stats: Dict[str, YFuncStats] = {}
        for name, call_to_track in self.calls_to_track.items():
            tracked_stats[name] = yappi.get_func_stats({"name": call_to_track, "tag": ctx_id})
        server_timing = []
        for name, stats in tracked_stats.items():
            if not stats.empty():
                server_timing.append(f"{name}={(stats.pop().ttot * 1000):.3f}")
        if server_timing:
            response.headers["Server-Timing"] = ','.join(server_timing)
        return response


# ######################
# ##### Usage test #####
# ######################
import asyncio

from httpx import AsyncClient
from fastapi import FastAPI


app = FastAPI()
yappi.set_clock_type("wall")
yappi.start()  # If you don't start yappi, stats.empty() will always be true


@app.get("/")
async def context_id_endpoint() -> Tuple[int, float]:
    start = time.time()
    await asyncio.sleep(1)
    end = time.time()
    return get_context_id(), end - start


track: Dict[str, str] = {
    "endpoint": context_id_endpoint.__qualname__,
    "pydantic": fastapi.routing.serialize_response.__qualname__,
    "render": Response.render.__qualname__,
}
app.add_middleware(BenchMiddleware, calls_to_track=track)


async def main():
    client = AsyncClient(app=app, )
    tasks = [client.get("http://www.example.org/") for _ in range(100)]
    resps = await asyncio.gather(*tasks)
    for resp in resps:
        print(f"Request ID: {resp.json()[0]}")
        print(f"Actual timing: {resp.json()[1]* 1000:>8.3f}")
        print(f"Server Timing: {resp.headers.get('server-timing')}")
        print("-----")

if __name__ == '__main__':
    asyncio.run(main())
    yappi.stop()
output
Request ID: 140630327072272
Actual timing: 1005.394
Server Timing: endpoint=1005.626,pydantic=16.085,render=0.027
-----
Request ID: 140630327089552
Actual timing: 1503.769
Server Timing: endpoint=1504.146,pydantic=1.498,render=0.025
-----
Request ID: 140630327101200
Actual timing: 1505.963
Server Timing: endpoint=1506.183,pydantic=1.465,render=0.026
-----
Request ID: 140630327116880
Actual timing: 1508.183
Server Timing: endpoint=1508.477,pydantic=3.225,render=0.025
-----
Request ID: 140630327128464
Actual timing: 1513.989
Server Timing: endpoint=1514.206,pydantic=1.453,render=0.026
-----
Request ID: 140630327131792
Actual timing: 1515.662
Server Timing: endpoint=1515.877,pydantic=1.479,render=0.026
-----
Request ID: 140630327139280
Actual timing: 3663.426
Server Timing: endpoint=3663.671,pydantic=1.629,render=0.026
-----
Request ID: 140630327159056
Actual timing: 3665.578
Server Timing: endpoint=3665.802,pydantic=1.528,render=0.026
-----
Request ID: 140630326761040
Actual timing: 3667.324
Server Timing: endpoint=3667.541,pydantic=1.475,render=0.026
-----
Request ID: 140630326776720
Actual timing: 3669.076
Server Timing: endpoint=3669.301,pydantic=1.448,render=0.026
-----
Request ID: 140630326800528
Actual timing: 3670.757
Server Timing: endpoint=3670.998,pydantic=1.483,render=0.028
-----
Request ID: 140630326803920
Actual timing: 3672.572
Server Timing: endpoint=3672.790,pydantic=1.525,render=0.026
-----
Request ID: 140630326799120
Actual timing: 3674.568
Server Timing: endpoint=3674.787,pydantic=1.478,render=0.026
-----
Request ID: 140630326827088
Actual timing: 3676.385
Server Timing: endpoint=3676.611,pydantic=1.517,render=0.026
-----
Request ID: 140630326838672
Actual timing: 3678.235
Server Timing: endpoint=3678.449,pydantic=1.546,render=0.025
-----
Request ID: 140630326829776
Actual timing: 3680.049
Server Timing: endpoint=3680.277,pydantic=1.482,render=0.025
-----
Request ID: 140630326833104
Actual timing: 3681.831
Server Timing: endpoint=3682.046,pydantic=1.493,render=0.027
-----
Request ID: 140630326869264
Actual timing: 3681.375
Server Timing: endpoint=3681.639,pydantic=1.484,render=0.026
-----
Request ID: 140630326884944
Actual timing: 3683.106
Server Timing: endpoint=3683.322,pydantic=1.501,render=0.025
-----
Request ID: 140630326896528
Actual timing: 3684.911
Server Timing: endpoint=3685.129,pydantic=1.564,render=0.025
-----
Request ID: 140630326908112
Actual timing: 3686.854
Server Timing: endpoint=3687.071,pydantic=1.543,render=0.026
-----
Request ID: 140630326915600
Actual timing: 3688.736
Server Timing: endpoint=3688.953,pydantic=1.481,render=0.025
-----
Request ID: 140630326918928
Actual timing: 3690.601
Server Timing: endpoint=3690.815,pydantic=1.497,render=0.025
-----
Request ID: 140630326942800
Actual timing: 3692.363
Server Timing: endpoint=3692.578,pydantic=1.472,render=0.027
-----
Request ID: 140630326954384
Actual timing: 3694.184
Server Timing: endpoint=3694.399,pydantic=1.467,render=0.025
-----
Request ID: 140630326445776
Actual timing: 3695.984
Server Timing: endpoint=3696.195,pydantic=1.482,render=0.025
-----
Request ID: 140630326457360
Actual timing: 3697.692
Server Timing: endpoint=3697.912,pydantic=1.505,render=0.026
-----
Request ID: 140630326472976
Actual timing: 3699.442
Server Timing: endpoint=3699.654,pydantic=1.530,render=0.025
-----
Request ID: 140630326476368
Actual timing: 3701.150
Server Timing: endpoint=3701.360,pydantic=1.444,render=0.025
-----
Request ID: 140630326483856
Actual timing: 3702.715
Server Timing: endpoint=3702.926,pydantic=1.466,render=0.025
-----
Request ID: 140630326491344
Actual timing: 3704.354
Server Timing: endpoint=3704.566,pydantic=1.450,render=0.025
-----
Request ID: 140630326519312
Actual timing: 3706.019
Server Timing: endpoint=3706.232,pydantic=1.461,render=0.026
-----
Request ID: 140630326526800
Actual timing: 3707.584
Server Timing: endpoint=3707.798,pydantic=1.498,render=0.025
-----
Request ID: 140630326538320
Actual timing: 3709.114
Server Timing: endpoint=3709.326,pydantic=1.459,render=0.026
-----
Request ID: 140630326541712
Actual timing: 3710.704
Server Timing: endpoint=3710.914,pydantic=1.439,render=0.026
-----
Request ID: 140630326553296
Actual timing: 3712.355
Server Timing: endpoint=3712.564,pydantic=1.468,render=0.026
-----
Request ID: 140630326560784
Actual timing: 3713.957
Server Timing: endpoint=3714.169,pydantic=1.467,render=0.025
-----
Request ID: 140630326588752
Actual timing: 3715.575
Server Timing: endpoint=3715.789,pydantic=1.465,render=0.026
-----
Request ID: 140630326596240
Actual timing: 3717.222
Server Timing: endpoint=3717.429,pydantic=1.473,render=0.026
-----
Request ID: 140630326599568
Actual timing: 3715.476
Server Timing: endpoint=3715.684,pydantic=1.530,render=0.059
-----
Request ID: 140630326607056
Actual timing: 3717.128
Server Timing: endpoint=3717.338,pydantic=1.447,render=0.025
-----
Request ID: 140630326626832
Actual timing: 3718.653
Server Timing: endpoint=3718.859,pydantic=1.458,render=0.026
-----
Request ID: 140630326351696
Actual timing: 3720.328
Server Timing: endpoint=3720.536,pydantic=1.464,render=0.025
-----
Request ID: 140630326359184
Actual timing: 3722.152
Server Timing: endpoint=3722.455,pydantic=1.941,render=0.025
-----
Request ID: 140630326378960
Actual timing: 3724.499
Server Timing: endpoint=3724.709,pydantic=1.451,render=0.025
-----
Request ID: 140630326382288
Actual timing: 3726.132
Server Timing: endpoint=3726.342,pydantic=1.467,render=0.026
-----
Request ID: 140630326393872
Actual timing: 3727.642
Server Timing: endpoint=3727.851,pydantic=1.458,render=0.025
-----
Request ID: 140630326409552
Actual timing: 3729.195
Server Timing: endpoint=3729.402,pydantic=1.446,render=0.026
-----
Request ID: 140630326425232
Actual timing: 3730.715
Server Timing: endpoint=3730.926,pydantic=1.483,render=0.026
-----
Request ID: 140630325912528
Actual timing: 3732.300
Server Timing: endpoint=3732.512,pydantic=1.493,render=0.025
-----
Request ID: 140630325928144
Actual timing: 3734.359
Server Timing: endpoint=3734.567,pydantic=1.458,render=0.025
-----
Request ID: 140630325931536
Actual timing: 3736.066
Server Timing: endpoint=3736.274,pydantic=1.469,render=0.025
-----
Request ID: 140630325943120
Actual timing: 3737.696
Server Timing: endpoint=3737.927,pydantic=1.473,render=0.025
-----
Request ID: 140630325950608
Actual timing: 3739.330
Server Timing: endpoint=3739.539,pydantic=1.526,render=0.026
-----
Request ID: 140630325966288
Actual timing: 3740.921
Server Timing: endpoint=3741.127,pydantic=1.450,render=0.026
-----
Request ID: 140630325986064
Actual timing: 3742.454
Server Timing: endpoint=3742.660,pydantic=1.462,render=0.025
-----
Request ID: 140630325989328
Actual timing: 3744.012
Server Timing: endpoint=3744.218,pydantic=1.448,render=0.025
-----
Request ID: 140630325996880
Actual timing: 3745.572
Server Timing: endpoint=3745.782,pydantic=1.452,render=0.026
-----
Request ID: 140630326008464
Actual timing: 3747.053
Server Timing: endpoint=3747.260,pydantic=1.466,render=0.026
-----
Request ID: 140630326028240
Actual timing: 3748.579
Server Timing: endpoint=3748.786,pydantic=1.452,render=0.025
-----
Request ID: 140630326035728
Actual timing: 3750.201
Server Timing: endpoint=3750.408,pydantic=1.462,render=0.025
-----
Request ID: 140630326051408
Actual timing: 3749.421
Server Timing: endpoint=3749.628,pydantic=1.484,render=0.062
-----
Request ID: 140630326054736
Actual timing: 3750.952
Server Timing: endpoint=3751.161,pydantic=1.472,render=0.025
-----
Request ID: 140630326070416
Actual timing: 3752.481
Server Timing: endpoint=3752.706,pydantic=1.438,render=0.025
-----
Request ID: 140630326082000
Actual timing: 3753.922
Server Timing: endpoint=3754.126,pydantic=1.524,render=0.026
-----
Request ID: 140630326097680
Actual timing: 3755.449
Server Timing: endpoint=3755.655,pydantic=1.466,render=0.025
-----
Request ID: 140630326113360
Actual timing: 3757.041
Server Timing: endpoint=3757.245,pydantic=1.449,render=0.026
-----
Request ID: 140630326124944
Actual timing: 3758.616
Server Timing: endpoint=3758.819,pydantic=1.452,render=0.026
-----
Request ID: 140630326128272
Actual timing: 3760.273
Server Timing: endpoint=3760.481,pydantic=1.455,render=0.024
-----
Request ID: 140630326139856
Actual timing: 3761.809
Server Timing: endpoint=3762.011,pydantic=1.443,render=0.025
-----
Request ID: 140630326147344
Actual timing: 3763.337
Server Timing: endpoint=3763.540,pydantic=2.205,render=0.026
-----
Request ID: 140630326163024
Actual timing: 3769.531
Server Timing: endpoint=3769.755,pydantic=1.486,render=0.025
-----
Request ID: 140630325658512
Actual timing: 3771.255
Server Timing: endpoint=3771.458,pydantic=1.463,render=0.029
-----
Request ID: 140630325678224
Actual timing: 3772.769
Server Timing: endpoint=3773.012,pydantic=1.476,render=0.026
-----
Request ID: 140630325681616
Actual timing: 3774.348
Server Timing: endpoint=3774.553,pydantic=1.527,render=0.025
-----
Request ID: 140630325689104
Actual timing: 3775.944
Server Timing: endpoint=3776.149,pydantic=1.449,render=0.025
-----
Request ID: 140630325704784
Actual timing: 3777.441
Server Timing: endpoint=3777.645,pydantic=1.451,render=0.026
-----
Request ID: 140630325720464
Actual timing: 3778.922
Server Timing: endpoint=3779.126,pydantic=1.468,render=0.026
-----
Request ID: 140630325727952
Actual timing: 3780.493
Server Timing: endpoint=3780.698,pydantic=1.449,render=0.025
-----
Request ID: 140630325731280
Actual timing: 3781.271
Server Timing: endpoint=3781.476,pydantic=1.450,render=0.026
-----
Request ID: 140630325746960
Actual timing: 3781.908
Server Timing: endpoint=3782.126,pydantic=1.523,render=0.026
-----
Request ID: 140630325754448
Actual timing: 46732.672
Server Timing: endpoint=46732.886,pydantic=1.573,render=0.026
-----
Request ID: 140630325770128
Actual timing: 46734.551
Server Timing: endpoint=46734.753,pydantic=1.449,render=0.026
-----
Request ID: 140630325789904
Actual timing: 46735.902
Server Timing: endpoint=46736.103,pydantic=1.435,render=0.026
-----
Request ID: 140630325797392
Actual timing: 46737.182
Server Timing: endpoint=46737.380,pydantic=1.416,render=0.025
-----
Request ID: 140630325800720
Actual timing: 46738.384
Server Timing: endpoint=46738.584,pydantic=1.425,render=0.026
-----
Request ID: 140630325816400
Actual timing: 46739.486
Server Timing: endpoint=46739.687,pydantic=1.412,render=0.026
-----
Request ID: 140630325836176
Actual timing: 46740.602
Server Timing: endpoint=46740.814,pydantic=1.410,render=0.027
-----
Request ID: 140630325843664
Actual timing: 46741.824
Server Timing: endpoint=46742.023,pydantic=1.419,render=0.026
-----
Request ID: 140630325855248
Actual timing: 46743.019
Server Timing: endpoint=46743.236,pydantic=1.423,render=0.026
-----
Request ID: 140630325874960
Actual timing: 46744.202
Server Timing: endpoint=46744.400,pydantic=1.426,render=0.026
-----
Request ID: 140630325878352
Actual timing: 46745.319
Server Timing: endpoint=46745.516,pydantic=1.407,render=0.026
-----
Request ID: 140630325889936
Actual timing: 46746.456
Server Timing: endpoint=46746.654,pydantic=1.417,render=0.026
-----
Request ID: 140630325897424
Actual timing: 46744.136
Server Timing: endpoint=46744.332,pydantic=1.407,render=0.059
-----
Request ID: 140630325909008
Actual timing: 46745.270
Server Timing: endpoint=46745.464,pydantic=1.389,render=0.025
-----
Request ID: 140630325396304
Actual timing: 46746.365
Server Timing: endpoint=46746.566,pydantic=1.428,render=0.026
-----
Request ID: 140630325407824
Actual timing: 46747.592
Server Timing: endpoint=46747.791,pydantic=1.416,render=0.026
-----
Request ID: 140630325411216
Actual timing: 46748.702
Server Timing: endpoint=46748.896,pydantic=1.389,render=0.026
-----
Request ID: 140630325439184
Actual timing: 46749.879
Server Timing: endpoint=46750.075,pydantic=1.414,render=0.025
-----
Request ID: 140630325450768
Actual timing: 46751.000
Server Timing: endpoint=46751.197,pydantic=1.404,render=0.027
-----

Process finished with exit code 0
however yappi wall time and endpoint calculated times are consistent it seems
it seems also 1st call of pydantic is always huge vs the others
 euri10
on 26 Nov 2019
euri10
on 26 Nov 2019
The result is weird : if you increase tasks number the endpoint is slower and slower.
Just my two cents on above:
With profiling there is always the risk of adding more overhead to the profiled application. This issue exists in all deterministic profilers. See: https://docs.python.org/3.8/library/profile.html#calibration
So, profiling a single request vs whole server might require different approaches. What I would suggest is at first, do not take whole server(or clients making concurrent requests) performance issues too seriously (at least at first). Instead focus on single requests and try to identify critical paths.
Of course, you can always validate if the profiler is the reason to overhead by simply disabling it.
sumerc
on 26 Nov 2019
makes sense @sumerc this is probably trying to check too many things at once,
the reason it surprised me is that the 100 tasks without the profiler (just commenting app.add_middleware(BenchMiddleware, calls_to_track=track in the snippet above), the whole script takes 8s to run, with each individual endpoint taking from 1 to 2.8s while
With the profiler ( I should say the middleware in that case ) the entire script runs in 66s with each endpoint growing from 1s to well 50s, so I'm not sure if effectively the middleware in that case is not blocking somewhere
euri10
on 26 Nov 2019
Hmm. Interesting, that is actually too much overhead.
2 questions:
Are you using the latest code? The last commit I have commited this morning might decrease the overhead a lot.
Can I run the code? Does it require too much dependency?
sumerc
on 26 Nov 2019
To make sure I uninstalled and reinstalled yappi, I got same results overall, 75s overall for 100 tasks, comment the line 74 app.add_middleware(BenchMiddleware, calls_to_track=track) that sets the middleware and it runs in like 2s, code is here this might be ridiculously obvious to you I suppose (/hide in advance...)
the code just needs httpx and fastapi
pipenv install git+https://github.com/sumerc/yappi.git@coroutine-profiling#egg=yappi
Courtesy Notice: Pipenv found itself running within a virtual environment, so it will automatically use that environment, instead of creating its own for any project. You can set PIPENV_IGNORE_VIRTUALENVS=1 to force pipenv to ignore that environment and create its own instead. You can set PIPENV_VERBOSITY=-1 to suppress this warning.
Installing git+https://github.com/sumerc/yappi.git@coroutine-profiling#egg=yappi…
Warning: You installed a VCS dependency in non-editable mode. This will work fine, but sub-dependencies will not be resolved by $ pipenv lock.
  To enable this sub-dependency functionality, specify that this dependency is editable.
Collecting yappi
  Cloning https://github.com/sumerc/yappi.git (to revision coroutine-profiling) to /tmp/pip-install-1uh2c4rg/yappi
Building wheels for collected packages: yappi
  Building wheel for yappi (setup.py): started
  Building wheel for yappi (setup.py): finished with status 'done'
  Created wheel for yappi: filename=yappi-1.1-cp37-cp37m-linux_x86_64.whl size=29512 sha256=54834177a6189ff7e9c5b4baaa24d9f5bce6e5e20cdc419125590a1031c67172
  Stored in directory: /tmp/pip-ephem-wheel-cache-lub13rl8/wheels/fa/4e/dc/066c086efcf008ea50662b679c7710e00d67e7f29064148a6e
Successfully built yappi
Installing collected packages: yappi
Successfully installed yappi-1.1
@euri10: Also interesting is how your endpoint time jumps from 1.5s to 3.7s to 46.7s as the list goes on, despite the code being profiled consisting solely of await asyncio.sleep(1), which doesn't actually do anything and just schedules a future to resolve later.
There's no other code in your endpoint that would block your event loop, so could this be the profiler interfering with the event loop's ability to resolve a large number of futures in parallel?
sm-Fifteen
on 26 Nov 2019
that was my guess too @sm-Fifteen
the endpoint is below, would time.time() be blocking ? I tried commenting those and it had same effects so I thought it was in the middleware,
@app.get("/")
async def context_id_endpoint() -> Tuple[int, float]:
    start = time.time()
    await asyncio.sleep(1)
    end = time.time()
    return get_context_id(), end-start
same effect with
@app.get("/")
async def context_id_endpoint() -> Tuple[int, float]:
    # start = time.time()
    start = 0
    await asyncio.sleep(1)
    # end = time.time()
    end = 1
    return get_context_id(), end-start
If time.time() was blocking for any measurable amount of time, that would definitely be a first. There's just nothing in that endpoint that could block, whatever is slowing this down is something between the profiler and coroutine scheduling. The jump to 46.7s happens 82 requests in, so it might be worth testing profiling large amounts of coroutines like this on yappi's side.
sm-Fifteen
on 26 Nov 2019
I am also suspecting that there is some issue related with profiler+event loop happening however I could not yet confirm. In parallel, I am thinking to implement a very simple new API to return the actual time spent in the profiler itself. This way we will be %100 sure on what is what, then I will try to find the bottleneck. I will update here once I finish that new API.
sumerc
on 26 Nov 2019
you're amazing @sumerc thanks a lot and thanks also @sm-Fifteen for bringing this up, I'm really excited at exploring this ! and sorry for looping hard :+1: :rofl:
euri10
on 26 Nov 2019
Thanks @euri10 , @sm-Fifteen . Still not %100 but I might have identified the problem: the tagging code is taking too much time as it is a basic linked list retrieval, when I remove it whole profile returns back to 3 secs or more. I did not think it will make such a big problem at least initially but now as we hit the bottleneck: I will convert it to a hashtable ASAP. Please do not use the latest code, the commit that is safe to play with is: https://github.com/sumerc/yappi/commit/bbf1d42b1ffad81123d0bc7b70ed008ba9391053 if anyone interested. I will change whole implementation and we will see what happens.
Thanks guys again for helping me on these, you are keeping me on track.
sumerc
on 26 Nov 2019
the aforementionned commit seems to improve things a little bit (pipenv install git+https://github.com/sumerc/yappi.git@bbf1d42b1ffad81123d0bc7b70ed008ba9391053#egg=yappi
), still at 42s though, fingers crossed on the hashtable
Thanks guys again for helping me on these, you are keeping me on track.
anytime you'll need a silly user to use your apis in a way that was not intended you can call me :rabbit:
euri10
on 26 Nov 2019
Hi everyone,
I think I have identified the issue: the issue is when you call yappi.get_func_stats() from dispatch you are always enumerating ALL collected traces and then select ctx_id's into them. So the problem is yappi does not clear the traces manually obviously and as we iterate over and over we see exponential behaviour because at each time you will enumerate more and more stats. So simply add yappi.clear_stats() after calculating the server timing and with that change: I can easily run 1000 in 9 secs in my computer and 100 in nearly 2 secs.
So the issue is: I have already implemented the hashtable instead of linked list without much performance gain, but anyway, this change was not bad in long term:)
UPDATE: I have also seen nearly linear increases from 1000 to 2000 or from 100 to 200.
sumerc
on 27 Nov 2019
you rock @sumerc !
euri10
on 27 Nov 2019
So the problem is yappi does not clear the traces manually obviously and as we iterate over and over we see exponential behaviour because at each time you will enumerate more and more stats. So simply add
yappi.clear_stats()after calculating the server timing and with that change
The doc says clear_stats() affects the profiler globally, is it possible to only clear stats for the current context? I don't mind cleaning up the profiler data once I'm done with the stats I've collected, but I wouldn't want to affect stat collection for the other concurrently running tasks or threads.
sm-Fifteen
on 27 Nov 2019
So the problem is yappi does not clear the traces manually obviously and as we iterate over and over we see exponential behaviour because at each time you will enumerate more and more stats. So simply add
yappi.clear_stats()after calculating the server timing and with that changeThe doc says
clear_stats()affects the profiler globally, is it possible to only clear stats for the current context? I don't mind cleaning up the profiler data once I'm done with the stats I've collected, but I wouldn't want to affect stat collection for the other concurrently running tasks or threads.
+1 we're losing info it seems
euri10
on 27 Nov 2019
Then you could also do following: collect your stats. and then after all finished, enumerate and filter on your wanted ctx_id's. Currently you can only select single ctx_id in filter but we can change that and maybe accept a simple lambda function for filtering on multiple conditions. I think this is more common approach and let's leave clear_stats as is.
UPDATE: And also: yappi.get_func_stats() returns YFuncStats object which a nice object for iterating selecting you own tag:
for t in yappi.get_func_stats():
    if t.tag == x:
        results.append(t.ttot)
The only thing that prevents us from doing above is by default we filter on DEFAULT_TAG. I will be fixing that but I think this approach is also better.
sumerc
on 27 Nov 2019
In our specific use case, since we have one task per connection, each of which being its own separate context that will log its info just before the response is returned, each context would have its stats cleared right after the profiling data has been read, independently of the other contexts. There isn't really any reason to select and/or clear multiple context ids at the same time, only the current one once the tesk we were profiling has completed. I just want to make sure that's actually possible without interfering with profiling on the other tasks.
sm-Fifteen
on 27 Nov 2019
Currently it is not possible I need to do few tweaks. But before that: what is the problem with getting the stats at the final end? Do you use same req. ids over and over again?
sumerc
on 27 Nov 2019
Getting the stats isn't the problem (I think, at least, I haven't had the occasion to test the dev branch for myself), I just want to make sure that there's a way to clear profiler stats for the current scope/context only.
sm-Fifteen
on 27 Nov 2019
No we don't have that currently.
IMHO: improving filtering on get_stats() is a better alternative for our problem. But of course if there is a real use case I don't see for filtering on clear_stats() it can be done.
UPDATE: To make things clear: My suggestion is to filter stats only once not per dispatch call like in the example.
sumerc
on 27 Nov 2019
After re-thinking over this, I decided it would be better to move filtering to C side, currently it is on Python side which slows things. I have implemented this change and now 100 requests become 3.6 secs without even clear_stats!
And maybe we should also think filtering on clear_stats() as you suggested since we are returning the response in server-timing header which we want right? Let's do that and I hope with both these changes we will be ok performance-wise.
sumerc
on 27 Nov 2019
tested and loving it @sumerc thanks,
what is the total pit count ?
also on a side note httpx dropped AsyncClient, should you use 0.8 the Client class
euri10
on 28 Nov 2019
what is the
total pit count?
It was a typo left for debugging something...
Ok. I think you can also continue testing in parallel and I will be informing you after implementing the filtering. Maybe also do CPU time testing...etc.. not sure about use cases.
Then before release: I need to make sure all code works for all Python versions and write more and more tests. But meanwhile hopefully you can start integrating yappi into your workflow :)
Thanks again guys!
sumerc
on 28 Nov 2019
Ok. This will hopefully be my final update:
I have done few changes related to get_func_stats() again: implemented filtering on C side and moved same tags into same hashtables. With these improvements, now 1000 concurrent requests is being done in ~3.7 secs! which seems to indicate 10x improvement. I think we no more need filtering on clear_stats() as the number of tags does not affect performance anymore while filtering on tag.(as we use a hashtable underneath.)
Anyway, I will be finalizing the tests and hopefully will be releasing a new version which includes lots of new, exciting stuff. Looking forward to your latest feedback and use cases in FastAPI, too, of course.
sumerc
on 4 Dec 2019
looking forward to test your latest improvments but so far even before the hashtable it was perfect ! thanks a lot @sumerc
euri10
on 4 Dec 2019
I think we no more need filtering on clear_stats() as the number of tags does not affect performance anymore while filtering on tag.(as we use a hashtable underneath.)
What if I were to leave the profiler running on a test server for several days or weeks, wouldn't the inability to "garbage collect" old profiling data cause memory or performance issues?
sm-Fifteen
on 5 Dec 2019
What if I were to leave the profiler running on a test server for several days or weeks, wouldn't the inability to "garbage collect" old profiling data cause memory or performance issues?
I am not expecting performance issues, but we sure might have some memory issues. Maybe it would be better to implement this, but let's postpone as currently there is lots of code written for this feature and I really do not want to complicate things more.
And for your scenario: you can always call clear_stats() at 10000 request or in some specific interval like per-day. If the server is running several days/weeks I think having a few invalid profile calculations for couple of requests might not be so important after all.
sumerc
on 6 Dec 2019
Guys!
Thank you for all your help on this. Today, I have released a new version of Yappi(1.2.1). You can hopefully use it via installing from pip. I have updated the docs as well and written a bit more about coroutine profiling here: https://github.com/sumerc/yappi/blob/coroutine-profiling/doc/coroutine-profiling.md.
Please send me if you find any problems/inconsistencies with the new release. And for the future: I am open to any new suggestions on profiling async. code. Please do not hesitate to discuss/ask anything you think might help you making the code faster.
I will be adding your names on THANKS, that is all I can do at this time:)
sumerc
on 12 Dec 2019
This is fantastic! Way to set Yappi appart from any other python profiler, even the official ones. I also need to thank you for all the time and effort you've put into supporting this idea I was just throwing out there as a possible feature to integrate into the framework. I didn't even think it was possible to profile coroutines in Python, and as it turns out, I was right...
...but now, only a month later, thanks to you, it's now possible. So thank you, @sumerc! And here's to yappi becoming the go-to profiler for all async programs!
sm-Fifteen
on 12 Dec 2019
So I'm getting pretty good results with this test middleware and the following config for FastAPI:
from fastapi import FastAPI
app = FastAPI(debug=DEBUG, openapi_prefix=PATH_PREFIX)

import fastapi
import starlette.responses
import sqlalchemy.engine.base
app.add_middleware(ServerTimingMiddleware, calls_to_track={
    # All steps of the generated fastapi.routing.get_request_handler app
    "1deps": fastapi.routing.solve_dependencies.__qualname__, # `Depends` execution
    #"2endpoint": fastapi.routing.get_request_handler.?????.__qualname__,
    "3valid": fastapi.routing.ModelField.validate.__qualname__, # Pydantic model validation
    "4encode": fastapi.encoders.jsonable_encoder.__qualname__, # JSON encoding
    #"5render": starlette.responses.Response.render.__qualname__, # Respnse (JSON) rendering

    # Extra measurements
    "db_exec": sqlalchemy.engine.base.Engine.execute.__qualname__,
    #"db_fetch": sqlalchemy.engine.ResultProxy.fetchone.__qualname__,
})
I still can't figure how (generically) to get timing for the endpoint and response rendering execution. Response rendering is a problem because there's no easy way to connect starlette.responses.Response.render with starlette.responses.JSONResponse.render since they're two different functions (even though as methods they override each other).
Meanwhile, endpoint duration is a problem because the endpoint executor doesn't have a qualified name, it's executed as part of the app closure inside get_request_handler:
That means there's no single named function I can profile to get the endpoint execution time. Unless we extract those lines into some async def execute_endpoint(dependant) at the root of the module, I don't know if that one is going to be possible.
sm-Fifteen
on 8 Jan 2020
Thanks everyone for all the conversation here! :clap: :nerd_face:
I'm amazed by the value I see you generated here with your combinations of ideas. :open_mouth: :sparkles:
Thanks a lot @sumerc for all the effort you put into adding support for these async tools. :rocket: :muscle: :tada:
Did anyone of you publish the middleware as a package? I see @dmontagu 's fastapi-utils Timing middleware is quite similar, but doesn't use yappi, right? https://fastapi-utils.davidmontague.xyz/user-guide/timing-middleware/
I tried @sm-Fifteen 's implementation from the comment there and I got stats in the developer tools in the browser. That's awesome! :rocket:
I think that deserves existing as a published ASGI middleware package.
Maybe@sm-Fifteen could publish it, or @dmontagu could include it in fastapi-utils?
Also, trying it locally I had to change the line:
response['headers'].append(["server-timing", b','.join(server_timing)])
to
response['headers'].append([b"server-timing", b','.join(server_timing)])
(b"server-timing" as bytes).
@sm-Fifteen about timing the endpoint alone, I see the value in this and in being able to time just the endpoint duration. Would you like to send a PR putting that in a separate function?
 tiangolo
on 12 Feb 2020
tiangolo
on 12 Feb 2020
I tried @sm-Fifteen 's implementation from the comment there and I got stats in the developer tools in the browser. That's awesome! 🚀
Thanks! 😄 I'm a bit impressed myself at how well this all turned out.
I think that deserves existing as a published ASGI middleware package.
Maybe @sm-Fifteen could publish it, or dmontagu could include it in
fastapi-utils?Also, trying it locally I had to change the line:
response['headers'].append(["server-timing", b','.join(server_timing)])to
response['headers'].append([b"server-timing", b','.join(server_timing)])(
b"server-timing"asbytes).
Yeah, I probably missed a few things here or there. Like I said in that other post, this was more meant as a WIP proof-of-concept, and I was worried about a few remaining yappi issues (namely: "How should the profiler free memory?", "What's a reliable way to tell yappi to profile a specific function?") (also raised by dmontagu) causing problems so I haven't touched it much since. I can probably just polish up what's there, add a memory threshold where the middleware just wipes the profiler memory so it doesn't inflate until Python goes OOM, add a README listing the caveats and publish it.
@sm-Fifteen about timing the endpoint alone, I see the value in this and in being able to time just the endpoint duration. Would you like to send a PR putting that in a separate function?
Well,, if you're open to it, then I might as well. It's certainly going to be easier than the crazy solution I was considering, where I somehow time get_request_handler.<locals>.app and substract the duration of everything else.
sm-Fifteen
on 13 Feb 2020
I think that we now have a clear way to solve this and all the pieces in place on the FastAPI side.
The only piece missing is a third-party middleware (or just these snippets properly configured).
But as that would be on a third-party package, I think we can close this issue on the FastAPI side, right @sm-Fifteen ?
tiangolo
on 12 Apr 2020
@tiangolo: Pretty much. I'm going to release this as a proper middleware in the near future; I've mainly been holding off on it because the current way of determining if a function in the profiler's data matches one of the targeted ones is currently incorrect (see sumerc/yappi#22) due to a few implementation details in CPython that I wouldn't want to couple a simple ASGI middleware with.
The next release of Yappi addresses this by letting users match functions by their descriptors instead of their name (see sumerc/yappi#41), so once that lands, I'll probably make PR to add it in the FastAPI documentation or something like that. Whether you would rather keep this issue open until then, or consider the problem generally solved is up to you.
sm-Fifteen
on 13 Apr 2020
Is it possible to use this solution to time Starlette middlewares themselves, given that this is itself a middleware?
I am currently evaluating APM solutions (and their respective middlewares), and it would be very helpful if I could get some idea of the performance impact each one is having.
 acnebs
on 16 May 2020
acnebs
on 16 May 2020
@acnebs: As long as they're registered to run after the profiling middleware (because the context variables wouldn't be registered otherwise), maybe, although making sure that only the target middleware gets timed and not the rest of the application (since middleware have to call the next ASGI callable with the scope as part of their activity, meaninng they are always part of the application's callstack) might prove a bit tricky. The middleware I have right now can only return the end-to-end execution duration for the functions specified and I don't really know how complex I want to make that middleware.
sm-Fifteen
on 18 May 2020
Related issues
 RogerioDosSantos
·
3Comments
RogerioDosSantos
·
3Comments
 tsdmrfth
·
3Comments
tsdmrfth
·
3Comments
 KoduIsGreat
·
3Comments
KoduIsGreat
·
3Comments
 DrPyser
·
3Comments
DrPyser
·
3Comments
 kkinder
·
3Comments
kkinder
·
3Comments
Most helpful comment
This is fantastic! Way to set Yappi appart from any other python profiler, even the official ones. I also need to thank you for all the time and effort you've put into supporting this idea I was just throwing out there as a possible feature to integrate into the framework. I didn't even think it was possible to profile coroutines in Python, and as it turns out, I was right...
...but now, only a month later, thanks to you, it's now possible. So thank you, @sumerc! And here's to yappi becoming the go-to profiler for all async programs!