Fastapi: [BUG] Gunicorn Workers Hangs And Consumes Memory Forever
Describe the bug
I have deployed FastAPI which queries the database and returns the results. I made sure closing the DB connection and all. I'm running gunicorn with this line ;
gunicorn -w 8 -k uvicorn.workers.UvicornH11Worker -b 0.0.0.0 app:app --timeout 10
So after exposing it to the web, I run a load test which makes 30-40 requests in parallel to the fastapi. And the problem starts here. I'm watching the 'HTOP' in the mean time and I see that RAM usage is always growing, seems like no task is killed after completing it's job. Then I checked the Task numbers, same goes for it too, seems like gunicorn workers do not get killed. After some time RAM usage gets at it's maximum, and starts to throw errors. So I killed the gunicorn app but the thing is processes spawned by main gunicorn proces did not get killed and still using all the memory.
Environment:
- OS: Ubuntu 18.04
- FastAPI Version : 0.38.1
- Python version : 3.7.4
 MeteHanC
All 48 comments
You're using the PyPy compliant uvicorn worker class - is your system based on PyPy? If you're running on cpython then I suggest you try out the cpython implementation uvicorn.workers.UvicornWorker.
But in other news, I'm seeing something similar. I just run uvicorn with this:
uvicorn --host 0.0.0.0 --port 7001 app:api --reload but in some cases the memory is never freed up.
For example this function:
@api.post("/randompath")
def get_xoxo(file: UploadFile = File(...)):
k = []
for i in range(10):
k.append('gab' * 9999999)
When I hit the endpoint once, the memory is cleared up, but when I hit it 10x, some of the memory is left allocated and when I hit it another 10x, even more memory is left allocated. This continues until I run out of memory or restart the process.
If I change the get_xoxo function to be async, then the memory is always cleared up, but the function also blocks much more (which makes sense since I'm not taking advantage of any awaits in there).
So - is there a memory leak? I'm not sure, but something is handled incorrectly.
My system is running on python:3.7 Docker container. Basically the same problem occurs in production where uvicorn is run with uvicorn --host 0.0.0.0 --port %(ENV_UVICORN_PORT)s --workers %(ENV_UVICORN_WORKERS)s --timeout-keep-alive %(ENV_UVICORN_KEEPELIVE)s --log-level %(ENV_UVICORN_LOGLEVEL)s app:api.
 wanaryytel
on 11 Oct 2019
wanaryytel
on 11 Oct 2019
@wanaryytel
This is probably an issue with starlette's run_in_threadpool, or maybe even the python ThreadPoolExecutor. If you port that endpoint to starlette, I expect you'll get the same behavior.
Recently the starlette and uvicorn teams have been pretty good about addressing issues; if you can reproduce the memory leak in starlette, I'd recommend creating an issue demonstrating it in the starlette (and possible uvicorn?) repos.
 dmontagu
on 11 Oct 2019
dmontagu
on 11 Oct 2019
You're using the PyPy compliant uvicorn worker class - is your system based on PyPy? If you're running on cpython then I suggest you try out the cpython implementation
uvicorn.workers.UvicornWorker.
I have noticed that too, under high load memory is left allocated but for single requests memory gets cleared up. And I already tried it making async but it is not deallocating the memory as well.
@wanaryytel
This is probably an issue with starlette's
run_in_threadpool, or maybe even the python ThreadPoolExecutor. If you port that endpoint to starlette, I expect you'll get the same behavior.Recently the starlette and uvicorn teams have been pretty good about addressing issues; if you can reproduce the memory leak in starlette, I'd recommend creating an issue demonstrating it in the starlette (and possible uvicorn?) repos.
Hmm, reproducing it in Starlette makes sense. I will reproduce the issue and open an issue on Starlette repo. Thanks for the idea
MeteHanC
on 11 Oct 2019
@wanaryytel out of curiosity, why can't you use async with an await.sleep(0) thrown in there?
 euri10
on 15 Oct 2019
euri10
on 15 Oct 2019
@euri10 I could but I fail to see the benefit of that. It would still be blocking which I'm trying to avoid?
wanaryytel
on 16 Oct 2019
If I change the
get_xoxofunction to beasync, then the memory is always cleared up, but the function also blocks much more (which makes sense since I'm not taking advantage of anyawaits in there).
reading your comment @wanaryytel I thought the only thing preventing you from transforming your def in async def was just a missing await which I suggested could be that one await asyncio.sleep(0) :+1:
But if there are other parts in your def get_xoxo that block then indeed there's not much you'll benefit from it, you can nonetheless try to run the code in a loop.run_in_executor but I'm not sure if this plays well with the current loop
euri10
on 16 Oct 2019
@euri10 AFAIK you can have an async function without any awaits, but there's no point, because it will still be a semi-regular blocking function. Await is the thing that enables async processing, without that it's just a regular function basically. Correct me if I'm wrong
wanaryytel
on 16 Oct 2019
@wanaryytel It looks like this might actually be related to how python manages memory -- it's not guaranteed to release memory back to the os.
The top two answers to this stack overflow question have a lot of good info on this topic, and might point in the right direction.
That said, given you are just executing the same call over and over, it's not clear to me why it wouldn't reuse the memory -- there could be something leaking here (possibly related to the ThreadPoolExecutor...). You could check if it was related to the ThreadPoolExecutor by checking if you got the same behavior with an async def endpoint, which would not run in the ThreadPoolExecutor.
If the requests were being made concurrently, I suppose that could explain the use of more memory, which would then feed into the above stack overflow answer's explanation. But if you just kept calling the endpoint one call at a time in sequence, I think it's harder to explain.
If you really wanted to dig into this, it might be worth looking at the gc module and seeing if manually calling the garbage collector helps at all.
@MeteHanC whether this explains/addresses your issue or not definitely depends on what your endpoints are doing.
dmontagu
on 16 Oct 2019
hi all,
I have noticed the same issue with fastapi.
the function is async def - inside I do load a resource ~200mb, do something with this and return the response. the memory is not given free.
Example:
import gc
@router_dev.post(...)
async def endpoint(...):
model = Model(....) # load model from file
results = []
try:
... # do something with model
... # alternative - also do something with the model in thread pool
... # doing something with the model - is some computation and each step increases memory for about ~1mb (this is expected and gets free once done
... # above is tested in the library (normal function, exact same way) and there are no mem leaks - memory gets free as expected
results.append(...) # append here a string
finally:
# model = None # this is also not working well
del model
gc.collect()
return dict(results=results)
This occurs with:
- gunicron
uvicorn.workers.UvicornWorker - uvicorn
- hypecorn
- this is a simple one requests after another... and the memory keeps growing
So to me it seems to be a bug in starlette or uvicorn...
 madkote
on 4 Dec 2019
madkote
on 4 Dec 2019
would be happy to take a look a it @madkote if you get a simple reproductible example
euri10
on 4 Dec 2019
@madkote I’m not 100% confident this explains the issue, but I think this may actually just be how python works. I think this article does a good job explaining it:
You’ll notice that I’ve been saying “free” in quotes quite a bit. The reason is that when a block is deemed “free”, that memory is not actually freed back to the operating system. The Python process keeps it allocated and will use it later for new data. Truly freeing memory returns it to the operating system to use.
Edit: just realized I already replied in this issue with a link to similar discussions 😄.
dmontagu
on 4 Dec 2019
@madkote this starlette issue includes a good discussion of the problem (and some patterns to avoid that might be exacerbating it): https://github.com/encode/starlette/issues/667
dmontagu
on 4 Dec 2019
@dmontagu @euri10 I still have a suspect on two aspects:
- my model library - I will do even more testing and profiling
- I found out that blocking code performs better in terms of memory. With async every request increase by ~5MB (some model operation, and data processing). But with blocking manner it is about ~1mb every 2-3 requests..
everywhere I use the same model, even I tried with many (custom and free available)... the result is always the same.
So, please give me some more time to make a reasonable example to reproduce the issue.
madkote
on 4 Dec 2019
just for info: I run the same function under flask -> and the memory is constant (!) -> so for me there is something wrong with async...
madkote
on 4 Dec 2019
that's interesting, please send a little snippet, not saying I will find
the root of the problem but it's a good start !
On Wed, Dec 4, 2019 at 5:06 PM RES notifications@github.com wrote:
just for info: I run the same function under flask -> and the memory is
constant (!) -> so for me there is something wrong with async...—
You are receiving this because you were mentioned.
Reply to this email directly, view it on GitHub
https://github.com/tiangolo/fastapi/issues/596?email_source=notifications&email_token=AAINSPULWKKXRS62Z2KW67TQW7IR3A5CNFSM4I6DQN5KYY3PNVWWK3TUL52HS4DFVREXG43VMVBW63LNMVXHJKTDN5WW2ZLOORPWSZGOEF5Q5VI#issuecomment-561712853,
or unsubscribe
https://github.com/notifications/unsubscribe-auth/AAINSPRT5AKPRENJPNBNHZTQW7IR3ANCNFSM4I6DQN5A
.
--
benoit barthelet
http://pgp.mit.edu/pks/lookup?op=get&search=0xF150E01A72F6D2EE
euri10
on 4 Dec 2019
@euri10 so I have tried to eat memory and do some computations in a functions, called by the endpoint (async || executor || normally) -> seems to b alright.
I guess my use case is a bit more specific (using ctypes objects, numpy and lot of cpu). As I mentioned above, I am still profiling the custom lib once again - in the first experiments there were no leaks... if now also none -> then I will try to mock the whole chain... or I will need to do everything cpp, to avoid the mess with ctypes.
madkote
on 5 Dec 2019
Wouldn't surprise me if it was the combination of async and ctypes together causing issues.
I'm also interested if you can get a reproducible snippet demonstrating the issue.
dmontagu
on 6 Dec 2019
@euri10 @dmontagu thanks for comments and hints.
I have spent ~3days looking on the custom library with ctypes code - actually it is a mix of huge 3rd party C++ (community) and mine ctypes. Difficult to say, where the issue is. I do suspect ctypes and async, since the issue occurs only when using the library in async methods.
I have tested my C++ code also on simple web service in C - and was not able to reproduce mem leaks with >100 concurrent users...
So for me this is NOT the gunicorn and NOT fastapi issue. (actually, similar tests were done also with aiohttp).
Many Thanks for support!
madkote
on 11 Dec 2019
@madkote sorry to hear that you haven't been able to find the source of the issue, even if it isn't an issue with Gunicorn/Uvicorn/FastAPI.
If you are able to simply reproduce the issue in code you are comfortable sharing, I think it would be worth a post to bugs.python.org.
dmontagu
on 12 Dec 2019
@dmontagu hard to reprduce with 3rd party C++ code (and it is a monster). So I decided to have a small and brutal fix, while during xmas time I can provide a new implementation of the lib. If another way of implemention will hit same issue, then it makes sense to spend time on reproducing.
For now, lesson learned (IMHO) - avoid ctypes and async. I am also not sure who is owning memory in case with ctypes and how to control it. Example, pass a python list to ctypes object (e.g. for processing) -> who is responsible for this list? - gc, ctypes object...
bug in python would make sense, only I have full control what is 3rd party code does - and this is not simple, unfortunately.
As I said above, I have no issues with guni/uvi/fastapi - the issue is only on mine llb
madkote
on 12 Dec 2019
Yeah, I've never had good experience with ctypes -- I now go straight to Cython/PyBind11 for similar applications, and just deal with the slightly increased amount of boilerplate while writing bindings.
dmontagu
on 13 Dec 2019
I encountered the same problem, a endpoint defined with def and hit it again and again, memory leak will happen. but defined with async, it will not. Looking forward to the outcome of the discussion.
 FLming
on 26 Dec 2019
FLming
on 26 Dec 2019
@FLming Are you doing anything special with ctypes or other similar low level functionality?
Do you have a reproducible example we can play with to try to fix the issue? That would help a lot.
dmontagu
on 31 Dec 2019
@dmontagu I found the one of the reason, that is detectAndCompute. After investigation, I find this function in def instead of async def will cause memory leak.
BTW, I find only the AKAZE detector will happen memory leak. code just like:
detector = cv.AKAZE_create()
kpts, desc = detector.detectAndCompute(gray, mask)
maybe this bug is belong to opencv.
A small example is as follows:
import cv2 as cv
from fastapi import FastAPI
app = FastAPI()
@app.get("/test")
def feature_detect():
img = cv.imread("cap.jpg", 0)
detector = cv.AKAZE_create()
kpts, desc = detector.detectAndCompute(img, None)
return None
and I use ab to send requests.
FLming
on 4 Jan 2020
Yeah, hard to say, it wouldn't surprise me at all if OpenCV didn't play perfectly nice with threadpool calls.
You might try running the function in a subprocess or processpool (instead of a threadpool as fastapi does automatically for def functions) -- that should ensure memory gets cleaned up properly (and will do a better job of not blocking the server to boot, since I assume the detectAndCompute call is going to be compute-bound).
dmontagu
on 4 Jan 2020
@FLming if possible, create detectors (or similar outside of endpoints).
@dmontagu running in a process does not always help, because not everything is pickable (or very hard) - depending on details. outsourcing to a process helps, but is not ideal - either you have to spin new process per request or have manage queue for a worker process - both has pros and cons.
PS: Happy New Year!
madkote
on 7 Jan 2020
Yeah, in this case I suggested it specifically because it looked like the function involved would be compatible with a subprocess call.
There is a ProcessPool interface similar to ThreadPool that you can use very similarly to how run_in_threadpool works in starlette. I think that mostly solves the problems related to managing the worker processes. But yes, the arguments/return types need to be pickleable, so there are many cases where you wouldn't want to take this approach.
dmontagu
on 8 Jan 2020
Thanks for all the discussion here everyone! Thanks for the help @euri10 , @dmontagu for all the analysis, thanks @madkote for reporting back after your investigation. :cake:
If anyone still has an issue, the best way to check it would be with a small self-contained example that replicates it.
@MeteHanC, in the end, were you able to solve your problem?
 tiangolo
on 10 Feb 2020
tiangolo
on 10 Feb 2020
I just stopped using Python's multiprocessing pool. I merged the queries I wanted to execute concurrently and let my DB to parallelize the queries. Thanks @tiangolo and everyone here.
MeteHanC
on 20 Feb 2020
Something is eating up my RAM too. 🧟♂️Hard to catch and to reproduce.
 stefanondisponibile
on 2 Apr 2020
stefanondisponibile
on 2 Apr 2020
Something is eating up my RAM too. 🧟♂️Hard to catch and to reproduce.
what are you calling? if cython code is written in bad manner it might eat it memory.
madkote
on 2 Apr 2020
hey @madkote thanks for asking. That involves a request via requests and some scikit-learn / numpy operations on it, basically. I'll dig on them, if this appears to be the problem!
stefanondisponibile
on 2 Apr 2020
thanks for opening this issue, it was definitely useful.
On my end, I've resolved this by setting only 1 worker per cpu in Gunicorn and now the memory usage seems to be steady.
 vincentsarago
on 8 Apr 2020
vincentsarago
on 8 Apr 2020
Great, it seems this the issue was solved!
@MeteHanC may we close it now?
If anyone else is having other problems, please create a new issue so we can keep the conversation focused :nerd_face:
tiangolo
on 12 Apr 2020
I don't think this is solved but seems like we all found some work arounds. So I think it is up to you closing it @tiangolo
MeteHanC
on 12 Apr 2020
@dmontagu I found the one of the reason, that is detectAndCompute. After investigation, I find this function in
definstead ofasync defwill cause memory leak.
BTW, I find only theAKAZEdetector will happen memory leak. code just like:detector = cv.AKAZE_create() kpts, desc = detector.detectAndCompute(gray, mask)maybe this bug is belong to opencv.
A small example is as follows:
import cv2 as cv from fastapi import FastAPI app = FastAPI() @app.get("/test") def feature_detect(): img = cv.imread("cap.jpg", 0) detector = cv.AKAZE_create() kpts, desc = detector.detectAndCompute(img, None) return Noneand I use ab to send requests.
Update:
Now, I am using Ubuntu 20.04, and default python version is 3.8.2, this problem disappeared, but when I run this code with python 3.6.9 in docker container, this problem appeared again.
FLming
on 14 May 2020
seeing this on Ubuntu 18.0, python 3.7. 64cpu, workers maxed where I give this container 30x2+1(other cores used by other container pod and k8's integrations). mind-boggling and losing pods constantly. Optimal performance was around 8cpu on container optimized engine (GKE)
uvicorn app:app --host=0.0.0.0 --port=$APP_PORT --workers=$UV_WORKERS --no-access-log --loop="uvloop" --http="httptools"
 backnotprop
on 18 May 2020
backnotprop
on 18 May 2020
similar to @madkote (and im using no ctypes) gunicorn & flask see no issue
backnotprop
on 18 May 2020
@backnotprop try without gunicorn - uvcorn only
madkote
on 19 May 2020
@madkote hey I do... honestly think much of the issue with lack of cpu pinning in GKE currently
backnotprop
on 20 May 2020
hi all i can reproduce memory leak
from fastapi import FastAPI
import uvicorn
app = FastAPI()
@app.get("/")
def mm():
data = [0] * 1000000
data2 = [0] * 1000000
return {"message": "Hello World"}
#uvicorn.run(app, host="0.0.0.0", port=8080)
memory usage rises to about 700mb on request 1000
 bestend
on 27 May 2020
bestend
on 27 May 2020
Hi, I have write a simple test to validate this issue.
It seems that python3.8 fix this problem.
Initial Mem Usage
==========================================
fastapi-py37: 183.6MiB / 31.16GiB
fastapi-py38: 187.6MiB / 31.16GiB
==========================================
After 1000 Requests Mem Usage
==========================================
fastapi-py37: 6.943GiB / 31.16GiB
fastapi-py38: 386.4MiB / 31.16GiB
==========================================
Sample Code:
https://github.com/kevchentw/fastapi-memory-leak
 kevchentw
on 28 May 2020
kevchentw
on 28 May 2020
Some statistics for python3.7, python3.8, and async.
Initial Mem Usage
==========================================
fastapi-py37: 76.21MiB / 7.353GiB
fastapi-py38: 75.86MiB / 7.353GiB
fastapi-py37-async: 75.44MiB / 7.353GiB
fastapi-py38-async: 75.62MiB / 7.353GiB
==========================================
Run 1000 Requests....
==========================================
Run fastapi-py37
real: 0m16.632s; user 0m4.748s; system 0m2.855s
Run fastapi-py38
real: 0m15.319s; user 0m4.750s; system 0m2.722s
Run fastapi-py37-async
real: 0m21.276s; user 0m4.877s; system 0m2.823s
Run fastapi-py38-async
real: 0m22.568s; user 0m5.218s; system 0m2.935s
==========================================
After 1000 Requests Mem Usage
==========================================
fastapi-py37: 1.266GiB / 7.353GiB
fastapi-py38: 144.8MiB / 7.353GiB
fastapi-py37-async: 84.07MiB / 7.353GiB
fastapi-py38-async: 83.63MiB / 7.353GiB
==========================================
Hi everyone,
I just read the source code of fastAPI and test it myself. First of all, this should not be a memory leak issue, but the problem is if your machine has a lot of CPUs, it will occupy a lot of memory.
The only difference is in starlette.routing.py methodrequest_response()
async def run_endpoint_function(
    *, dependant: Dependant, values: Dict[str, Any], is_coroutine: bool
) -> Any:
    # Only called by get_request_handler. Has been split into its own function to
    # facilitate profiling endpoints, since inner functions are harder to profile.
    assert dependant.call is not None, "dependant.call must be a function"

    if is_coroutine:
        return await dependant.call(**values)
    else:
        return await run_in_threadpool(dependant.call, **values)


async def run_in_threadpool(
    func: typing.Callable[..., T], *args: typing.Any, **kwargs: typing.Any
) -> T:
    loop = asyncio.get_event_loop()
    if contextvars is not None:  # pragma: no cover
        # Ensure we run in the same context
        child = functools.partial(func, *args, **kwargs)
        context = contextvars.copy_context()
        func = context.run
        args = (child,)
    elif kwargs:  # pragma: no cover
        # loop.run_in_executor doesn't accept 'kwargs', so bind them in here
        func = functools.partial(func, **kwargs)
    return await loop.run_in_executor(None, func, *args)
If the your rest interface is not async, it will run in loop.run_in_executor, but starlette do not specify the executor here, so the default thread pool size should be os.cpu_count() * 5, my test machine has 40 cpus so I should have 200 threads in the pool. And after each request it will not release the object in these threads, unless the thread be reused by next request, which will occupy a lot of memory, but at the end it's not memory leak.
below is my test code if you want to reproduce it
import asyncio

import cv2 as cv
import gc
from pympler import tracker
from concurrent import futures

# you can change worker number here
executor = futures.ThreadPoolExecutor(max_workers=1)

memory_tracker = tracker.SummaryTracker()

def mm():
    img = cv.imread("cap.jpg", 0)
    detector = cv.AKAZE_create()
    kpts, desc = detector.detectAndCompute(img, None)
    gc.collect()
    memory_tracker.print_diff()
    return None

async def main():
    while True:
        loop = asyncio.get_event_loop()
        await loop.run_in_executor(executor, mm)


if __name__=='__main__':
    loop = asyncio.get_event_loop()
    loop.run_until_complete(main())
Even though it's not memory leak, I still think it's not a good implementation cuz it's sensitive to your cpu count and when you run large deep learning model in fastAPI, you will find it occupy a ton of memory. So I suggest could we make the thread pool size configurable?
If you are interested in my process reading the source code, pls refer to my blog and give me a like(https://www.jianshu.com/p/e4595c48d091)
Sorry for only write blogs in Chinese :)
 ZackJiang21
on 22 Jun 2020
ZackJiang21
on 22 Jun 2020
@dmontagu I found the one of the reason, that is detectAndCompute. After investigation, I find this function in
definstead ofasync defwill cause memory leak.
BTW, I find only theAKAZEdetector will happen memory leak. code just like:detector = cv.AKAZE_create() kpts, desc = detector.detectAndCompute(gray, mask)maybe this bug is belong to opencv.
A small example is as follows:import cv2 as cv from fastapi import FastAPI app = FastAPI() @app.get("/test") def feature_detect(): img = cv.imread("cap.jpg", 0) detector = cv.AKAZE_create() kpts, desc = detector.detectAndCompute(img, None) return Noneand I use ab to send requests.
Update:
Now, I am using Ubuntu 20.04, and default python version is 3.8.2, this problem disappeared, but when I run this code with python 3.6.9 in docker container, this problem appeared again.
Same problem here, have you found any solution? @dmontagu
 mihir135
on 2 Sep 2020
mihir135
on 2 Sep 2020
still got this problem when using fastapi with defining a router function with a model to run in. The RAM has continuous goes high.
the solution here maybe:
- try python3.8 (in which ThreadPoolExecutor has default worker number)
- using async def and loop.run_in_executor with a global ThreadPoolExecutor to run the model function
update: RAM consume change after change to python3.8
 lexee
on 7 Sep 2020
lexee
on 7 Sep 2020
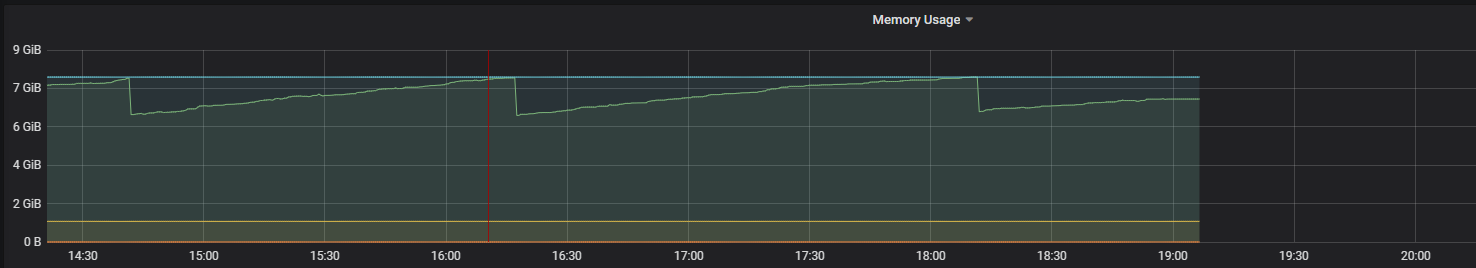
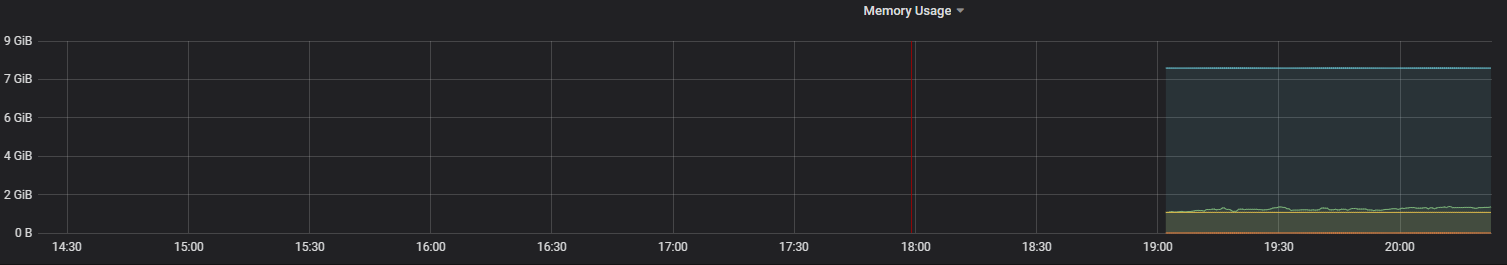
This comment https://github.com/tiangolo/fastapi/issues/596#issuecomment-647704509
An tensorflow example. Without setting max_workers=1 it grows up to 750MB without it stays around 370MB. (Intel(R) Core(TM) i7-6600U CPU @ 2.60GHz 4 x CPU)
import asyncio
import tensorflow as tf
import os
import gc
import psutil

from concurrent import futures

# you can change worker number here
executor = futures.ThreadPoolExecutor(max_workers=1)

tf_array = tf.zeros((1, 1024))
input = tf.keras.Input((1, 1024))
dense1 = tf.keras.layers.Dense(1024)(input)
dense2 = tf.keras.layers.Dense(1024)(dense1)
dense2 = tf.keras.layers.BatchNormalization()(dense2)
dense2 = tf.keras.layers.LeakyReLU()(dense2)
output = tf.keras.layers.Dense(1)(dense2)
model = tf.keras.Model(inputs=[input], outputs=[output])

export_path = "temp_export.h5"

model.save(export_path)


print(tf.__version__)
tf.compat.v1.logging.set_verbosity(tf.compat.v1.logging.ERROR)


def mm():
    model = tf.keras.models.load_model(export_path)
    del model
    gc.collect()
    tf.keras.backend.clear_session()


async def main():
    for i in range(1000):
        if i % 10 == 0:
            process = psutil.Process(os.getpid())
            print("used ", process.memory_info().rss / (1024.0 ** 2), "Mb")
        loop = asyncio.get_event_loop()
        # XXX use this and we have no "memory leak"x"
        await loop.run_in_executor(executor, mm)
        # await loop.run_in_executor(None, mm)


if __name__ == "__main__":
    loop = asyncio.get_event_loop()
    loop.run_until_complete(main())
 delijati
on 27 Nov 2020
delijati
on 27 Nov 2020
I also found this problem, when i use gunicorn+flask ,memory would increase fastly ,and my application on k8s paltform can handle 1000000 requests, how to solve this problem?
 ty2009137128
on 15 Dec 2020
ty2009137128
on 15 Dec 2020
Related issues
 iwoloschin
·
3Comments
iwoloschin
·
3Comments
 RogerioDosSantos
·
3Comments
RogerioDosSantos
·
3Comments
 DrPyser
·
3Comments
DrPyser
·
3Comments
 danielgtaylor
·
3Comments
danielgtaylor
·
3Comments
 devtud
·
3Comments
devtud
·
3Comments
Most helpful comment
Hi everyone,
I just read the source code of fastAPI and test it myself. First of all, this should not be a memory leak issue, but the problem is if your machine has a lot of CPUs, it will occupy a lot of memory.
The only difference is in
starlette.routing.pymethodrequest_response()If the your rest interface is not async, it will run in
loop.run_in_executor, but starlette do not specify the executor here, so the default thread pool size should be os.cpu_count() * 5, my test machine has 40 cpus so I should have 200 threads in the pool. And after each request it will not release the object in these threads, unless the thread be reused by next request, which will occupy a lot of memory, but at the end it's not memory leak.below is my test code if you want to reproduce it
Even though it's not memory leak, I still think it's not a good implementation cuz it's sensitive to your cpu count and when you run large deep learning model in fastAPI, you will find it occupy a ton of memory. So I suggest could we make the thread pool size configurable?
If you are interested in my process reading the source code, pls refer to my blog and give me a like(https://www.jianshu.com/p/e4595c48d091)
Sorry for only write blogs in Chinese :)