Evalml: Unit tests use up to 20GB of memory on circleci
Problem
While debugging intermittent test failures on PR #1410, @christopherbunn and I measured memory usage of the unit tests on circleci and found a complete end-to-end run can use up to 20GB at peak.
That's way more than I would have expected... the question is, why?
Observations
We ssh'ed into a circleci box running on main and ran the following using memory-profiler:
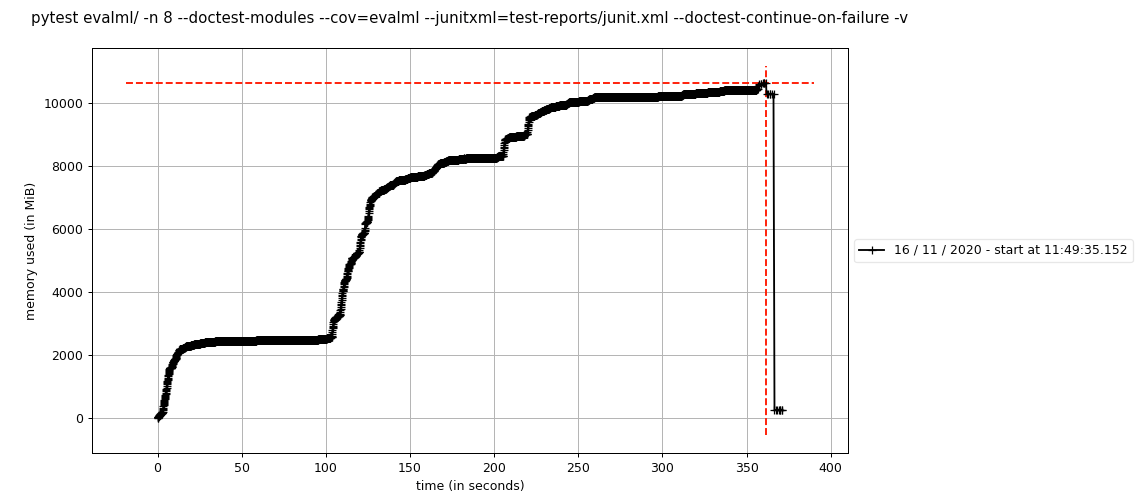
mprof run --include-children pytest evalml/ -n 8 --doctest-modules --cov=evalml --junitxml=test-reports/junit.xml --doctest-continue-on-failure -v
Which created the following plot, visible with mprof plot:

I ran this twice and got a similar plot, so the results appear to be consistent across runs.
This is dangerously close to the max memory allowed on the circleci worker size we're using. That's why we started looking into this -- on #1410, we saw that the memory usage went 5GB higher for some reason.
 dsherry
All 11 comments
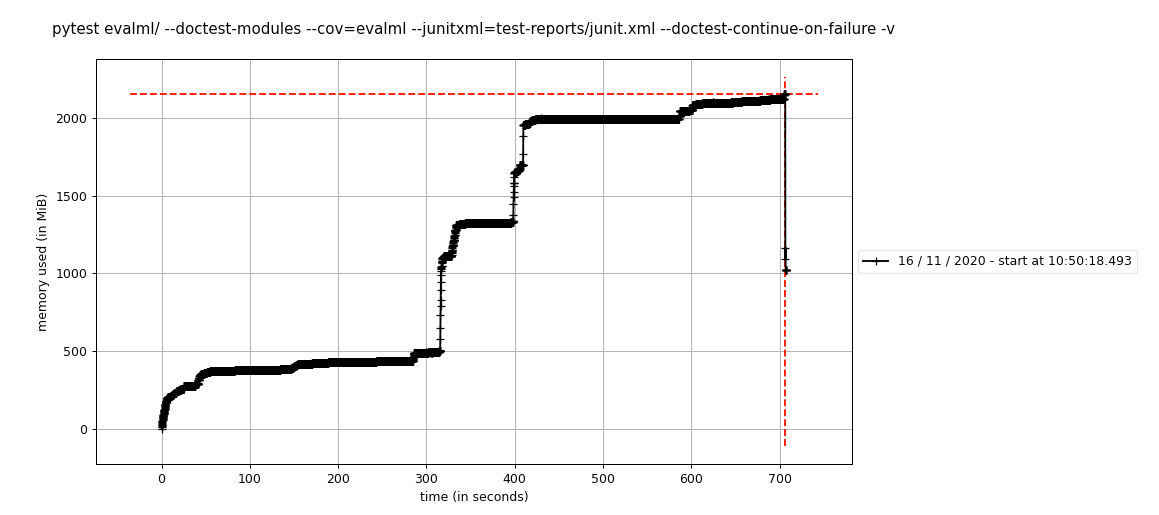
Ran this locally with only one worker and looks like the tests only use 2gb of memory compared to 10gb when I use 8 workers. So looks like this could be a combination of circle-ci and multiprocessing?
mprof run --include-children pytest evalml/ --doctest-modules --cov=evalml --junitxml=test-reports/junit.xml --doctest-continue-on-failure -v
mprof run --include-children pytest evalml/ -n 8 --doctest-modules --cov=evalml --junitxml=test-reports/junit.xml --doctest-continue-on-failure -v
 freddyaboulton
on 16 Nov 2020
freddyaboulton
on 16 Nov 2020
Discussion from standup with @rpeck @angela97lin @freddyaboulton @christopherbunn @ParthivNaresh
Hypothesis
Our test fixture is holding onto stuff which it shouldn't be, and that's causing the majority of the problem. But also, its possible there are a few leaks in automl itself.
Next steps
- Track down which tests are causing the largest memory increase
- Pick one of those tests, run it 20x with heap tracking (use
tracemalloc?), see where leak is - Goal: is leak in automl, or in pytest / test harness?
dsherry
on 16 Nov 2020
@rpeck @dsherry @christopherbunn and I have looked into this and here are is a summary of what we know so far:
A lot of the spikes we see in the
memory-profileplots are coming from imports as opposed to the unit tests. ImportingAutoMLSearchis ~120 MB, for example. When we set-n 8in the pytest command, the memory footprint from the imports is multiplied by 8, since each subprocess has to have everything imported.That being said, there are some unit tests that have a large memory footprint. For example, the automl test
test_max_batches_works, runs 20 batches with ensembling. Even though we mock fit and score, the memory profiler shows that all the calls to_automl_algorithm.add_result(....)amount to 27 mb of memory! We should go through our tests to see how much memory they use and see if there are ways of reducing it without compromising the test quality.We're still not sure if there is a memory leak or not. Running a simple program that creates a large list and then deletes it through memory-profiler shows a monotonic increase in memory that looks like a step-function. So we can't trust that a monotonic increase in memory during automl, as reported by memory-profiler, is indicative of a leak. If anything, I think this just means we should use
tracemallocto see how memory is allocated/deallocated on subsequent runs of the same program.
For the time being, we're seeing if decreasing the parallelism in pytest from 8 to 4 in circle-ci, or using dedicated workers, will unblock #1410.
We'll keep this issue open. I think there's still a lot left to do in order to understand why the changes in that branch make our memory problems so much worse as well as seeing if we can be more memory-conscious in our tests.
Feel free to add anything I've missed!
freddyaboulton
on 18 Nov 2020
Yep! One thing I'd add is that in our analyses, we forgot about garbage collection 😆 the fact that the memory claimed by python is monotonically increasing isn't necessarily a problem, because a bunch of the memory reported by mprof could be state which hasn't yet been deallocated by garbage collection.
@rpeck had been looking into measuring the change in memory before vs after each unit test. This would tell us which tests had the largest increase, meaning we can focus on profiling those tests and seeing where the biggest allocations are coming from. I hope we can continue that work.
A related idea: write a post fixture for pytest which runs after every test and calls gc.collect() to force garbage collection. If we noticed a steady increase in memory across test runs, that would be evidence of a leak; if we saw memory was constant across runs on average, that would indicate there's no leak.
dsherry
on 19 Nov 2020
I would be curious to know if the high memory usage is a result of adding Woodwork, and using DataTables. Perhaps should track the memory usage of the unit tests version to version?
 gsheni
on 19 Nov 2020
gsheni
on 19 Nov 2020
@gsheni That would be a good idea! At least for the automl tests, I think there's more at play than just woodwork. When I profiled search, the woodwork conversion only used up ~0.5MB whereas we were seeing some unit tests use ~80MB. It's possible some of the pipelines/components are doing unnecessary conversions between ww and pandas so I think we definitely need to dig further.
One thing we noticed is that importing woodwork requires ~60MB mainly because of sklearn and pandas. Not sure what could be done about this but wanted to bring this to your attention. Happy to file something in the ww repo!
Line #    Mem usage    Increment  Occurences   Line Contents
============================================================
     3     37.8 MiB     37.8 MiB           1   @profile
     4                                         def ww_imports():
     5     47.3 MiB      9.5 MiB           1       import numpy
     6     65.8 MiB     18.5 MiB           1       import pandas
     7     66.4 MiB      0.6 MiB           1       import click
     8     93.2 MiB     26.8 MiB           1       import sklearn
     9     96.3 MiB      3.2 MiB           1       import pyarrow
@freddyaboulton Perhaps ww is importing larger portions of these libraries than necessary?
It'd be great to have a tool that optimized imports by finding the transitive closure of all the pieces of the library that are actually used...
 rpeck
on 20 Nov 2020
rpeck
on 20 Nov 2020
@freddyaboulton Perhaps
wwis importing larger portions of these libraries than necessary?It'd be great to have a tool that optimized imports by finding the transitive closure of all the pieces of the library that are actually used...
This is the only sklearn import in Woodwork: from sklearn.metrics.cluster import normalized_mutual_info_score. Not sure if there is anything that we can do to scale that back.
As for pandas, we are typically importing the whole library, but that's such a big piece of the Woodwork code, I'm not sure we can easily scale that back either, but can look into it more if it's needed.
 thehomebrewnerd
on 20 Nov 2020
thehomebrewnerd
on 20 Nov 2020
Thanks for the explanation @thehomebrewnerd ! Yea so it looks like importing a submodule will import the parent module automatically. Our large imports are making our memory problem worse but they are definitely on the bottom of the totem pole of action items we need to look into on the evalml side.
I don't think any action is needed from ww yet - I just wanted to bring this to your attention! That being said, bringing in all of sklearn just for mutual info seems excessive. Maybe we can use an alternative impl or defer the import to runtime but we certainly don't need to do that now!
freddyaboulton
on 20 Nov 2020
@thehomebrewnerd @freddyaboulton We could have an inline import for the sklearn import (so it only runs when you call the mutual info function).
I have seen us explicitly do this in a few in other libraries. We generally do it to avoid circular imports. It would feel weird to do it just to save memory...
gsheni
on 20 Nov 2020
We noticed that we can shave 1.5gb from just the automl tests (almost half!) by manually setting n_jobs=1 for all estimators used by automl (plots below). We verified that the value of n_jobs is a factor only in the few automl tests that don't mock fit and score. Based on this, we have come up with the current plan:
- for each component which accepts n_jobs as a parameter (i.e. the sklearn-based estimators), make sure we have one unit test which sets
n_jobs=-1, to verify that works properly for that component. - for all other unit tests which don’t mock the underlying
fit, setn_jobs=1for all components to avoid memory and threading issues - make sure that in looking glass we’re running with
n_jobs=-1, which i believe we currently are since the default value ofn_jobsfor relevant estimators is -1
Hopefully once this is done, we'll see some nice improvements upon the overall memory footprint of the unit tests!


freddyaboulton
on 24 Nov 2020
Related issues
freddyaboulton
·
3Comments
 SydneyAyx
·
3Comments
SydneyAyx
·
3Comments
 angela97lin
·
4Comments
dsherry
·
5Comments
angela97lin
·
4Comments
dsherry
·
5Comments
 bchen1116
·
4Comments
bchen1116
·
4Comments