Esmvaltool: Development help tools collection
Not a real feature request, but:
Do we want to have a possibility to share scripts or commands to make development easier (read: analyze the output on memory usage, etc.)?
I'll just add some examples here:
 BenMGeo
All 5 comments
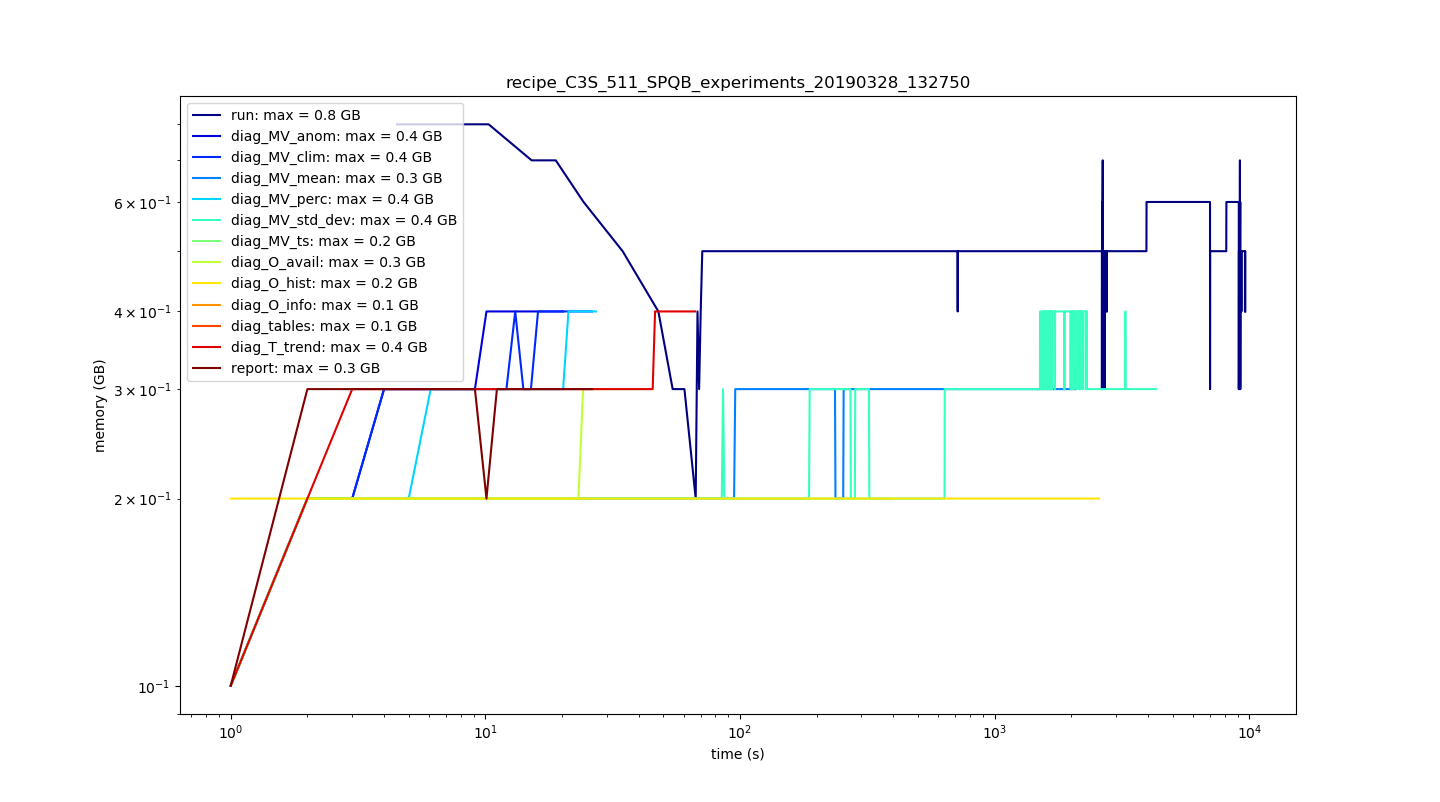
Use case: In diagnostic development, you sometimes want to optimize your diagnostics on memory usage. Therefore, you do not want to, repeatedly, look into directory structures and switch back and forth. It usually is easier to compare based on a single multi-line plot.
Producing a multi-line plot to analyze memory usage of single diagnostics:
#!/usr/bin/env python3
# -*- coding: utf-8 -*-
"""
Created on Fri Mar 22 09:46:17 2019

@author: bmueller
"""

# multiline plots for all specified textfiles in a dir structure

# name of the recipe directory in workdir
recipe = "recipe_XXXXX"
# the workdir specified for ESMValTool added to the recipe directory
recipedir = "/path/to/work/" + recipe
num_diags = 13 # the number of diagnostics you have in your recipe

from os import walk, sep
from pathlib import Path
import pandas as pd
import matplotlib.pyplot as plt
import matplotlib.pylab as pl
import numpy as np

# get all resource_usage.txt files
f = []
for (dirpath, _, _) in walk(recipedir):
    resource = dirpath + sep + "resource_usage.txt"
    if Path(resource).is_file():
        f.append(resource)

# have a list for the read in data from resource_usage.txt files
mem_list = []

# this loop saves only memory usage in GB and the real time in seconds
# could be changed for CPU usage, etc.
for file in f:
    with open(file,'r') as rf:
        table = pd.read_csv(rf, sep ='\t')
        table = table.drop(columns=["Date and time (UTC)",
                                    "CPU time (s)",
                                    "CPU (%)",
                                    "Memory (%)",
                                    "Disk read (GB)",
                                    "Disk write (GB)"])
        mem_list.append(table)

# define a colormap based on the number of diags specified above
my_cmap = pl.cm.jet(np.linspace(0,1,num_diags))

# create a simple lineplot from all pandas data frames from resource_usage.txt
# with a legend that shows the diagnostic names and the maximum used memory
fig = plt.figure(figsize=(20,10))
ax = fig.add_subplot(1,1,1)
for idx,df in enumerate(mem_list):
    ax.plot('Real time (s)',
            'Memory (GB)',
            data=df,
            label=f[idx].split("/")[-2] +
                ": max = " + str(np.max(df['Memory (GB)'])) + " GB",
            color=my_cmap[idx]
            )

# I prefer logscale to see the runtime
ax.set_xscale("log")
ax.set_yscale("log")
ax.set_title(recipe)
plt.xlabel("time (s)")
plt.ylabel("memory (GB)")
plt.legend()

# options to make them look nice
plt.tight_layout()
plt.autoscale()


plt.show()
This is how it looks:
BenMGeo
on 29 Mar 2019
Use case: In diagnostic development, you sometimes want to optimize your diagnostics on memory usage. For a fast check if your diagnostic exceeds the backend's memory, you only want to see the maximum memory usage of your call of ESMValTool.
You can run your recipe with and without your diagnostics with the embracing command time (usually standard command):
/usr/bin/time -f "\t%M Max Resident Set Size (Kb)" esmvaltool -c ./esmvaltool/config.yml ./esmvaltool/recipes/recipe_XXXXX.yml
... and you will get a single information back, or you use:
/usr/bin/time -v esmvaltool -c ./esmvaltool/config.yml ./esmvaltool/recipes/recipe_XXXXX.yml
for a more detailed information.
BenMGeo
on 29 Mar 2019
We have various such tools in esmvaltool/utils. The script would need some cleanup though, at the very least you would need to make sure it can be imported without executing it. Adding a command line parser would also be nice.
If it's just a one liner, the developer documentation might be a better place, maybe create a tips and tricks section or something..
 bouweandela
on 29 Mar 2019
bouweandela
on 29 Mar 2019
I did not find any post/meta analyzers there. Therefore, the question.
Great, so I will add these, when I improved on style, etc.
BenMGeo
on 29 Mar 2019
Looks like your question has been answered.
Closing this.
 mattiarighi
on 19 Dec 2019
mattiarighi
on 19 Dec 2019
Related issues
 bascrezee
·
5Comments
bascrezee
·
5Comments
 jhardenberg
·
5Comments
bouweandela
·
4Comments
jhardenberg
·
5Comments
bouweandela
·
4Comments
 valeriupredoi
·
4Comments
valeriupredoi
·
4Comments
valeriupredoi
·
4Comments
valeriupredoi
·
4Comments