Esbuild: Safari deopt with a large ESBuild bundle
This issue is JFYI. It feels more like a Safari issue than a ESBuild one, but maybe you or someone else (a fellow WebKit engineer?) will find it useful.
AFAIK @koenbok already briefly mentioned this issue in a DM to you a month ago.
Problem
We at Framer stumbled upon a weird Safari deoptimization. If we bundle all our code into a single huge bundle, Safari suddenly becomes 6-8x slower at executing that bundle.
(We _have to_ build our code as a single huge bundle due to #399. We're only using ESBuild for local development right now, so the bundle size is not an issue.)
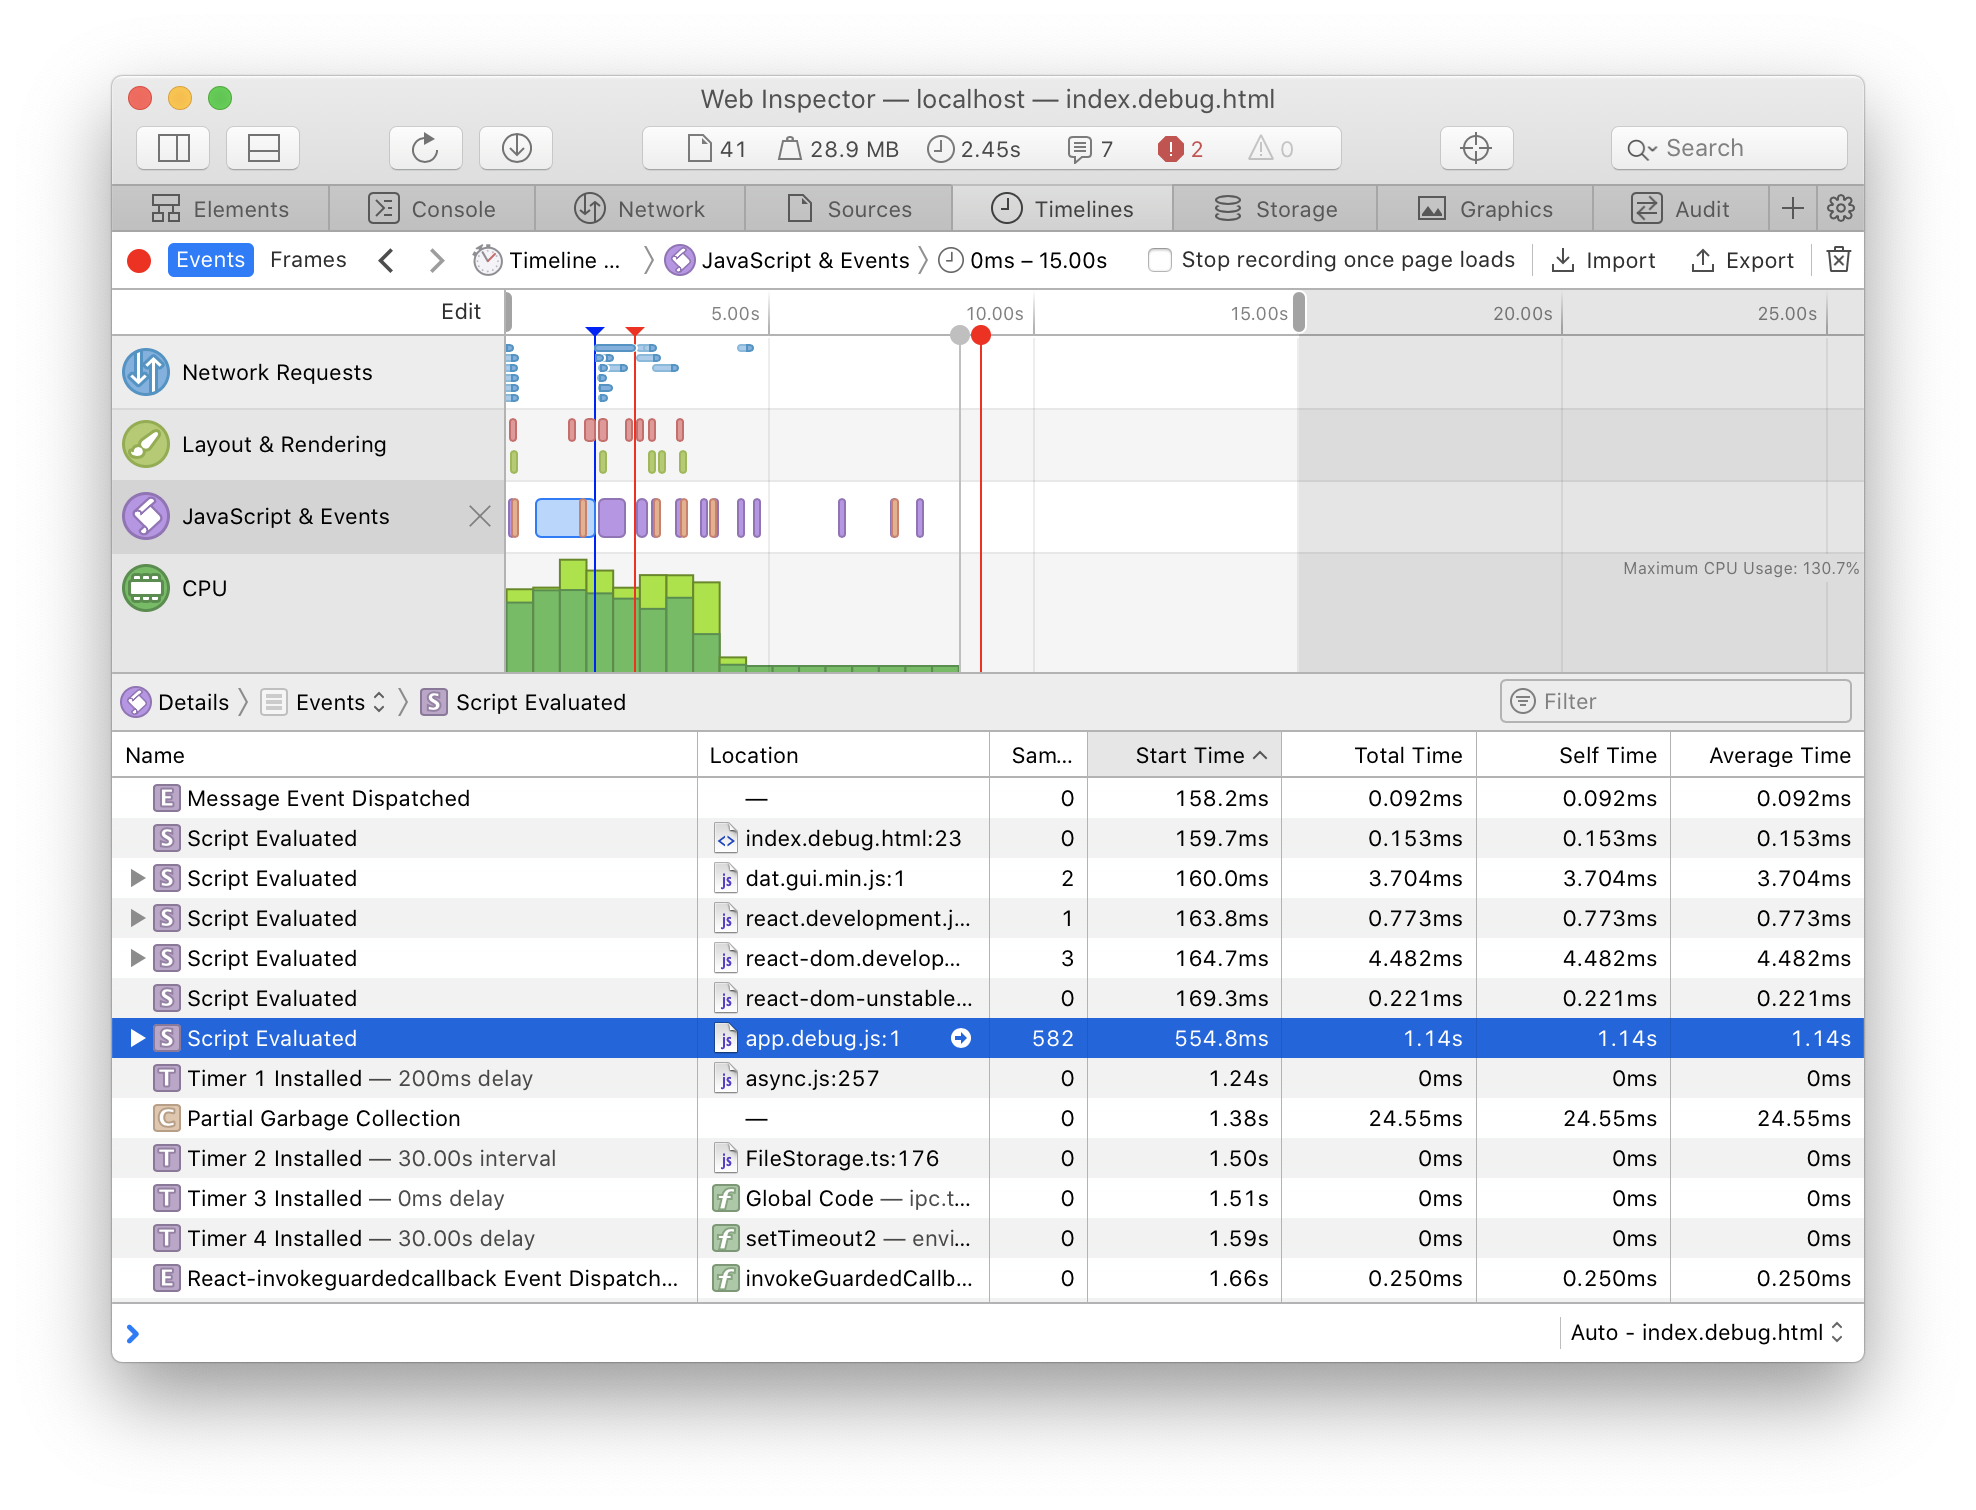
Here's how bundle execution looks when the issue reproduces:
| The issue reproduces | The issue doesn’t reproduce |
| --------------- | ------------------- |
| The bundle takes 8 seconds to execute after it loads:
 | The bundle takes 1.1 seconds to execute after it loads:
  |
|
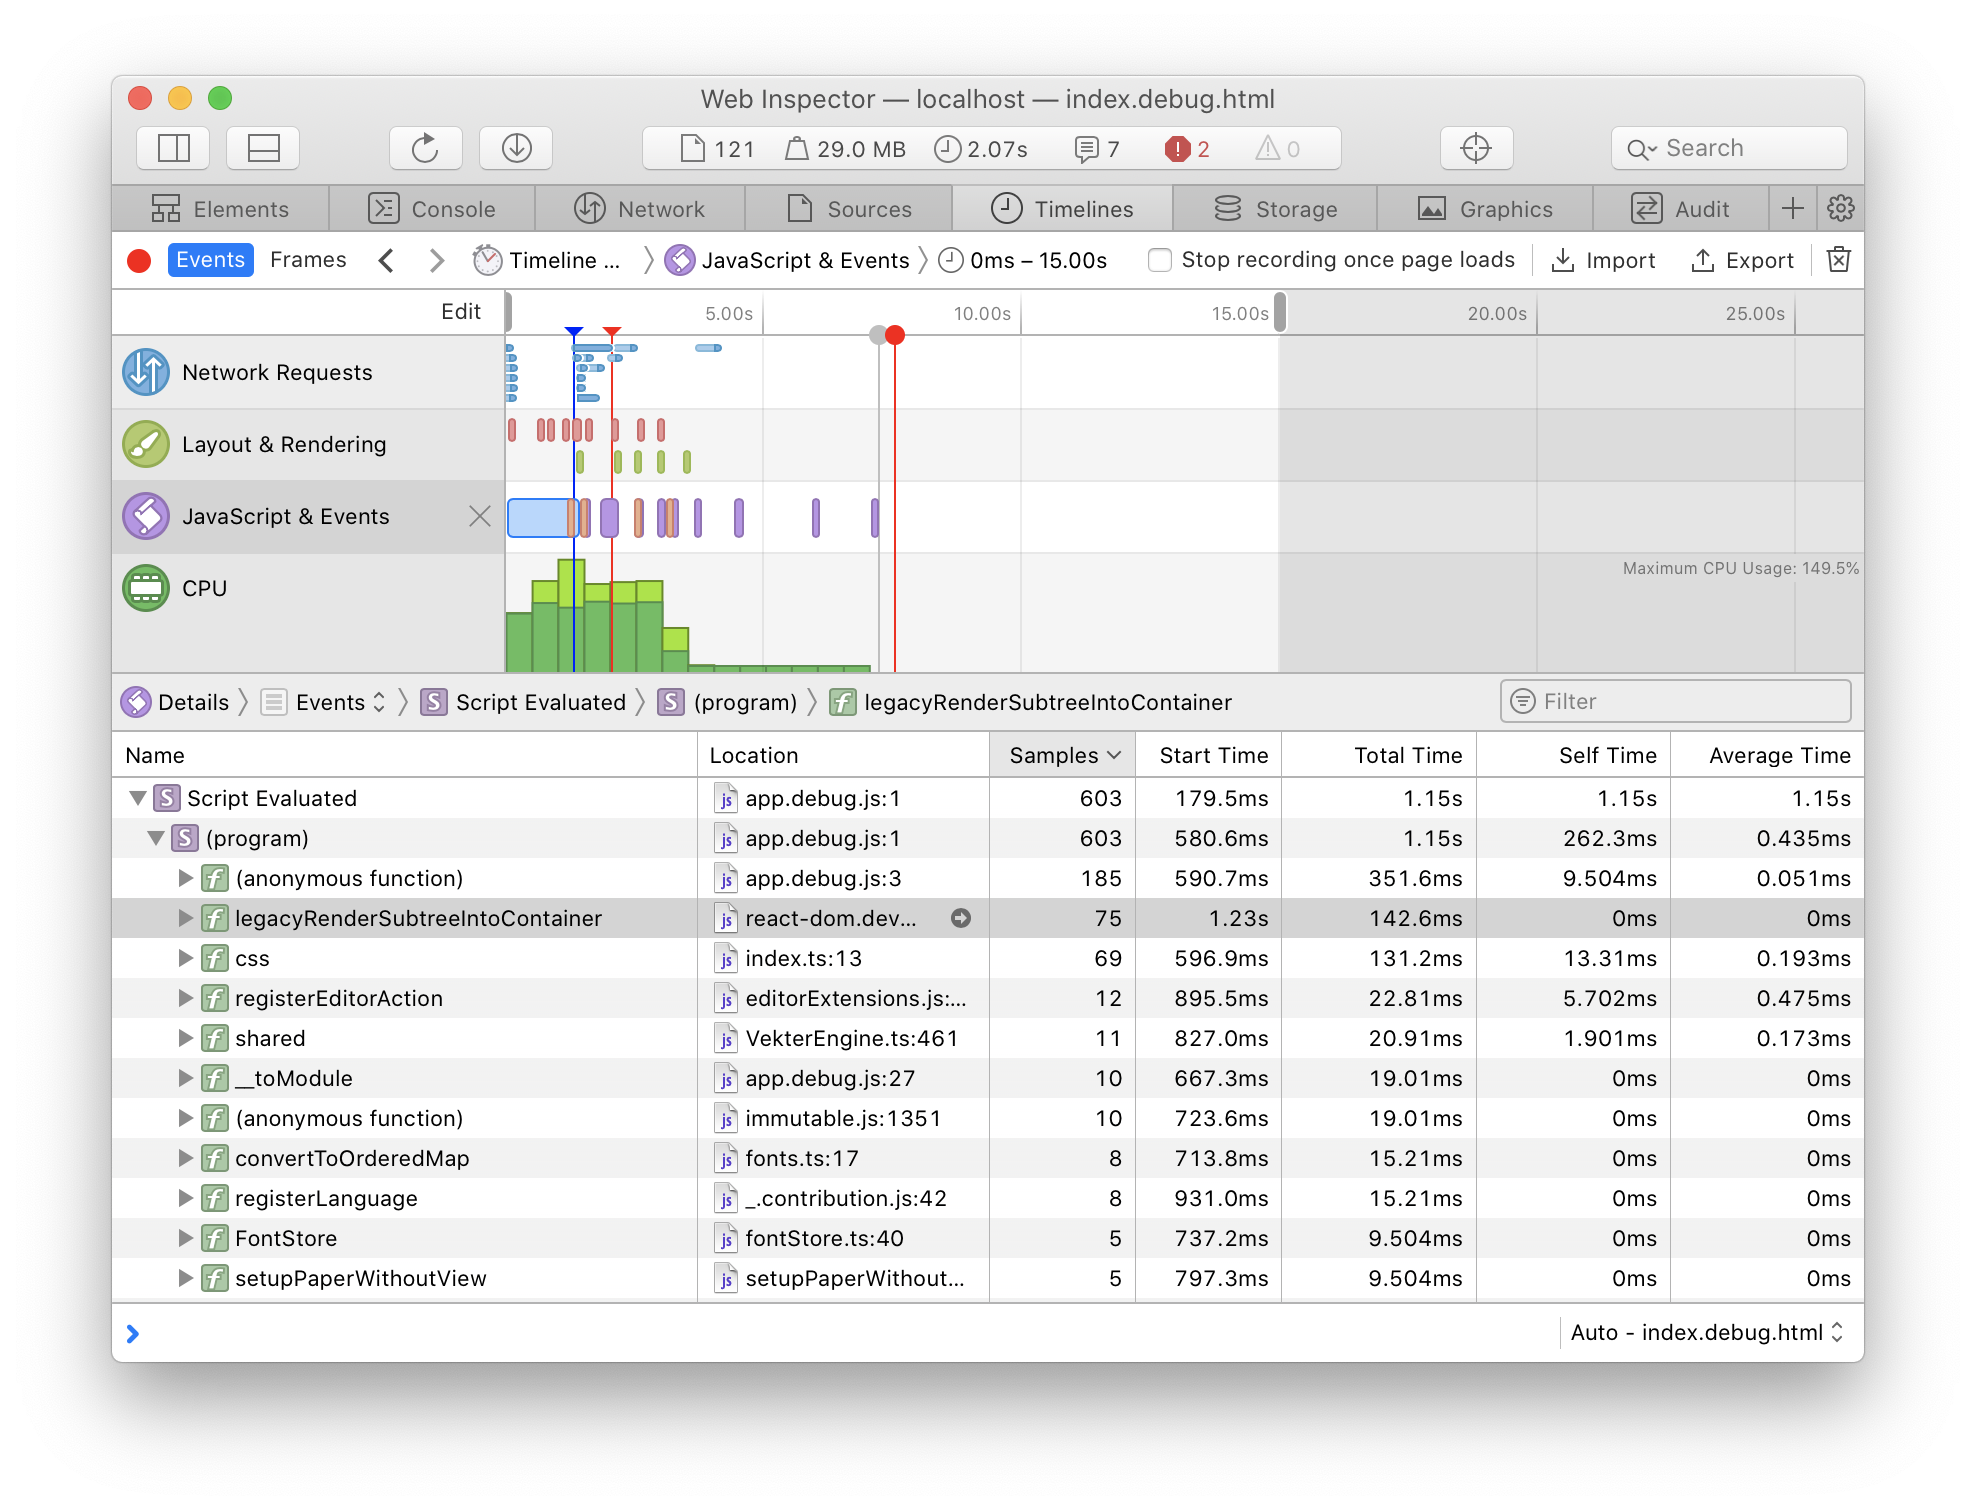
If you look deeper into the bundle execution trace, there is no single item that takes 7 extra seconds. Instead, it feels like every function suddenly becomes several times slower. Compare “Samples” and “Total time” for identical rows:
| The issue reproduces | The issue doesn’t reproduce |
| --------------- | ------------------- |
|  |
|  |
|
Repro
I didn't manage to find a minimal example that would reproduce this issue :( Still, the issue reliably happens with our codebase.
The issue reproduces with the following ESBuild config:
build({
    // This gives ~7 entry points
    entryPoints: fs
        .readdirSync(path.resolve(__dirname, "entrypoints"))
        .map(fileName => path.resolve(__dirname, "entrypoints", fileName)),
    outdir: WATCH_OUTPUT_PATH,
    bundle: true,
    target: "es2019",
    loader: {
        ".raw.tsx": "text",
        ".tmLanguage": "text",
        ".png": "file",
        ".svg": "file",
        ".css": "text",
    },
    tsconfig: path.resolve(__dirname, "tsconfig.esbuild.json"),
    external: [
        "https",
    ],
    sourcemap: true,
    define: {
        "process.env.PLATFORM": JSON.stringify(PLATFORM),
        "process.env.BUILD_TYPE": JSON.stringify(BUILD_TYPE),
        "process.env.NODE_ENV": JSON.stringify(BUILD_TYPE),
        "process.env.BUILD_NAME": JSON.stringify("vekter"),
        "process.env.BUILD_HASH": JSON.stringify(GIT_HASH),
        "process.env.VERSION": JSON.stringify(isProduction ? GIT_HASH : `${GIT_HASH}-dev`),
        "process.env.EXPERIMENTS": `"${escape(JSON.stringify(EXPERIMENTS))}"`,
        "process.env.DEBUG_HYDRATION": JSON.stringify(DEBUG_HYDRATION),
        "process.env.PROMISE_QUEUE_COVERAGE": "false",
        "require.include": "undefined",
        "require.resolveWeak": "undefined",
        "process.platform": "'linux'",
        global: "window",
    },
})
The issue occurs in Safari 12 and 14 (all versions I tested in). Enabling minification doesn’t help.
The issue doesn't reproduce:
- if the bundle was built with
--format=esmbut loaded using a regular<script>. (this setup simply removes an IIFE wrapper around the bundle code)
- this is the workaround we went with
- but: if the
--format=esmbundle is loaded using a<script type="module">, the issue will reproduce
- if you load the page and then refresh it once (sometimes twice)
- I guess some Safari optimizations kick in and use information from previous runs to speed up the execution?
- but if you refresh the page with DevTools → Timeline open, the issue will reproduce
- I guess the Timeline tab disables these Safari optimizations
- if the bundle was built using webpack
- I suppose webpack structures the bundle a bit differently, and that prevents the deopt from occurring
- if you enable code splitting (despite #399)
- apparently, splitting the whole bundle across tens of files fixes the deopt
Possible explanation
My only hypothesis (which might be totally off) is that this is related to the number of top-level definitions:
- The bundle has 13K top-level definitions (variables, constants, functions, and classes)
- The issue occurs when these 13K definitions are wrapped into a) an IIFE or b) an ES module. But it doesn’t occur if these 13K definitions live at the top level of the plain
<script>tag (and, consequently, become available globally) - Perhaps the way definitions inside an IIFE/a ES module are stored is different from the way all global definitions are stored?
If the former approach is not optimized for storing 13K items, this might increase the lookup time for every name in the bundle – and explain why every function suddenly gets slower.
Chrome
For the sake of completeness: in Chrome (which doesn’t have this issue), the bundle always takes ~1s to execute:

All 11 comments
Wow, that is crazy. Thanks for this very thorough experience report. I think your suspicion about JIT issues with a large number of local variables is correct. This sure is unfortunate.
I think I can reproduce this behavior on Figma's code base too. I've never noticed because we use Chrome pretty much exclusively for development.
I'm assuming that when you're talking about a Webpack build it's one with scope hosting (a.k.a. module concatenation) turned off. Is that right? Does the problem reproduce with Webpack as well if you turn on scope hosting/module concatentation?
I was able to speed things up dramatically in Safari for my test case by disabling scope hosting in esbuild. There's no setting for this so I did this instead:
diff --git a/internal/bundler/linker.go b/internal/bundler/linker.go
index 8540aa96..ed90ff18 100644
--- a/internal/bundler/linker.go
+++ b/internal/bundler/linker.go
@@ -384,8 +384,7 @@ func newLinkerContext(

                        // Also associate some default metadata with the file
                        repr.meta = fileMeta{
-                               cjsStyleExports: repr.ast.HasCommonJSFeatures() || (repr.ast.HasLazyExport && (c.options.Mode == config.ModePassThrough ||
-                                       (c.options.Mode == config.ModeConvertFormat && !c.options.OutputFormat.KeepES6ImportExportSyntax()))),
+                               cjsStyleExports:          sourceIndex != runtime.SourceIndex,
                                partMeta:                 make([]partMeta, len(repr.ast.Parts)),
                                resolvedExports:          resolvedExports,
                                isProbablyTypeScriptType: make(map[js_ast.Ref]bool),
Basically that just treats every file as a CommonJS file, which wraps it in a closure. Can you try that patch on your machine? What happens then?
By the way, I would not recommend shipping a build where module-level variables are global without a wrapper (the esm without module approach). Probably the most insidious bug I've ever had to deal with was one where a minified variable in our code collided with the global ga Google analytics variable and caused a rare timing-dependent loading failure. This happened because emscripten does not use a closure by default. I think that took at least a week to narrow down.
This is a fascinating case. I wonder if @constellation might have some insight here into the webkit scope handling slowdown.
Probably the most insidious bug I've ever had to deal with was one where a minified variable in our code collided with the global ga Google analytics variable and caused a rare timing-dependent loading failure.
I disagree quite strongly with this advice. If the minified code contained a ga reference, the minifier is responsible for ensuring global refs are retained. That would make it a minifier bug, which are insidious however they happen.
That is of course assuming the script was in strict mode.
These might be relevant:
https://bugs.webkit.org/show_bug.cgi?id=212962: 4x slow execution slowdown when comparing the same codebase targeting ES2015
https://bugs.webkit.org/show_bug.cgi?id=199866: WebKit-based browser hangs while parsing large JS file
The suggested workaround here was to replace
let/constwithvar. It sounds like maybe their tracking of temporal dead zones is part of the problem? @iamakulov do you know if most of the 13k variables arelet/constinstead ofvar?
I disagree quite strongly with this advice. If the minified code contained a ga reference, the minifier is responsible for ensuring global refs are retained. That would make it a minifier bug, which are insidious however they happen.
We load multiple scripts in one page. The Google analytics tracker was a separate script.
We load multiple scripts in one page. The Google analytics tracker was a separate script.
Because ES modules are strict by default, var ga at the top scope is not a global declaration. So I'm just not sure how a conflict could possibly happen without being a minifier bug.
I'm pretty sure that using var instead of let/const speeds up Figma in Safari quite a bit. Here's what I used to test it (only changes top-level ones to avoid most semantic mismatches):
diff --git a/internal/js_printer/js_printer.go b/internal/js_printer/js_printer.go
index 41b29ec1..9dfb73db 100644
--- a/internal/js_printer/js_printer.go
+++ b/internal/js_printer/js_printer.go
@@ -3048,6 +3048,9 @@ func Print(tree js_ast.AST, symbols js_ast.SymbolMap, r renamer.Renamer, options

        for _, part := range tree.Parts {
                for _, stmt := range part.Stmts {
+                       if local, ok := stmt.Data.(*js_ast.SLocal); ok {
+                               local.Kind = js_ast.LocalVar
+                       }
                        p.printStmt(stmt)
                        p.printSemicolonIfNeeded()
                }
This change speeds up my test case from ~2200ms to ~650ms. The CommonJS transform is still faster at 350ms. Potentially because we use a lot of classes which still need TDZ handling when they are top-level?
Edit: I confirmed that replacing class Foo with var Foo = class fixes that issue too, so the loading time is now ~220ms. Literally 10x faster.
Because ES modules are strict by default, var ga at the top scope is not a global declaration. So I'm just not sure how a conflict could possibly happen without being a minifier bug.
The solution described above configures the bundler to target a module, but then loads it as a script in the browser instead of loading it as a module. That way all of the module-level variables are global.
I added a flag called --avoid-tdz to do the transformation I described above. Details are in the release notes. It's not enabled by default because it changes the semantics of the code, although I suspect the semantic change is probably fine for many real-world projects. I plan to release it later tonight.
Do you have a full example of a reproducing test case? Would like to look at improving this in JSC.
Do you have a full example of a reproducing test case? Would like to look at improving this in JSC.
@saambarati that's great! Thanks so much for offering to help. I'd love to help get this fixed. I do have a way to reproduce this, and I can send it to you. What's the best way to reach you? Maybe I can email it to you?
@evanw If it's able to be shared publicly, then linking it from a bug report on bugs.webkit.org would be best. Failing that, getting it to @saambarati in a private way would be good.
Sure. It should be ok to share publicly once I clean it up a bit. I'll work on that.
Ok I just posted the repro to https://bugs.webkit.org/show_bug.cgi?id=199866. Really I hope that helps. Please let me know if there's anything else I can do to help.
Also: Hello HN and Reddit! Just wanted to say that JavaScriptCore is an engineering marvel and I have deep respect for everyone on that team. All software has bugs and I can confidently say from my experience writing esbuild that JavaScript is extremely messy to implement with an unbelievable number of edge cases. V8 has also had crazy performance cliffs so something like this is not unusual, and doesn't say anything about JSC vs. V8. Let's not turn this into a meme. It's awesome that people from JavaScriptCore are reaching out and helping get this fixed. Props to the JSC team.
Most helpful comment
Ok I just posted the repro to https://bugs.webkit.org/show_bug.cgi?id=199866. Really I hope that helps. Please let me know if there's anything else I can do to help.
Also: Hello HN and Reddit! Just wanted to say that JavaScriptCore is an engineering marvel and I have deep respect for everyone on that team. All software has bugs and I can confidently say from my experience writing esbuild that JavaScript is extremely messy to implement with an unbelievable number of edge cases. V8 has also had crazy performance cliffs so something like this is not unusual, and doesn't say anything about JSC vs. V8. Let's not turn this into a meme. It's awesome that people from JavaScriptCore are reaching out and helping get this fixed. Props to the JSC team.