The nodeos runned on a Ubuntu 18.04 x64 system, and killed by system for out of memory.
lsb_release
root@mongorpc:/opt/eos# lsb_release -a
No LSB modules are available.
Distributor ID: Ubuntu
Description:    Ubuntu 18.04 LTS
Release:    18.04
Codename:   bionic
meminfo
root@mongorpc:/opt/eos# cat /proc/meminfo
MemTotal:       49454828 kB
MemFree:        48074568 kB
MemAvailable:   48632444 kB
Buffers:          199464 kB
Cached:           789452 kB
SwapCached:        14400 kB
Active:           421604 kB
Inactive:         624172 kB
Active(anon):      38816 kB
Inactive(anon):    22404 kB
Active(file):     382788 kB
Inactive(file):   601768 kB
Unevictable:        5408 kB
Mlocked:            5408 kB
SwapTotal:       4039676 kB
SwapFree:        3977916 kB
Dirty:                32 kB
Writeback:             0 kB
AnonPages:         54496 kB
Mapped:            61032 kB
Shmem:               324 kB
Slab:             180176 kB
SReclaimable:     107256 kB
SUnreclaim:        72920 kB
KernelStack:        3168 kB
PageTables:         5840 kB
NFS_Unstable:          0 kB
Bounce:                0 kB
WritebackTmp:          0 kB
CommitLimit:    28767088 kB
Committed_AS:     444440 kB
VmallocTotal:   34359738367 kB
VmallocUsed:           0 kB
VmallocChunk:          0 kB
HardwareCorrupted:     0 kB
AnonHugePages:         0 kB
ShmemHugePages:        0 kB
ShmemPmdMapped:        0 kB
CmaTotal:              0 kB
CmaFree:               0 kB
HugePages_Total:       0
HugePages_Free:        0
HugePages_Rsvd:        0
HugePages_Surp:        0
Hugepagesize:       2048 kB
DirectMap4k:     1789820 kB
DirectMap2M:    48541696 kB
DirectMap1G:     2097152 kB
LowMem
root@mongorpc:/opt/eos# free -l
              total        used        free      shared  buff/cache   available
Mem:       49454828      281772    48077264         324     1095792    48634792
Low:       49454828     1377564    48077264
High:             0           0           0
Swap:       4039676       61760     3977916
And it was killed by system for out of memory, below is log:
out of memory log
Aug  8 06:41:29 mongorpc kernel: [1344088.235127] audit: type=1400 audit(1533681689.584:29): apparmor="STATUS" operation="profile_replace" info="same as current profile, skipping" profile="unconfined" name="/usr/bin/lxc-start" pid=20080 comm="apparmor_parser"
Aug  8 06:41:29 mongorpc kernel: [1344088.388569] audit: type=1400 audit(1533681689.736:30): apparmor="STATUS" operation="profile_replace" profile="unconfined" name="/usr/bin/man" pid=20076 comm="apparmor_parser"
Aug  8 06:41:29 mongorpc kernel: [1344088.389648] audit: type=1400 audit(1533681689.736:31): apparmor="STATUS" operation="profile_replace" profile="unconfined" name="man_filter" pid=20076 comm="apparmor_parser"
Aug  8 06:41:29 mongorpc kernel: [1344088.391551] audit: type=1400 audit(1533681689.740:32): apparmor="STATUS" operation="profile_replace" profile="unconfined" name="man_groff" pid=20076 comm="apparmor_parser"
Aug  8 06:41:29 mongorpc kernel: [1344088.398041] audit: type=1400 audit(1533681689.744:33): apparmor="STATUS" operation="profile_replace" info="same as current profile, skipping" profile="unconfined" name="/usr/sbin/tcpdump" pid=20078 comm="apparmor_parser"
Aug  8 06:41:29 mongorpc kernel: [1344088.515686] audit: type=1400 audit(1533681689.864:34): apparmor="STATUS" operation="profile_replace" profile="unconfined" name="/usr/lib/snapd/snap-confine" pid=20074 comm="apparmor_parser"
Aug  8 06:41:29 mongorpc kernel: [1344088.539703] audit: type=1400 audit(1533681689.888:35): apparmor="STATUS" operation="profile_replace" profile="unconfined" name="/usr/lib/snapd/snap-confine//mount-namespace-capture-helper" pid=20074 comm="apparmor_parser"
Aug  8 06:41:29 mongorpc kernel: [1344088.539907] audit: type=1400 audit(1533681689.888:36): apparmor="STATUS" operation="profile_replace" profile="unconfined" name="/sbin/dhclient" pid=20073 comm="apparmor_parser"
Aug  8 06:41:29 mongorpc kernel: [1344088.541272] audit: type=1400 audit(1533681689.888:37): apparmor="STATUS" operation="profile_replace" profile="unconfined" name="/usr/lib/NetworkManager/nm-dhcp-client.action" pid=20073 comm="apparmor_parser"
Aug  8 06:41:29 mongorpc kernel: [1344088.543067] audit: type=1400 audit(1533681689.888:38): apparmor="STATUS" operation="profile_replace" profile="unconfined" name="/usr/lib/NetworkManager/nm-dhcp-helper" pid=20073 comm="apparmor_parser"
Aug 11 00:59:56 mongorpc kernel: [1582786.570317] perl invoked oom-killer: gfp_mask=0x15080c0(GFP_KERNEL_ACCOUNT|__GFP_ZERO), nodemask=(null), order=1, oom_score_adj=0
Aug 11 00:59:56 mongorpc kernel: [1582786.570319] perl cpuset=/ mems_allowed=0
Aug 11 00:59:56 mongorpc kernel: [1582786.570325] CPU: 3 PID: 1238 Comm: perl Not tainted 4.15.0-29-generic #31-Ubuntu
Aug 11 00:59:56 mongorpc kernel: [1582786.570326] Hardware name: QEMU c79c0bdd-d716-44d0-a9e7-e96d8fc6edb4, BIOS seabios-1.7.5-11.el7 04/01/2014
Aug 11 00:59:56 mongorpc kernel: [1582786.570327] Call Trace:
Aug 11 00:59:56 mongorpc kernel: [1582786.570336]  dump_stack+0x63/0x8b
Aug 11 00:59:56 mongorpc kernel: [1582786.570341]  dump_header+0x71/0x285
Aug 11 00:59:56 mongorpc kernel: [1582786.570343]  oom_kill_process+0x220/0x440
Aug 11 00:59:56 mongorpc kernel: [1582786.570346]  out_of_memory+0x2d1/0x4f0
Aug 11 00:59:56 mongorpc kernel: [1582786.570348]  __alloc_pages_slowpath+0xa90/0xe50
Aug 11 00:59:56 mongorpc kernel: [1582786.570351]  __alloc_pages_nodemask+0x263/0x280
Aug 11 00:59:56 mongorpc kernel: [1582786.570355]  alloc_pages_current+0x6a/0xe0
Aug 11 00:59:56 mongorpc kernel: [1582786.570356]  __get_free_pages+0xe/0x40
Aug 11 00:59:56 mongorpc kernel: [1582786.570359]  pgd_alloc+0x1e/0x170
Aug 11 00:59:56 mongorpc kernel: [1582786.570362]  mm_init+0x197/0x270
Aug 11 00:59:56 mongorpc kernel: [1582786.570364]  copy_process.part.35+0xa5a/0x1af0
Aug 11 00:59:56 mongorpc kernel: [1582786.570367]  ? security_file_alloc+0x29/0xa0
Aug 11 00:59:56 mongorpc kernel: [1582786.570368]  ? security_file_alloc+0x68/0xa0
Aug 11 00:59:56 mongorpc kernel: [1582786.570371]  _do_fork+0xdf/0x400
Aug 11 00:59:56 mongorpc kernel: [1582786.570374]  ? get_unused_fd_flags+0x30/0x40
Aug 11 00:59:56 mongorpc kernel: [1582786.570376]  SyS_clone+0x19/0x20
Aug 11 00:59:56 mongorpc kernel: [1582786.570379]  do_syscall_64+0x73/0x130
Aug 11 00:59:56 mongorpc kernel: [1582786.570383]  entry_SYSCALL_64_after_hwframe+0x3d/0xa2
Aug 11 00:59:56 mongorpc kernel: [1582786.570385] RIP: 0033:0x7f2bedb90b1c
Aug 11 00:59:56 mongorpc kernel: [1582786.570386] RSP: 002b:00007fff83600b70 EFLAGS: 00000246 ORIG_RAX: 0000000000000038
Aug 11 00:59:56 mongorpc kernel: [1582786.570388] RAX: ffffffffffffffda RBX: 00007fff83600b70 RCX: 00007f2bedb90b1c
Aug 11 00:59:56 mongorpc kernel: [1582786.570389] RDX: 0000000000000000 RSI: 0000000000000000 RDI: 0000000001200011
Aug 11 00:59:56 mongorpc kernel: [1582786.570390] RBP: 00007fff83600c00 R08: 00007f2bee87afc0 R09: 0000000000000000
Aug 11 00:59:56 mongorpc kernel: [1582786.570391] R10: 00007f2bee87b290 R11: 0000000000000246 R12: 0000000000000000
Aug 11 00:59:56 mongorpc kernel: [1582786.570392] R13: 0000000000000020 R14: 0000000000000000 R15: 0000000000000001
Aug 11 00:59:56 mongorpc kernel: [1582786.570394] Mem-Info:
Aug 11 00:59:56 mongorpc kernel: [1582786.570398] active_anon:11558619 inactive_anon:552696 isolated_anon:0
Aug 11 00:59:56 mongorpc kernel: [1582786.570398]  active_file:586 inactive_file:1767 isolated_file:0
Aug 11 00:59:56 mongorpc kernel: [1582786.570398]  unevictable:1352 dirty:281 writeback:0 unstable:0
Aug 11 00:59:56 mongorpc kernel: [1582786.570398]  slab_reclaimable:11369 slab_unreclaimable:20880
Aug 11 00:59:56 mongorpc kernel: [1582786.570398]  mapped:2470 shmem:17 pagetables:27358 bounce:0
Aug 11 00:59:56 mongorpc kernel: [1582786.570398]  free:114988 free_pcp:30 free_cma:0
Aug 11 00:59:56 mongorpc kernel: [1582786.570402] Node 0 active_anon:46234476kB inactive_anon:2210784kB active_file:2344kB inactive_file:7068kB unevictable:5408kB isolated(anon):0kB isolated(file):0kB mapped:9880kB dirty:1124kB writeback:0kB shmem:68kB shmem_thp: 0kB shmem_pmdmapped: 0kB anon_thp: 0kB writeback_tmp:0kB unstable:0kB all_unreclaimable? no
Aug 11 00:59:56 mongorpc kernel: [1582786.570403] Node 0 DMA free:15908kB min:20kB low:32kB high:44kB active_anon:0kB inactive_anon:0kB active_file:0kB inactive_file:0kB unevictable:0kB writepending:0kB present:15992kB managed:15908kB mlocked:0kB kernel_stack:0kB pagetables:0kB bounce:0kB free_pcp:0kB local_pcp:0kB free_cma:0kB
Aug 11 00:59:56 mongorpc kernel: [1582786.570407] lowmem_reserve[]: 0 2939 48221 48221 48221
Aug 11 00:59:56 mongorpc kernel: [1582786.570410] Node 0 DMA32 free:193388kB min:4116kB low:7124kB high:10132kB active_anon:2832648kB inactive_anon:0kB active_file:0kB inactive_file:0kB unevictable:0kB writepending:0kB present:3129212kB managed:3063644kB mlocked:0kB kernel_stack:0kB pagetables:5472kB bounce:0kB free_pcp:0kB local_pcp:0kB free_cma:0kB
Aug 11 00:59:56 mongorpc kernel: [1582786.570414] lowmem_reserve[]: 0 0 45282 45282 45282
Aug 11 00:59:56 mongorpc kernel: [1582786.570417] Node 0 Normal free:250656kB min:63440kB low:109808kB high:156176kB active_anon:43401828kB inactive_anon:2210784kB active_file:2536kB inactive_file:7068kB unevictable:5408kB writepending:1124kB present:47185920kB managed:46375276kB mlocked:5408kB kernel_stack:2976kB pagetables:103960kB bounce:0kB free_pcp:120kB local_pcp:120kB free_cma:0kB
Aug 11 00:59:56 mongorpc kernel: [1582786.570421] lowmem_reserve[]: 0 0 0 0 0
Aug 11 00:59:56 mongorpc kernel: [1582786.570424] Node 0 DMA: 1*4kB (U) 0*8kB 0*16kB 1*32kB (U) 2*64kB (U) 1*128kB (U) 1*256kB (U) 0*512kB 1*1024kB (U) 1*2048kB (M) 3*4096kB (M) = 15908kB
Aug 11 00:59:56 mongorpc kernel: [1582786.570435] Node 0 DMA32: 1657*4kB (UMEH) 433*8kB (UMEH) 190*16kB (UMEH) 86*32kB (UMEH) 86*64kB (UMEH) 52*128kB (UMEH) 86*256kB (UMEH) 70*512kB (UMEH) 63*1024kB (UMEH) 11*2048kB (E) 5*4096kB (E) = 193420kB
Aug 11 00:59:56 mongorpc kernel: [1582786.570448] Node 0 Normal: 6510*4kB (UMEH) 12062*8kB (UMEH) 4267*16kB (UMEH) 1045*32kB (UMEH) 251*64kB (UMEH) 62*128kB (UMH) 4*256kB (M) 3*512kB (UM) 0*1024kB 0*2048kB 0*4096kB = 250808kB
Aug 11 00:59:56 mongorpc kernel: [1582786.570460] Node 0 hugepages_total=0 hugepages_free=0 hugepages_surp=0 hugepages_size=1048576kB
Aug 11 00:59:56 mongorpc kernel: [1582786.570461] Node 0 hugepages_total=0 hugepages_free=0 hugepages_surp=0 hugepages_size=2048kB
Aug 11 00:59:56 mongorpc kernel: [1582786.570462] 9529 total pagecache pages
Aug 11 00:59:56 mongorpc kernel: [1582786.570464] 6063 pages in swap cache
Aug 11 00:59:56 mongorpc kernel: [1582786.570465] Swap cache stats: add 1983213, delete 1977156, find 2001135/2404241
Aug 11 00:59:56 mongorpc kernel: [1582786.570466] Free swap  = 0kB
Aug 11 00:59:56 mongorpc kernel: [1582786.570467] Total swap = 4039676kB
Aug 11 00:59:56 mongorpc kernel: [1582786.570467] 12582781 pages RAM
Aug 11 00:59:56 mongorpc kernel: [1582786.570468] 0 pages HighMem/MovableOnly
Aug 11 00:59:56 mongorpc kernel: [1582786.570468] 219074 pages reserved
Aug 11 00:59:56 mongorpc kernel: [1582786.570469] 0 pages cma reserved
Aug 11 00:59:56 mongorpc kernel: [1582786.570469] 0 pages hwpoisoned
Aug 11 00:59:56 mongorpc kernel: [1582786.570470] [ pid ]   uid  tgid total_vm      rss pgtables_bytes swapents oom_score_adj name
Aug 11 00:59:56 mongorpc kernel: [1582786.570475] [  478]     0   478    28537      531   241664     2949             0 systemd-journal
Aug 11 00:59:56 mongorpc kernel: [1582786.570477] [  488]     0   488    26476      179    94208       48             0 lvmetad
Aug 11 00:59:56 mongorpc kernel: [1582786.570479] [  518]     0   518    11478      356   118784      420         -1000 systemd-udevd
Aug 11 00:59:56 mongorpc kernel: [1582786.570481] [  731] 62583   731    35477      522   188416      138             0 systemd-timesyn
Aug 11 00:59:56 mongorpc kernel: [1582786.570482] [  812]   100   812    20003      547   180224      175             0 systemd-network
Aug 11 00:59:56 mongorpc kernel: [1582786.570484] [  836]   101   836    17685      495   176128      160             0 systemd-resolve
Aug 11 00:59:56 mongorpc kernel: [1582786.570486] [  949]   103   949    12526      110   143360       68          -900 dbus-daemon
Aug 11 00:59:56 mongorpc kernel: [1582786.570487] [  983]     0   983    95670      131   110592      201             0 lxcfs
Aug 11 00:59:56 mongorpc kernel: [1582786.570489] [  994]     0   994    71581      176   192512      221             0 accounts-daemon
Aug 11 00:59:56 mongorpc kernel: [1582786.570490] [  997]     0   997     1157      149    57344       21             0 svscanboot
Aug 11 00:59:56 mongorpc kernel: [1582786.570492] [  999]     0   999     1097      266    57344       31             0 supervise
Aug 11 00:59:56 mongorpc kernel: [1582786.570494] [ 1007]     0  1007     7507      475    98304       64             0 cron
Aug 11 00:59:56 mongorpc kernel: [1582786.570496] [ 1016]     0  1016    42283      585   229376     1949             0 networkd-dispat
Aug 11 00:59:56 mongorpc kernel: [1582786.570497] [ 1026]     0  1026     7083      458   102400       48             0 atd
Aug 11 00:59:56 mongorpc kernel: [1582786.570499] [ 1033]   102  1033    66818      189   167936      440             0 rsyslogd
Aug 11 00:59:56 mongorpc kernel: [1582786.570500] [ 1047]     0  1047    27621      383   114688       73             0 irqbalance
Aug 11 00:59:56 mongorpc kernel: [1582786.570502] [ 1056]     0  1056    17741      195   172032      285             0 systemd-logind
Aug 11 00:59:56 mongorpc kernel: [1582786.570504] [ 1059]     0  1059     1140      261    49152        8             0 svscan
Aug 11 00:59:56 mongorpc kernel: [1582786.570505] [ 1060]     0  1060     1094      182    53248       16             0 readproctitle
Aug 11 00:59:56 mongorpc kernel: [1582786.570507] [ 1078]     0  1078     1157      343    57344       22             0 run
Aug 11 00:59:56 mongorpc kernel: [1582786.570508] [ 1101]     0  1101     6344       23    90112       35             0 iscsid
Aug 11 00:59:56 mongorpc kernel: [1582786.570510] [ 1104]     0  1104     6470     1316    94208        0           -17 iscsid
Aug 11 00:59:56 mongorpc kernel: [1582786.570512] [ 1140]     0  1140    72861      112   212992      187             0 polkitd
Aug 11 00:59:56 mongorpc kernel: [1582786.570514] [ 1175]     0  1175    18074      438   180224      180         -1000 sshd
Aug 11 00:59:56 mongorpc kernel: [1582786.570515] [ 1183]     0  1183     3722      347    73728       29             0 agetty
Aug 11 00:59:56 mongorpc kernel: [1582786.570517] [ 1238]     0  1238    18444      956   192512     4168             0 perl
Aug 11 00:59:56 mongorpc kernel: [1582786.570518] [ 1297]     0  1297    14597      587   155648     4443             0 perl
Aug 11 00:59:56 mongorpc kernel: [1582786.570527] [ 1381]     0  1381    14595     1109   151552     3746             0 perl
Aug 11 00:59:56 mongorpc kernel: [1582786.570529] [ 4423]  1001  4423    19156      470   184320      172             0 systemd
Aug 11 00:59:56 mongorpc kernel: [1582786.570530] [ 4424]  1001  4424    48392        1   266240      570             0 (sd-pam)
Aug 11 00:59:56 mongorpc kernel: [1582786.570532] [30827]     0 30827   268736      720   270336     2225          -900 snapd
Aug 11 00:59:56 mongorpc kernel: [1582786.570534] [ 4582]     0  4582 21219313 12102792 108249088   990027             0 nodeos
Aug 11 00:59:56 mongorpc kernel: [1582786.570536] [14747]     0 14747    14595     1480   147456     3543             0 perl
Aug 11 00:59:56 mongorpc kernel: [1582786.570538] Out of memory: Kill process 4582 (nodeos) score 951 or sacrifice child
Aug 11 00:59:56 mongorpc kernel: [1582786.570608] Killed process 4582 (nodeos) total-vm:84877252kB, anon-rss:48406604kB, file-rss:4556kB, shmem-rss:8kB
Aug 11 00:59:58 mongorpc kernel: [1582789.342167] oom_reaper: reaped process 4582 (nodeos), now anon-rss:0kB, file-rss:0kB, shmem-rss:0kB
As you can see, the whole system total memory is 49GB, my config of nodeos is;
chain-state-db-size-mb = 30720
chain-state-db-guard-size-mb = 128
So how did it reach memory of 48411160 KB(anon-rss +file-rss) ? Doesn't it should be 30720 MB mostly?
EDIT:
data
root@mongorpc:/opt/eos# du data/
348176  data/blocks/reversible
27576752        data/blocks
5120016 data/state
32696772        data/
nodeos version: v1.1.4
 spartucus
All 24 comments
same error
 lcg635
on 13 Aug 2018
lcg635
on 13 Aug 2018
also oom, maybe memory leak for nodeos?
 joware
on 14 Aug 2018
joware
on 14 Aug 2018
Same error in Centos 7.3.
It worked fine in eos v1.0.5.
Does the eos v1.2.1 increase the minimum memory ?
 wsdfz
on 16 Aug 2018
wsdfz
on 16 Aug 2018
It OOM again. It is OOM when replay, and replay is because it is OOM...
Command is: nodeos -d /mnt/data --replay-blockchain --hard-replay-blockchain
My server has 16G RAM, and 12288124kB (12G) is used as file-rss.
My config file used the following:
chain-state-db-size-mb = 8192
reversible-blocks-db-size-mb = 340
network-version-match = 1
Is there any possible reason for it?
[517184.213658] Mem-Info:
[517184.213665] active_anon:842370 inactive_anon:75 isolated_anon:0
active_file:791 inactive_file:2137 isolated_file:0
unevictable:3072000 dirty:4 writeback:0 unstable:0
slab_reclaimable:61419 slab_unreclaimable:9297
mapped:3072109 shmem:140 pagetables:9718 bounce:0
free:34030 free_pcp:273 free_cma:0
[517184.213672] Node 0 DMA free:15900kB min:64kB low:80kB high:96kB active_anon:0kB inactive_anon:0kB active_file:0kB inactive_file:0kB unevictable:0kB isolated(anon):0kB isolated(file):0kB present:15992kB managed:15908kB mlocked:0kB dirty:0kB writeback:0kB mapped:0kB shmem:0kB slab_reclaimable:0kB slab_unreclaimable:8kB kernel_stack:0kB pagetables:0kB unstable:0kB bounce:0kB free_pcp:0kB local_pcp:0kB free_cma:0kB writeback_tmp:0kB pages_scanned:0 all_unreclaimable? yes
[517184.213687] Node 0 DMA32 free:64068kB min:12044kB low:15052kB high:18064kB active_anon:605820kB inactive_anon:36kB active_file:64kB inactive_file:3420kB unevictable:2096184kB isolated(anon):0kB isolated(file):0kB present:3129216kB managed:2898784kB mlocked:2096184kB dirty:0kB writeback:0kB mapped:2096188kB shmem:80kB slab_reclaimable:100488kB slab_unreclaimable:12680kB kernel_stack:352kB pagetables:7524kB unstable:0kB bounce:0kB free_pcp:180kB local_pcp:60kB free_cma:0kB writeback_tmp:0kB pages_scanned:4094 all_unreclaimable? yes
[517184.213701] Node 0 Normal free:56284kB min:55472kB low:69340kB high:83208kB active_anon:2763660kB inactive_anon:264kB active_file:3100kB inactive_file:4948kB unevictable:10191816kB isolated(anon):0kB isolated(file):0kB present:13631488kB managed:13352544kB mlocked:10191816kB dirty:16kB writeback:0kB mapped:10192248kB shmem:480kB slab_reclaimable:145188kB slab_unreclaimable:24500kB kernel_stack:1840kB pagetables:31348kB unstable:0kB bounce:0kB free_pcp:904kB local_pcp:168kB free_cma:0kB writeback_tmp:0kB pages_scanned:64 all_unreclaimable? no
[517184.213714] Node 0 DMA: 14kB (U) 18kB (U) 116kB (U) 032kB 264kB (U) 1128kB (U) 1256kB (U) 0512kB 11024kB (U) 12048kB (M) 34096kB (M) = 15900kB
[517184.213733] Node 0 DMA32: 26134kB (UEM) 17088kB (UEM) 84316kB (UEM) 29332kB (EM) 11564kB (UEM) 76128kB (UEM) 0256kB 0512kB 01024kB 02048kB 04096kB = 64068kB
[517184.213749] Node 0 Normal: 24574kB (UEM) 28878kB (UEM) 115116kB (UEM) 14932kB (EM) 764kB (UM) 0128kB 0256kB 0512kB 01024kB 02048kB 0*4096kB = 56556kB
[517184.213775] Node 0 hugepages_total=0 hugepages_free=0 hugepages_surp=0 hugepages_size=1048576kB
[517184.213778] Node 0 hugepages_total=0 hugepages_free=0 hugepages_surp=0 hugepages_size=2048kB
[517184.213780] 3075043 total pagecache pages
[517184.213782] 0 pages in swap cache
[517184.213784] Swap cache stats: add 0, delete 0, find 0/0
[517184.213785] Free swap = 0kB
[517184.213787] Total swap = 0kB
[517184.213788] 4194174 pages RAM
[517184.213790] 0 pages HighMem/MovableOnly
[517184.213791] 127365 pages reserved
[517184.213793] [ pid ] uid tgid total_vm rss nr_ptes swapents oom_score_adj name
[517184.213798] [ 336] 0 336 9865 92 23 0 0 systemd-journal
[517184.213802] [ 349] 0 349 11086 148 25 0 -1000 systemd-udevd
[517184.213805] [ 453] 0 453 13877 112 27 0 -1000 auditd
[517184.213809] [ 473] 81 473 14524 136 33 0 -900 dbus-daemon
[517184.213812] [ 479] 998 479 134609 1884 60 0 0 polkitd
[517184.213815] [ 480] 0 480 6594 79 18 0 0 systemd-logind
[517184.213818] [ 481] 0 481 5414 66 16 0 0 irqbalance
[517184.213821] [ 489] 0 489 6476 50 18 0 0 atd
[517184.213824] [ 492] 0 492 31570 154 22 0 0 crond
[517184.213827] [ 500] 0 500 27522 34 10 0 0 agetty
[517184.213830] [ 501] 0 501 27522 33 11 0 0 agetty
[517184.213833] [ 517] 38 517 11810 180 27 0 0 ntpd
[517184.213837] [ 721] 0 721 57594 492 117 0 0 httpd
[517184.213840] [ 722] 0 722 143438 3262 101 0 0 tuned
[517184.213843] [ 726] 0 726 67968 704 57 0 0 rsyslogd
[517184.213846] [ 854] 0 854 7920 155 20 0 0 AliYunDunUpdate
[517184.213849] [ 1031] 0 1031 30527 156 12 0 0 wrapper
[517184.213853] [ 1258] 0 1258 28203 257 56 0 -1000 sshd
[517184.213856] [ 1295] 0 1295 18549 130 15 0 0 aliyun-service
[517184.213859] [17979] 48 17979 57628 492 117 0 0 httpd
[517184.213863] [17980] 48 17980 57628 492 117 0 0 httpd
[517184.213866] [17981] 48 17981 57628 492 117 0 0 httpd
[517184.213869] [17982] 48 17982 57628 492 117 0 0 httpd
[517184.213872] [17983] 48 17983 57628 492 117 0 0 httpd
[517184.213875] [18183] 48 18183 57628 491 117 0 0 httpd
[517184.213878] [25397] 48 25397 57628 492 117 0 0 httpd
[517184.213881] [25398] 48 25398 57628 492 117 0 0 httpd
[517184.213884] [ 4984] 48 4984 57628 491 117 0 0 httpd
[517184.213887] [ 5864] 48 5864 57628 491 117 0 0 httpd
[517184.213890] [ 7862] 0 7862 629077 14664 90 0 0 java
[517184.213894] [12009] 0 12009 28293 45 13 0 0 _replay.sh
[517184.213897] [12011] 0 12011 4070900 3889491 7716 0 0 nodeos
[517184.213900] [24205] 0 24205 30713 989 58 0 0 AliYunDun
[517184.213903] Out of memory: Kill process 12011 (nodeos) score 929 or sacrifice child
[517184.214967] Killed process 12011 (nodeos) total-vm:16283600kB, anon-rss:3269832kB, file-rss:12288124kB, shmem-rss:8kB
wsdfz
on 24 Aug 2018
v1.1.0 added a database guard for clean shutdown on shared memory db exhaustion. Please upgrade to latest v1.2.2 and try again. Also, I see you are not explicitly pointing to a config via --config-dir so maybe it is using a different config.ini than you think.
 heifner
on 24 Aug 2018
heifner
on 24 Aug 2018
I was using v1.1.4, and chain-state-db-guard-size-mb = 128 , still oom.
spartucus
on 24 Aug 2018
Same error on ubuntu with 16GB of memory today.
I used the default configuration:
chain-state-db-size-mb = 65536
reversible-blocks-db-size-mb = 340
 ghost
on 5 Sep 2018
ghost
on 5 Sep 2018
Same error on ubuntu with 32GB of memory today.
version: 1.1.6
chain-state-db-size-mb = 40960
reversible-blocks-db-size-mb = 340
 firesWu
on 5 Sep 2018
firesWu
on 5 Sep 2018
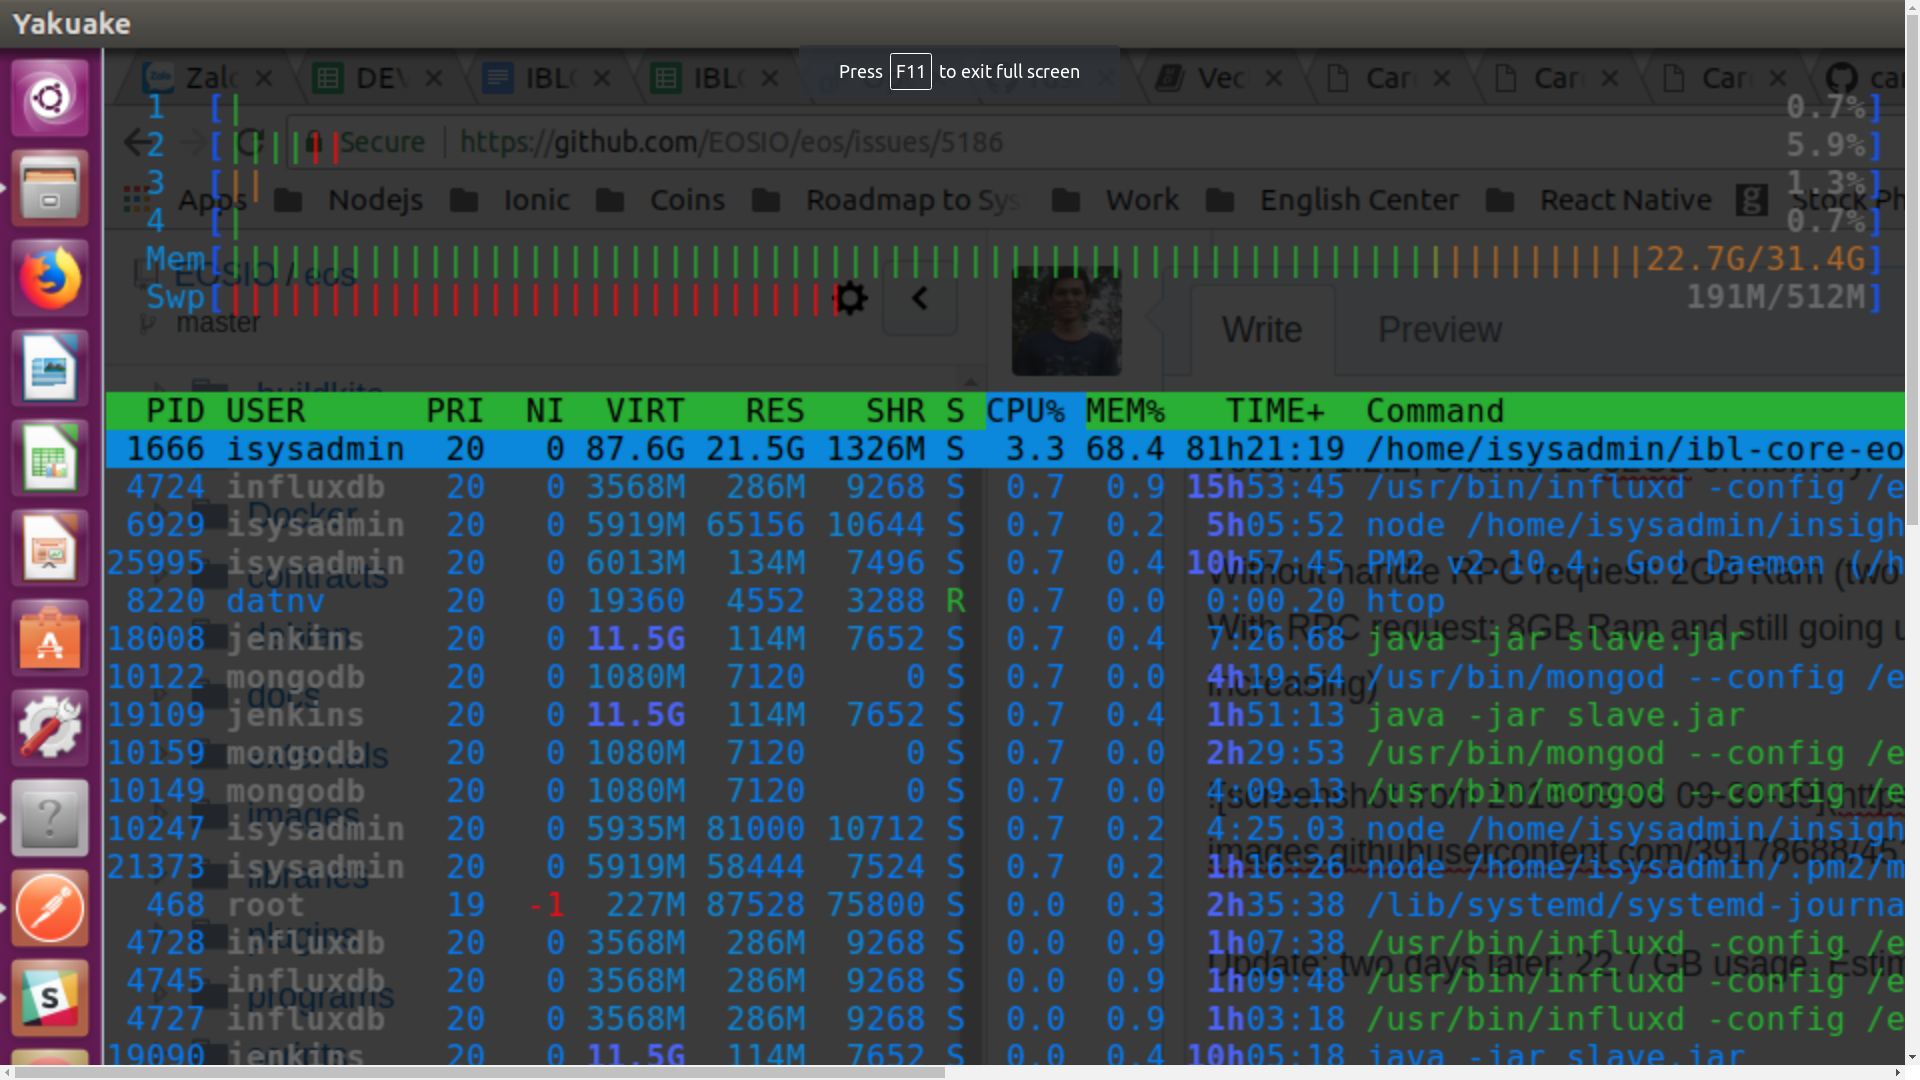
Version 1.2.2, Ubuntu 18 32GB of memory.
Without handle RPC request: 2GB Ram (two weeks without any error, ram always 2GB)
With RPC request: 8GB Ram and still going up (only one day, nodeos eat more 6GB Ram, slowly increasing)
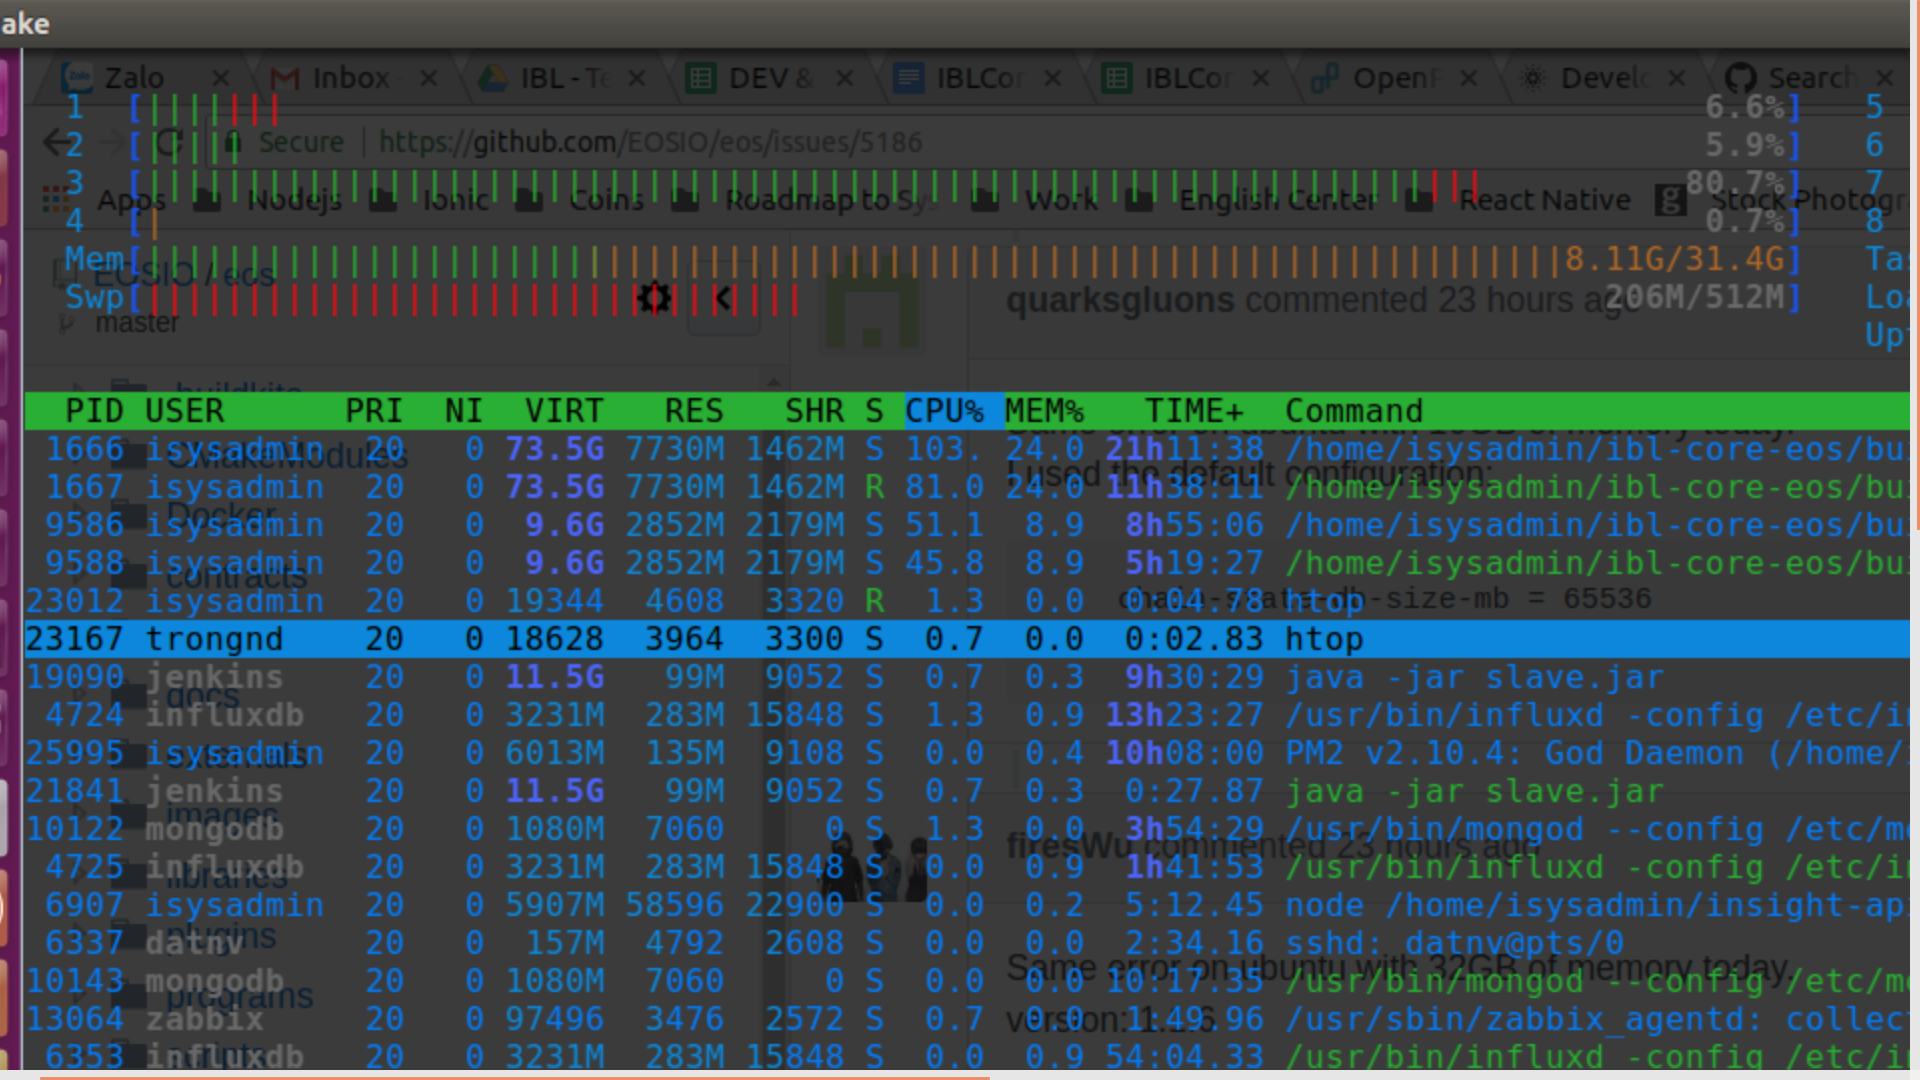
Update: two days later: 22.7 GB usage. Estimate die time: 1.5 days left
config.ini:
#producer-name = !!!!YOUR_BP_NAME!!!!!!!!
#signature-provider = YOUR_BLOCK_SIGN_PUB_KEY=KEY:YOUR_BLOCK_SIGN_PRIV_KEY
agent-name = AgentName
#blocks-dir = "blocks"
chain-state-db-size-mb = 65536
reversible-blocks-db-size-mb = 640
contracts-console = false
http-server-address = 0.0.0.0:8888
p2p-listen-endpoint = 0.0.0.0:9876
p2p-server-address = 172.105.224.240:9876
#bnet-endpoint = !!YOUR_ENDPOINT_IP_ADDRESS!!:9875
#bnet_threads = 4
socket-endpoint = 0.0.0.0:4320
socket-blocks = 5
access-control-allow-origin = *
access-control-allow-headers = *
# access-control-max-age =
#access-control-allow-credentials = false
#p2p-max-nodes-per-host = 4
# actor-whitelist =
# actor-blacklist =
# contract-whitelist =
# contract-blacklist =
# filter-on =
# SSL
# Filename with https private key in PEM format. Required for https (eosio::http_plugin)
# https-server-address =
# Filename with the certificate chain to present on https connections. PEM format. Required for https. (eosio::http_plugin)
# https-certificate-chain-file =
# Filename with https private key in PEM format. Required for https (eosio::http_plugin)
# https-private-key-file =
allowed-connection = any
log-level-net-plugin = info
max-clients = 150
connection-cleanup-period = 30
network-version-match = 1
sync-fetch-span = 2000
enable-stale-production = false
max-implicit-request = 1500
pause-on-startup = false
max-transaction-time = 30
max-irreversible-block-age = -1
txn-reference-block-lag = 0
unlock-timeout = 90000
abi-serializer-max-time-ms = 1000
log file: https://drive.google.com/open?id=1IPwxI_VIPAk_yhLUoqbFPo5uKiiii2hg
 datnv-ibl
on 6 Sep 2018
datnv-ibl
on 6 Sep 2018
To solve this problem, I thought of a temporary way to monitor the memory and restart it at 0.8.
Maybe it is useful for you too.
nodeos_rate_restart.sh
...
...
while :
do
        # check memory
        level=80.0
        rate=`ps aux |grep 'nodeos ' |grep -v grep| awk 'NR==1{print $4}'`
        if [ `echo "$rate > $level"|bc` -eq 1 ] ;
        then

                echo "Memory Warn"
                ps aux |grep nodeos
                    echo "$(date): begin to restart"
                    pkill nodeos;
                    sleep 20
                    $START
                    echo "$(date): end to restart"

        fi
                sleep 60
done
...
...
#install bc
sudo apt-get install bc
Then We have to wait for the development team to update the code to resolve it. I don't know when they'll be able to solve it.
ghost
on 6 Sep 2018
This is affecting us quite badly, the daemon gets stopped every six hours or so. We query every block with RPC and it didn't used to leak memory like this in earlier versions.
 Ampakinetic
on 12 Sep 2018
Ampakinetic
on 12 Sep 2018
Update to v1.2.5. It removes mlock, and it purges unapplied transactions much better than any previous release. For nodes syncing with mainnet, this should dramatically improve memory behavior.
 jgiszczak
on 12 Sep 2018
jgiszczak
on 12 Sep 2018
Thank you very much, the upgrade has made a dramatic difference and memory consumption is way lower and stable now.
Ampakinetic
on 13 Sep 2018
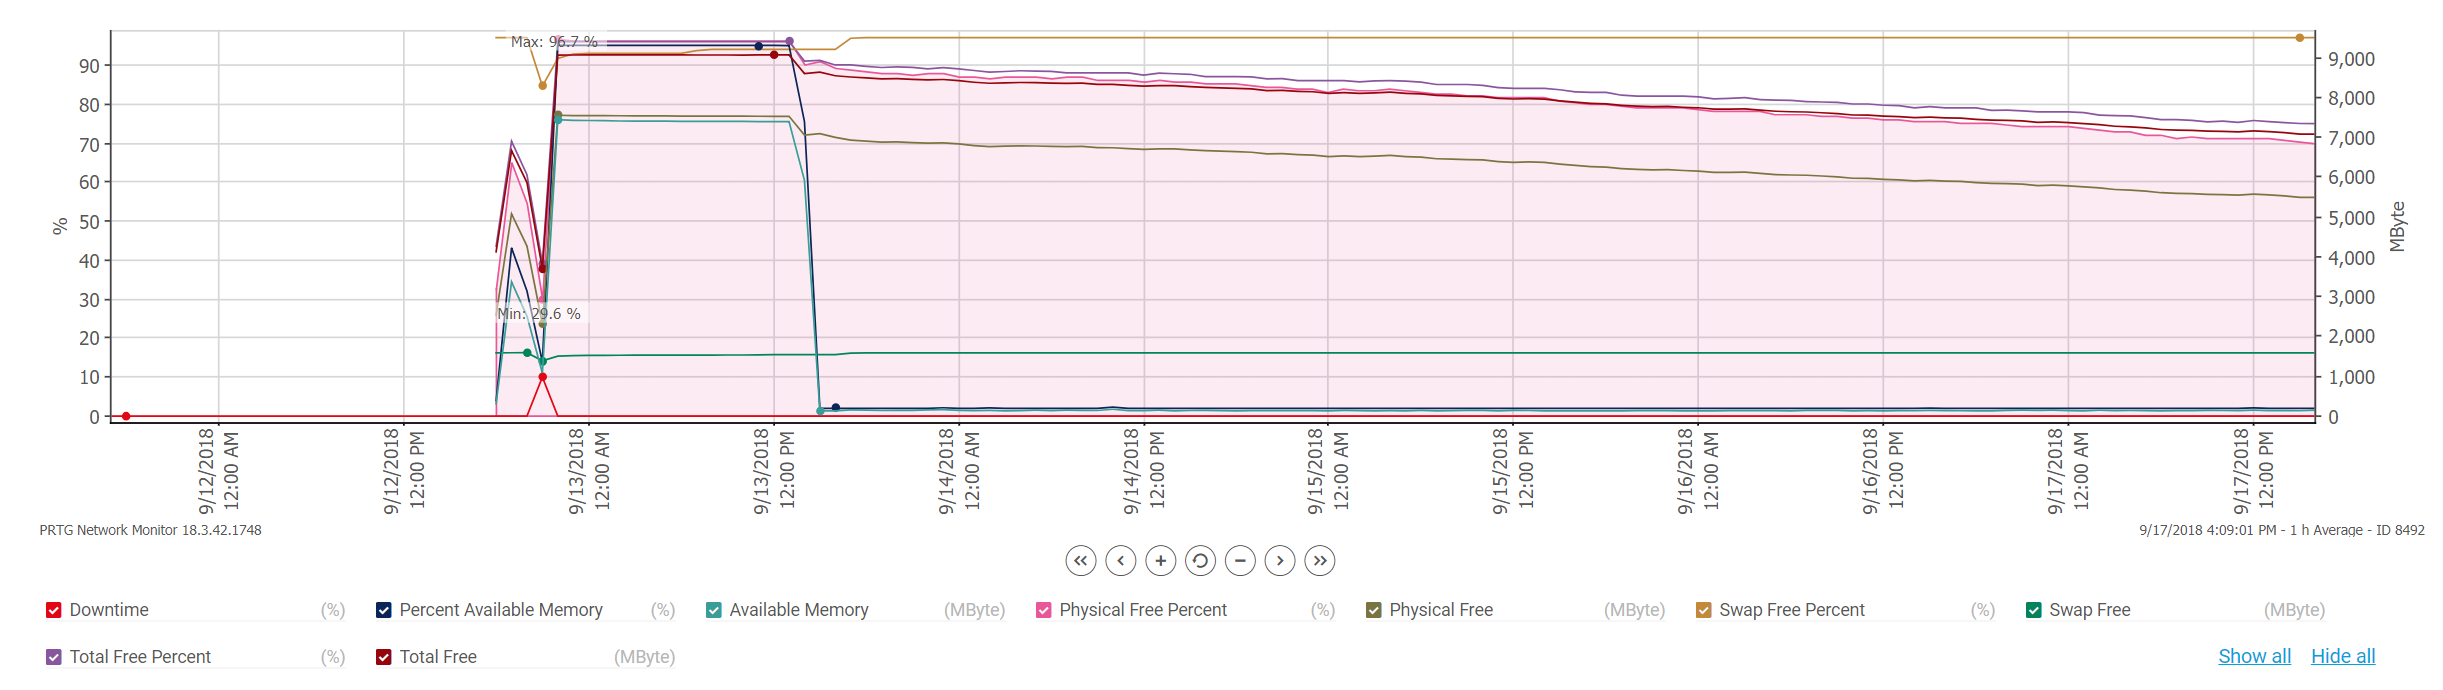
There's still a much slower leak happening, in this graph the first left hand spiking is the older version (1.2.4) and you can see it's a very steep slope. Then the right hand side is the current 1.2.5, using up ever more memory. This might be normal but I thought I'd post this in case it's not.
Ampakinetic
on 17 Sep 2018
version 1.2.5. the error it still happen
 SpadeRoy
on 25 Sep 2018
SpadeRoy
on 25 Sep 2018
try v1.3.0, we've moved on to that and the memory graph (from my earlier post) is looking a lot flatter after the upgrade.
Ampakinetic
on 25 Sep 2018
@Ampakinetic v1.3.0, Do you node had happend shutdown, and the error is 'database dirty flag set'?
SpadeRoy
on 25 Sep 2018
Getting the same problem here with v1.3.0 on Ubuntu 18.04 16GB memory and chain-state-db-size-mb = 12288
 Raptus1
on 10 Oct 2018
Raptus1
on 10 Oct 2018
@Raptus1 Do you have history_plugin enabled? If so, what are your filter settings?
jgiszczak
on 10 Oct 2018
@jgiszczak No. Net-, producer- and chain-plugins only.
Raptus1
on 11 Oct 2018
@Raptus1 Are you making use of the HTTP interface? If so, how much? Can you enable the db_size_api_plugin and retrieve the current used_bytes for your node?
curl http://127.0.0.1:8888/v1/db_size/get | json_pp -json_opt canonical,pretty[1]
Also, for mainnet, chain-state-db-size-mb = 65536 is recommended.
As observed by datnv-ibl, mainnet's actual RAM usage has been hovering around 2 GB for some time now. This is still true today and can be checked by an RPC call to the EOSCalgary node, which is running the db_size_api_plugin. A mainnet synced node without history_plugin should maintain RAM usage not much higher than that.
[1] Thanks to cc32d9 for the handy pretty-printed curl command.
jgiszczak
on 11 Oct 2018
@jgiszczak No HTTP-connections on the killed node; Only p2p.
Will need to get back to you on the db_size_api_plugin when I have it available.
I am aware of the recommended size, but as you say, actual usage have not been even close to call for oom-kill unless there was some intense sudden spikes.
Thanks so far.
Raptus1
on 11 Oct 2018
The same error got with 1.3.2 on Centos 7
 iFrankWu
on 31 Oct 2018
iFrankWu
on 31 Oct 2018
Please try the latest version with at least 32GB memory. Please ask in eosio.stackexchange.com if you have further questions.
 taokayan
on 2 Nov 2018
taokayan
on 2 Nov 2018
Related issues
 Npizza
·
3Comments
Npizza
·
3Comments
 dimakomar
·
3Comments
dimakomar
·
3Comments
 christola
·
3Comments
christola
·
3Comments
 hsejin314
·
3Comments
hsejin314
·
3Comments
 sim31
·
3Comments
sim31
·
3Comments
Most helpful comment
To solve this problem, I thought of a temporary way to monitor the memory and restart it at 0.8.
Maybe it is useful for you too.
nodeos_rate_restart.sh
Then We have to wait for the development team to update the code to resolve it. I don't know when they'll be able to solve it.