Envoy: Per-request time spent in Envoy in Access Logs
Hello from Cloud Foundry! We are using Istio with Envoy in our efforts to move to Kubernetes. As part of that, we are trying to make envoy's access logs feature compatible with our existing ingress router, Gorouter. Docs here for the curious, but the specific field we're interested in emulating is:
Gorouter Timeis the total time it takes for the request to go through the Gorouter initially plus the time it takes for the response to travel back through the Gorouter. This does not include the time the request spends traversing the network to the app. This also does not include the time the app spends forming a response.
Our users find gorouter_time very helpful when diagnosing latency issues. With a value like this, plus the existing x-envoy-upstream-service-time we could accurately identify whether the cause of latency is envoy, the application, or the network (in my experience it's often the network, so quickly identifying this is helpful).
So far what we've figured out is that we can subtract %RESP(X-ENVOY-UPSTREAM-SERVICE-TIME)% from %RESPONSE_DURATION% to get the amount of time from when the ingress envoy receives the request to when the workload receives the request. However this includes time spent in networking between the gateway and the workload, and it's missing the time the request spends traveling back through the gateway. So it's unfortunately not sufficient to eliminate envoy.
Is there a value we could use that captures this in the access logs? Or as a less-preferred alternative, are there metrics that could at least give us a sense of this in aggregate?
 XanderStrike
All 10 comments
Is there some misunderstanding here?
It seems that %RESP(X-ENVOY-UPSTREAM-SERVICE-TIME)% includes the latency of the network from Envoy to workload and the time cost of workload generating responses.
So, we can subtract %RESP(X-ENVOY-UPSTREAM-SERVICE-TIME)% from %DURATION% (not %RESPONSE_DURATION%) to get the latency caused by Envoy itself.
 wbpcode
on 4 Aug 2020
wbpcode
on 4 Aug 2020
Our impression was that the %RESP(???)% command was reading the headers off of the _upstream_ response. In the Istio case there's an Envoy gateway and an Envoy sidecar before the app; we believed that X-ENVOY-UPSTREAM-SERVICE-TIME was coming from the sidecar Envoy. We observe that responses from the gateway include this header, but they are different from what is rendered in our access log:
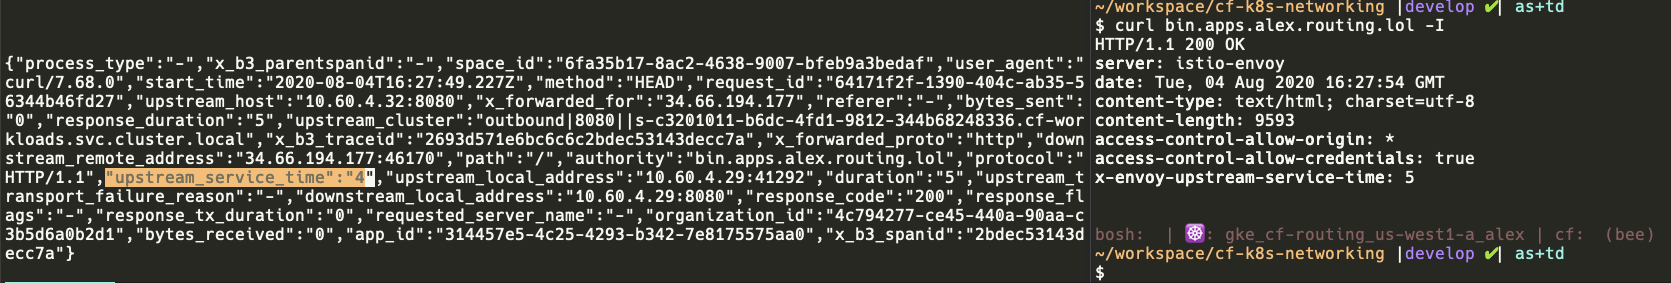
Therefore we're pretty confident in saying this is the value from the sidecar, not the value from the gateway.
Perhaps this diagram will better explain our situation and what we're looking for:
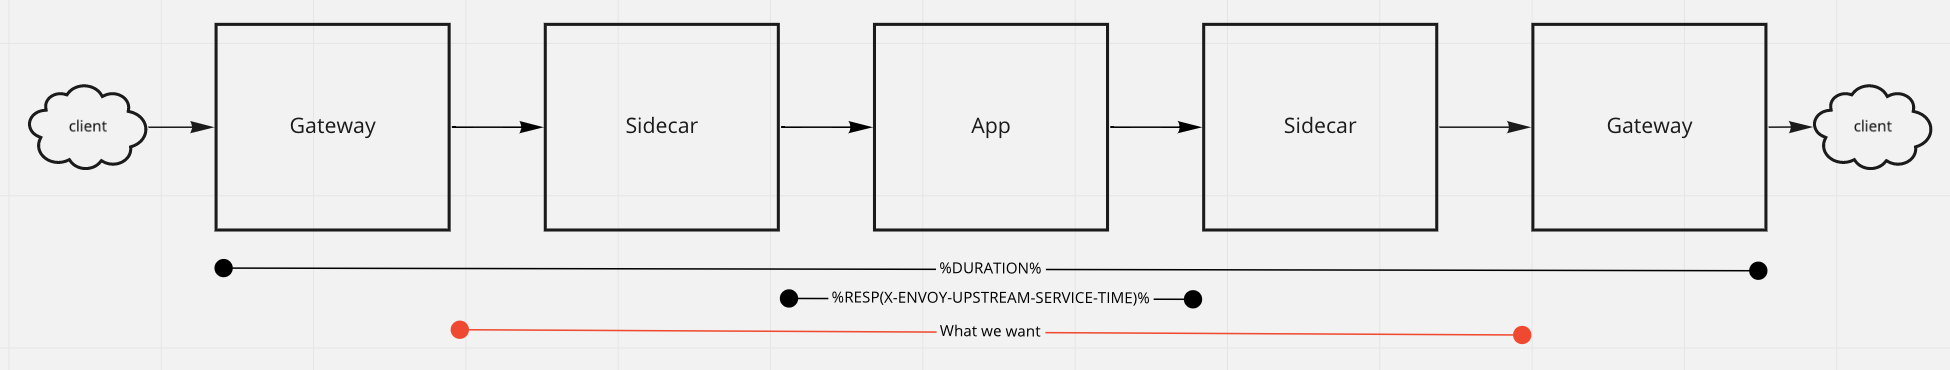
I believe that the value we want is actually the value of the X-ENVOY-UPSTREAM-SERVICE-TIME that the gateway envoy attaches to the response it sends to its client, but we need that in the access log. Is there a way to do that?
XanderStrike
on 4 Aug 2020
In fact, Access Log is rendered after the request is completed, %RESP(...)% should read data from the headers returned from the envoy gateway to the client (not the headers returned by the upstream, our plugins may make some modifications) .
I try it locally to see what the problem is. In addition, if you can, I hope you can provide the format of the access log.
wbpcode
on 5 Aug 2020
Since I do not have a suitable environment locally, I directly access httpbin.org through the envoy gateway. By specifying /response-headers, httpbin.org will return a response with x-envoy-upstream-time to the envoy gateway, but eventually the header data will be overwritten by the envoy gateway. And the upstrem service time in the Access log is the rewritten data.
Access Log format:
        config:
          access_log:
            name: envoy.file_access_log
            config:
              path: /dev/stdout
              json_format:
                "upstream-service-time": "%RESP(X-ENVOY-UPSTREAM-SERVICE-TIME)%"
curl envoy gateway:
$ curl localhost:8080/response-headers?x-envoy-upstream-service-time=3\&flag-header=This-header-will-not-be-overwrite-by-envoy -I
HTTP/1.1 200 OK
date: Wed, 05 Aug 2020 02:29:10 GMT
content-type: application/json
content-length: 174
server: envoy
x-envoy-upstream-service-time: 515
flag-header: This-header-will-not-be-overwrite-by-envoy
access-control-allow-origin: *
access-control-allow-credentials: true
curl httpbin.org directly:
$ curl httpbin.org/response-headers?x-envoy-upstream-service-time=3\&flag-header=This-header-will-not-be-over
write-by-envoy -I
HTTP/1.1 200 OK
Date: Wed, 05 Aug 2020 02:31:18 GMT
Content-Type: application/json
Content-Length: 174
Connection: keep-alive
Server: gunicorn/19.9.0
x-envoy-upstream-service-time: 3
flag-header: This-header-will-not-be-overwrite-by-envoy
Access-Control-Allow-Origin: *
Access-Control-Allow-Credentials: true
Access Log result:
{"upstream-service-time":"475"}
{"upstream-service-time":"481"}
{"upstream-service-time":"493"}
{"upstream-service-time":"477"}
{"upstream-service-time":"238"}
{"upstream-service-time":"503"}
{"upstream-service-time":"527"}
{"upstream-service-time":"240"}
{"upstream-service-time":"530"}
Debug Log of envoy gateway:
[2020-08-05 10:48:02.885][13642][debug][http] [source/common/http/conn_manager_impl.cc:1777] [C0][S18064157627675955617] encoding headers via codec (end_stream=true):
':status', '200'
'date', 'Wed, 05 Aug 2020 02:48:02 GMT'
'content-type', 'application/json'
'content-length', '174'
'server', 'envoy'
'x-envoy-upstream-service-time', '530'
'flag-header', 'This-header-will-not-be-overwrite-by-envoy'
'access-control-allow-origin', '*'
'access-control-allow-credentials', 'true'
From the above results, it is not difficult to see that the x-envoy-upstream-service-time from the upstream will be rewritten by the envoy gateway, and the data written to the Access Log is the rewritten data.
wbpcode
on 5 Aug 2020
But it is really strange that the results obtained by your curl command do not match the Access Log data. I recommend that you use the following command to open the debug log of the envoy gateway, and then check what the gateway returns to the client. At the same time, compare x-envoy-upsteam-service-time in the debug log and x-envoy-upstream-service-time in the Access Log. They should be consistent.
kubecctl exec <envoy-gateway-pod-name> -n <namespace> -- curl localhost:<adminport>/logging?level=debug -X POST
Hey @wbpcode . I work with @XanderStrike on this task and we double checked our results and we saw that numbers from access log and from curl match. I guess, we were looking the wrong log line initially.
 mike1808
on 6 Aug 2020
mike1808
on 6 Aug 2020
Also @wbpcode , you said:
It seems that %RESP(X-ENVOY-UPSTREAM-SERVICE-TIME)% includes the latency of the network from Envoy to workload and the time cost of workload generating responses.
However, the docs say:
x-envoy-upstream-service-time - Contains the time in milliseconds spent by the upstream host processing the request.
And it looks like that the docs are not right, it's the time in milliseconds spent by the upstream host processing the request and the networking delay, right?
mike1808
on 6 Aug 2020
The description of the docs does appear to be somewhat inaccurate
wbpcode
on 6 Aug 2020
@XanderStrike may be we can close this issue?
wbpcode
on 7 Aug 2020
Thanks for all your help!
XanderStrike
on 11 Aug 2020
Related issues
 lps0535
·
3Comments
lps0535
·
3Comments
 anatolebeuzon
·
3Comments
anatolebeuzon
·
3Comments
 karthequian
·
3Comments
karthequian
·
3Comments
 vpiduri
·
3Comments
vpiduri
·
3Comments
 dstrelau
·
3Comments
dstrelau
·
3Comments
Most helpful comment
@XanderStrike may be we can close this issue?