Envoy: Envoy memory leak with bi-directional GRPC Streams
Description:
I opened an issue on Istio's repo, but the issue comes from Envoy itself.
It seems that Envoy's memory keeps increasing at each messages going through a GRPC bi-directional Stream
[optional Relevant Links:]
https://github.com/istio/istio/issues/18557
Any help would be welcome. I'll try to get a memory dump to check what's in RAM, but maybe there's a specific format used for debugging that is usually used for that ?
Thanks
 prune998
All 33 comments
Please get a memory dump and also make sure that you are not somehow buffering the request or response stream in your configuration.
 mattklein123
on 1 Nov 2019
mattklein123
on 1 Nov 2019
how do you want the memory dump ?
What config would make me buffer the data so that it keeps increasing ?
prune998
on 1 Nov 2019
1) tcmalloc heap profiler
2) Retry, buffer filter, etc.
mattklein123
on 1 Nov 2019
I used tcmalloc/pprof and I have a bunch of profile files... is this right ?
I used :
HEAPCHECK=normal
HEAPPROFILE=/tmp/profile
Is this enough ?
I tried looking into it... but I'm not expert enough... I see memory used, but can't tell where :)
The more I look into it, the more I think it's related to caches/buffers/metrics... but have no clue so far :)
@mattklein123, please let me know if the tcmalloc profile files are OK and what's the best way to share them.
Thanks
prune998
on 4 Nov 2019
Here's an example where I have constant 400 GRPC (HTTP/2) connexions, sending some data, and sometimes ending and re-connecting to keep the 400cnx. Memory keep growing...
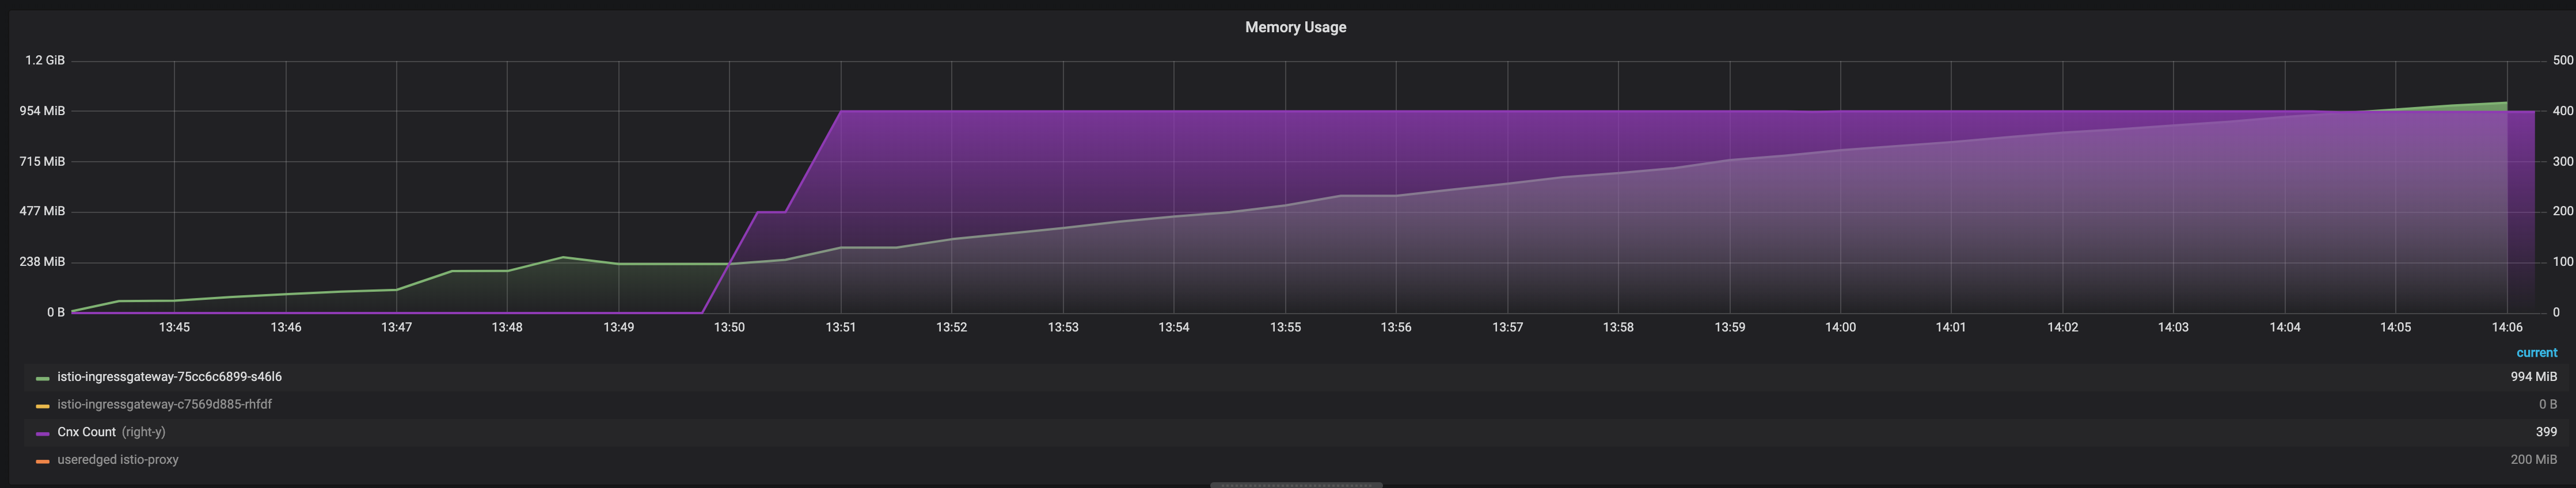
prune998
on 4 Nov 2019
@prune998 a couple questions to double check from beginning:
- What is the exact proxy version you're using? Run
envoy --versionin the container or result from/server_infoadmin endpoints. - Is the gRPC connections are over TLS or plaintext, how about upstream?
I'm suspecting this is an issue similar to #6617, even for non-TLS traffic, potentially affected by recent default buffer impl swap.
 lizan
on 5 Nov 2019
lizan
on 5 Nov 2019
Version is envoy version: c33dc49585e5e7b5f616c8b5377a5f1f52505e20/1.12.0-dev/Clean/RELEASE/BoringSSL From Istio 1.3.4.
Workflow is :
Go Client + TLS --> Azure AKS --> Envoy + SSL offload --> pod with same Envoy as sidecar proxy + Go server app
The issue is on the Ingress Gateway that is offloading SSL and multiplexing to the backend's pod.
prune998
on 5 Nov 2019
It seems it already includes the PR made for the issue you're pointing at. I still do have a really similar behaviour to this...
- using SSL
- few connexions
- memory increasing over time even without new connexions (which relates to
large body requests, as it's a HTTP/2 stream, so a long lasting connexion where I send small chucks of data that finally piles up to give, in the end, a large body)
Should we re-open this issue ?
prune998
on 5 Nov 2019
Here's a graph from tonight run... 400 cnx (fading) and memory still increasing...
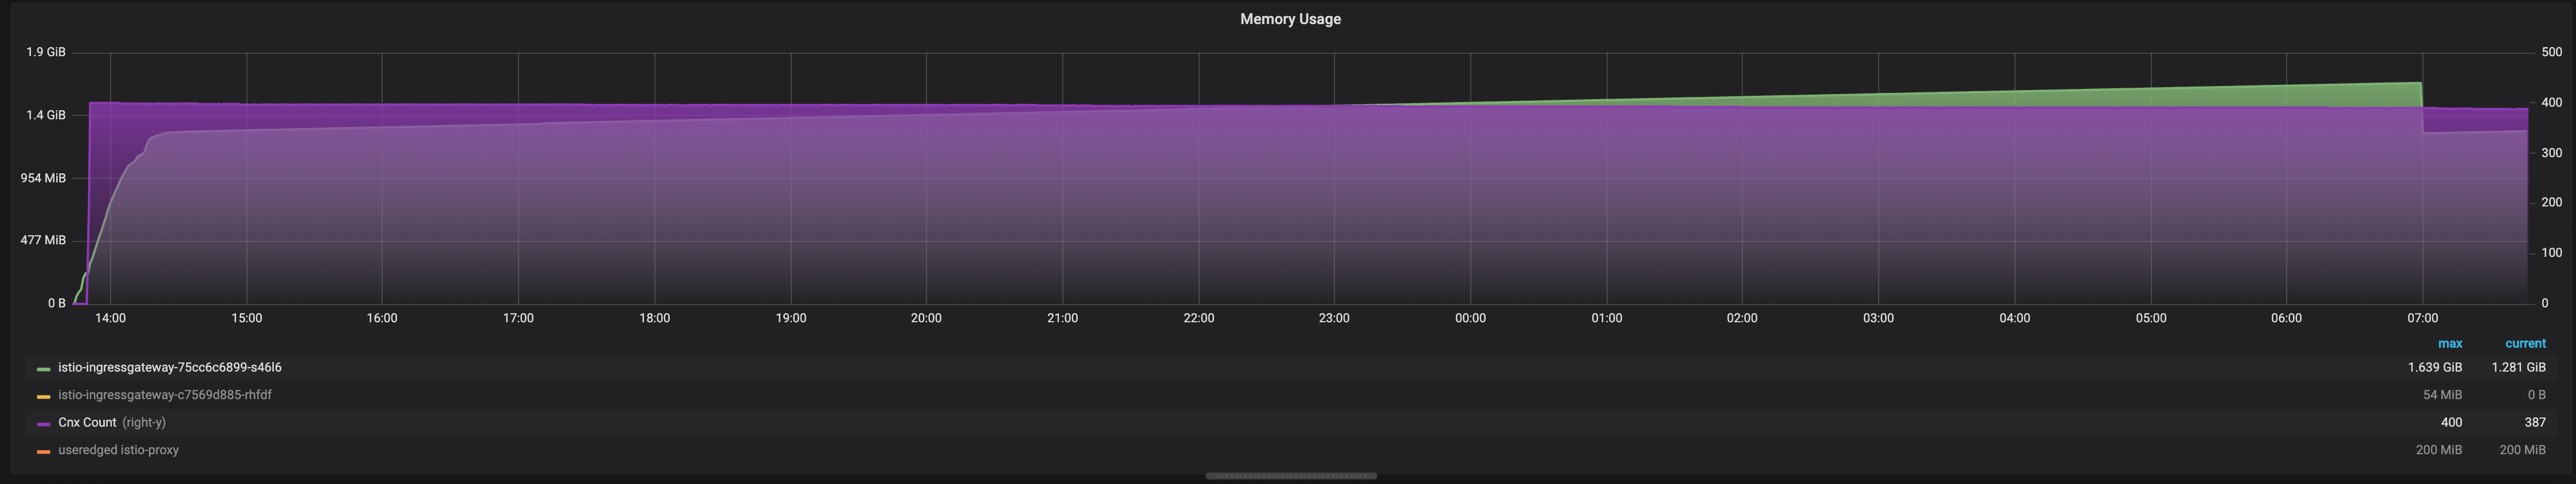
prune998
on 5 Nov 2019
@prune998 let's debug more and see if that's true. Can you minimize a reproducer or get similar pprof as it shown in #6617?
lizan
on 5 Nov 2019
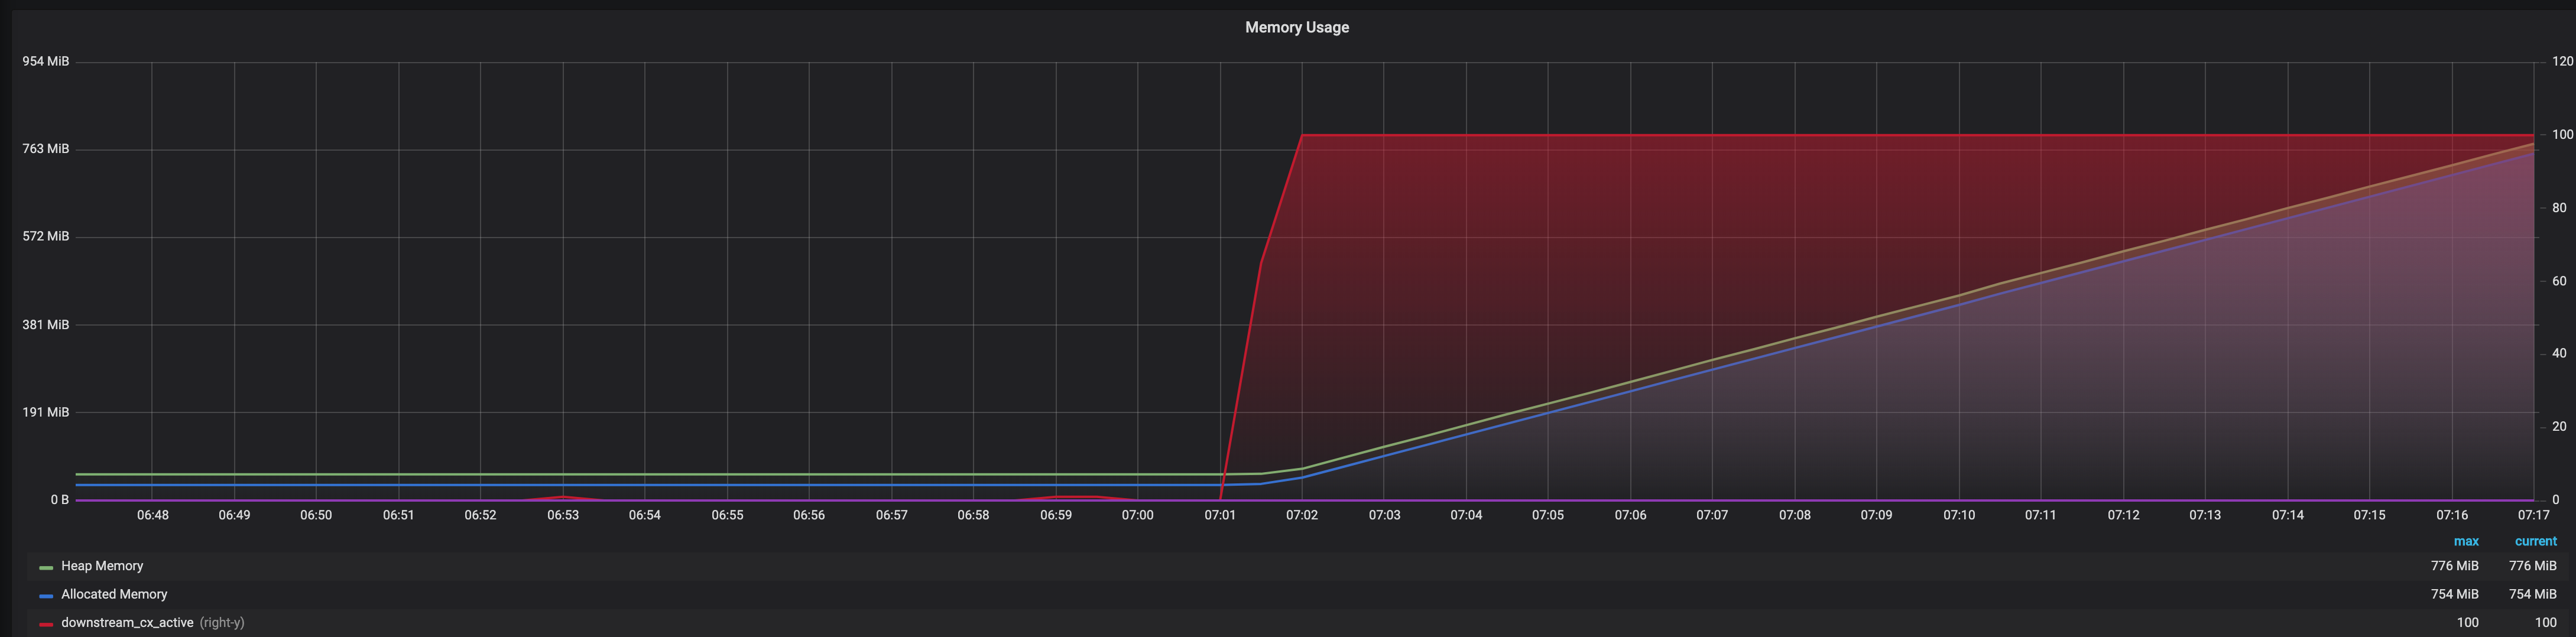
Just to add some more details :
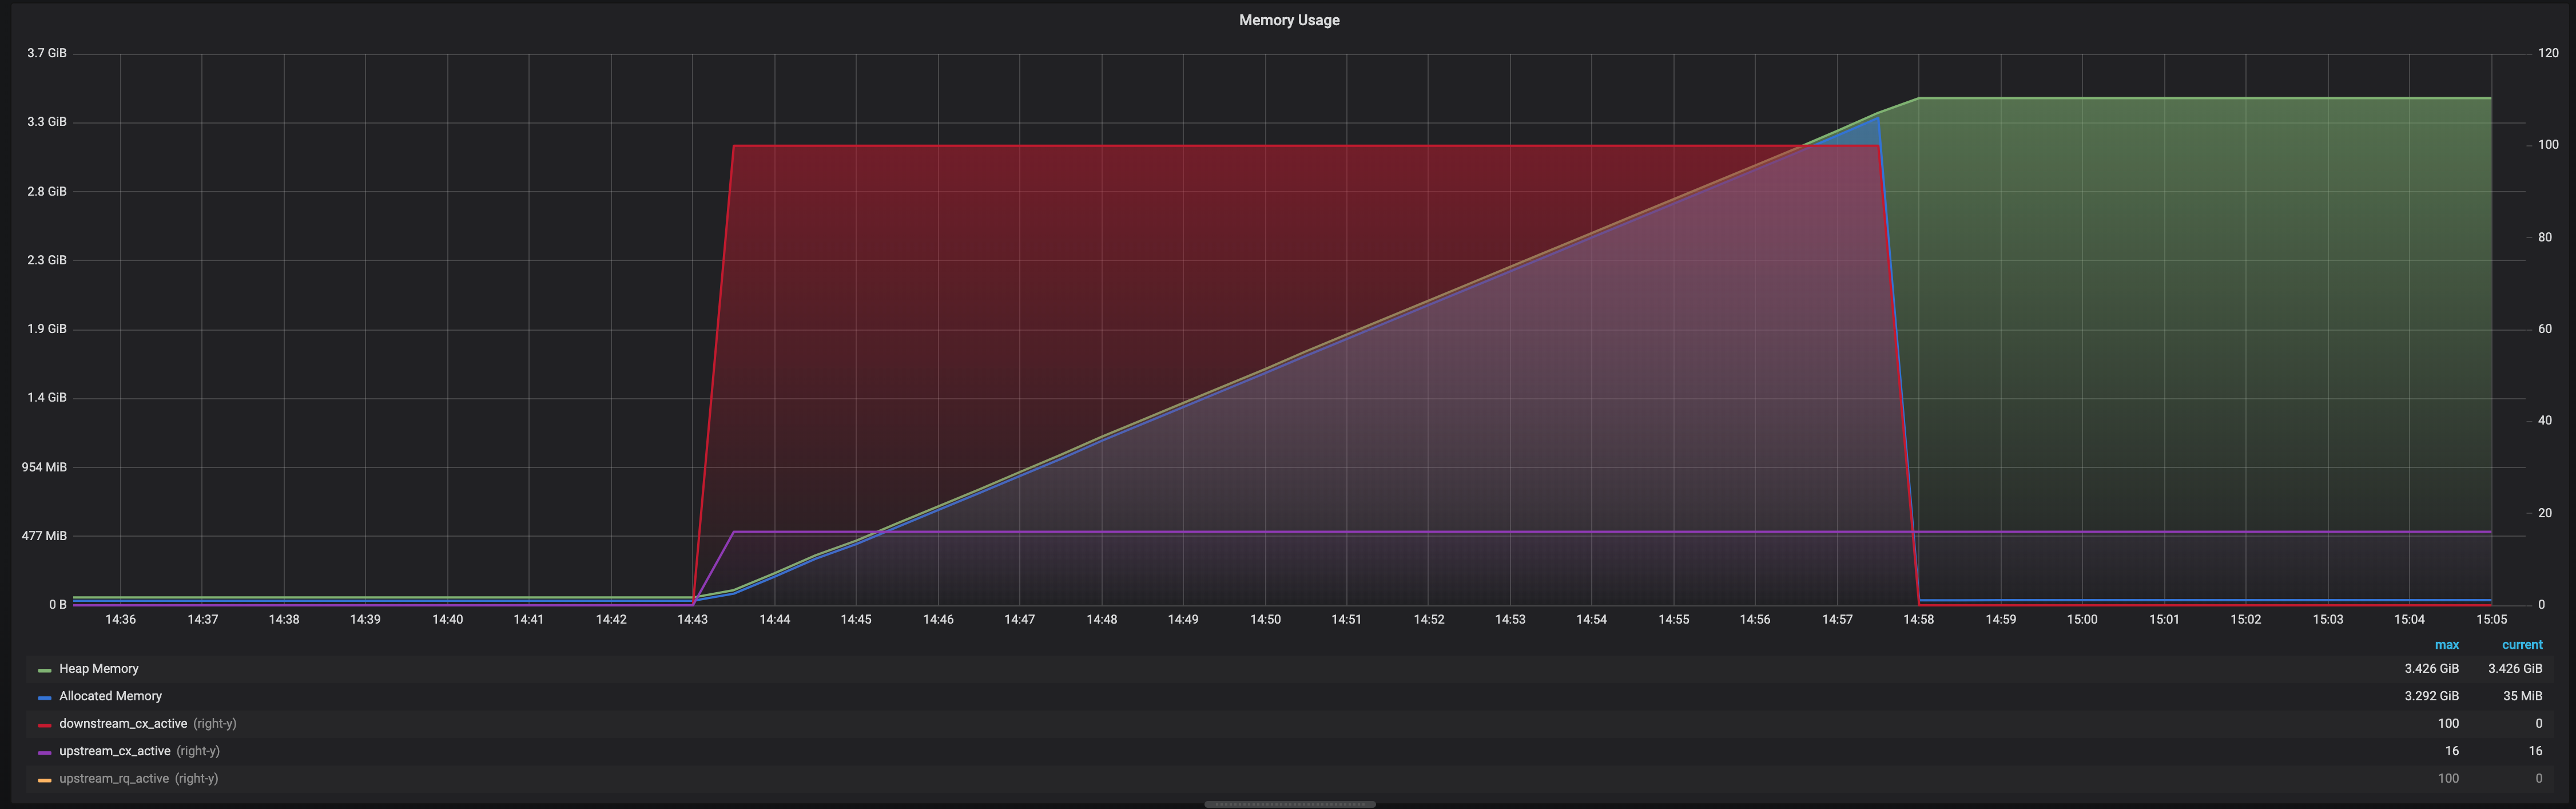
- red : number of active downstream connexions (SSL, GRPC)
- purple : upstream cnx, multiplexing the downstream cnx (GRPC no SSL)
- orange, not shown, active requests = number of streams to upstream = number of active downstream
- green : Heap memory used
- blue : Allocated memory
All these coming from Envoy stats.
I see two issues here :
- Envoy never free memory from the Heap (even after TCP cnx are gone, even after removing the upstream server...)
- Envoy keeps requesting more and more memory when new data come through the HTTPS connexion
As pointed by @lizan it really feels like issue related at https://github.com/envoyproxy/envoy/issues/6617
This is supposed to be resolved, but maybe it is still there when using HTTP/2 Streams ?
My C++ skills are too limited to dig in the code... I'm looking to build a simple client/server so this behaviour could be tested/reproduced, but any help is still welcome.
As you can see the server can use all the memory pretty quickly... 3.5Gb were used by 100 cnx sending a total of 48Mb in 10 minutes...
prune998
on 5 Nov 2019
@prune998 do you have your test client/server available some where and with the envoy config_dump? I can dig this deeper from there.
lizan
on 5 Nov 2019
I can't publish my code as it's our prod applications. But it's basic Go GRPC client/server, opening 100 of them in parallel. But I do have a GRPC test client with almost the same code, I'm working on it to make it usable to reproduce the issue.
I do have a pprof file (many in fact), I'm just too bad with pprof to get a conclusion.
Here's the output of pprof --text envoy profile.0384.heap
https://gist.github.com/prune998/cc7b490463c22c9fc1cec5468640800f
Here's the one with : pprof --text --base=profile.0001.heap envoy profile.0384.heap
https://gist.github.com/prune998/f936f00cf88717009a4d9052f42b0b11
Another with -alloc_objects
https://gist.github.com/prune998/2197b9691972172e74ab2fdfefa2c223
prune998
on 5 Nov 2019
Thanks the pprof is quite useful, I'll dig a bit more. let me know when you simple grpc client/server to reproduce this too.
lizan
on 5 Nov 2019
Hi,
My client/server is up to date at https://github.com/prune998/goHelloGrpcStream
You can use the Docker image prune/gohellogrpcstream:latest
You have 2 binaries of interrest :
loadtest_client is the client application which will open a HTTP/2 stream and send pings
greeter_server is the server that will listen on port 7788 and do nothing...
I started the client like :
/root/loadtest_client -server helloworld.my.domain:443 -tls -clients 100 -sleeptime=0.5s
The server just run /root/greeter_server without options.
As I'm in K8s + Istio, I had to deploy a Gateway, VirtualService and Certificate which you can find here and I deployed the server using this
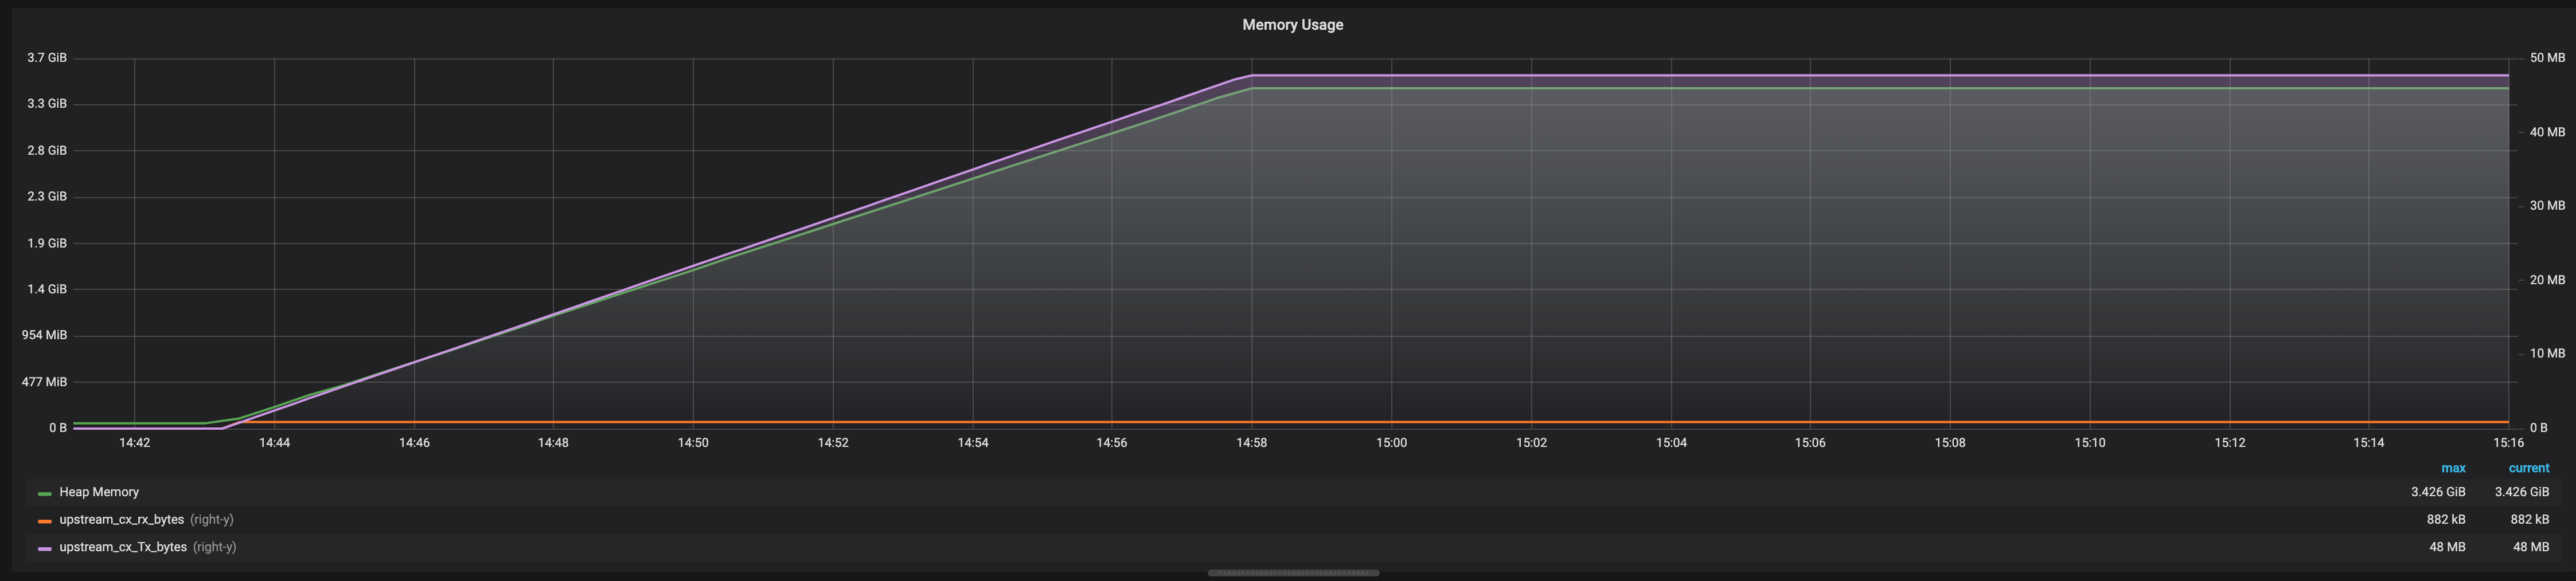
Again, with just 100 connexions sending one ping message every 0.5s, the memory usage is increasing :
prune998
on 6 Nov 2019
I have some news here : The memory consumption also happen when not using SSL at all !
i'm currently stripping the config dump to remove sensible and non-useful informations.
prune998
on 6 Nov 2019
Here's the config. Note the dump was made when greeter_server pod had no Istio sidecar, to ensure the multiplexing done by envoy gateway was not playing in this issue.
prune998
on 6 Nov 2019
I tried reproducing with plain Envoy, outside of K8s and Istio... and can't reproduce with a simplified config...
prune998
on 6 Nov 2019
@prune998 thanks for the information, this is very helpful. Based on that I don't think this is the same issue as #6617, while the root cause could be similar. I'll debug with your test server/client today.
lizan
on 6 Nov 2019
@prune998 from your istio config.json
          "route": {
           "cluster": "outbound|7788||greeter-server.alerting.svc.cluster.local",
           "timeout": "0s",
           "retry_policy": {
            "retry_on": "connect-failure,refused-stream,unavailable,cancelled,resource-exhausted,retriable-status-codes",
            "num_retries": 2,
            "retry_host_predicate": [
             {
              "name": "envoy.retry_host_predicates.previous_hosts"
             }
            ],
            "host_selection_retry_max_attempts": "5",
            "retriable_status_codes": [
             503
            ]
           },
           "max_grpc_timeout": "0s"
          },
Is the reason of the increasing memory. Try disable retry policy for your service. I can reproduce the increasing memory with the route setting above.
lizan
on 7 Nov 2019
I'll try this tomorrow morning first thing and let you know. Thanks
prune998
on 7 Nov 2019
JFYI reproducer config:
static_resources:
  listeners:
    - address:
        socket_address:
          address: 0.0.0.0
          port_value: 15001
      listener_filters:
        - name: envoy.listener.tls_inspector
      listener_filters_timeout: 0.100s
      traffic_direction: OUTBOUND
      continue_on_listener_filters_timeout: true
      filter_chains:
        - filters:
            # If the request is HTTP it will pass through this HTTP filter
            - name: envoy.http_connection_manager
              typed_config:
                "@type": type.googleapis.com/envoy.config.filter.network.http_connection_manager.v2.HttpConnectionManager
                stat_prefix: http
                route_config:
                  name: route
                  virtual_hosts:
                    - name: backend
                      domains:
                        - "*"
                      routes:
                        - match:
                            prefix: "/"
                          route:
                            cluster: grpc_service
                            timeout: 0s
                            retry_policy:
                              retry_on: connect-failure,refused-stream,unavailable,cancelled,resource-exhausted,retriable-status-codes
                              num_retries: 2
                              retry_host_predicate:
                                - name: envoy.retry_host_predicates.previous_hosts
                              host_selection_retry_max_attempts: "5"
                              retriable_status_codes:
                                - 503
                http_filters:
                  - name: envoy.router
                access_log:
                  - name: envoy.file_access_log
                    typed_config:
                      "@type": type.googleapis.com/envoy.config.accesslog.v2.FileAccessLog
                      path: "/dev/stdout"
  clusters:
    - name: grpc_service
      connect_timeout: 1s
      type: strict_dns
      dns_lookup_family: V4_ONLY
      lb_policy: round_robin
      http2_protocol_options: {}
      load_assignment:
        cluster_name: grpc_service
        endpoints:
          - lb_endpoints:
              - endpoint:
                  address:
                    socket_address:
                      address: 127.0.0.1
                      port_value: 7788
admin:
  access_log_path: "/dev/stdout"
  address:
    socket_address:
      address: 0.0.0.0
      port_value: 15000
@lizan looking at the Envoy config I don't see anything incorrect about the way Istio is producing the listeners. Are you hinting at misconfiguration or bug in Envoy which gets exposed via this config?
 nrjpoddar
on 7 Nov 2019
nrjpoddar
on 7 Nov 2019
@nrjpoddar No, IMO this is not a bug in Envoy in Istio, it is more misconfiguration of Istio, just like the doc says https://istio.io/docs/concepts/traffic-management/#retries:
Like timeouts, Istio’s default retry behavior might not suit your application needs in terms of latency (too many retries to a failed service can slow things down) or availability.
So for this service, the retry policy need to be adjusted.
lizan
on 7 Nov 2019
However I think it is possible to make router not to buffer request anymore in certain case, if it can't be retried anyway. Such as server already started response stream. WDYT? @mattklein123 @snowp
lizan
on 7 Nov 2019
I think you pointed the right thing @lizan.
I changed the VirtualService like :
apiVersion: networking.istio.io/v1alpha3
kind: VirtualService
metadata:
  name: vs-helloworld
spec:
  gateways:
  - gw-helloworld
  hosts:
  - helloworld.my-domain.com
  http:
  - match:
    - uri:
        prefix: /
    retries:
      attempts: 0                          <-----------------------------
    route:
    - destination:
        host: greeter-server
        port:
          number: 7788
and the memory problem is gone.
The way I understand this is that when you set a retry option to the route, the whole HTTP request is buffered by Envoy.
As I'm using GRPC Streaming, the connexion never ends and the whole data, since the opening of the connexion, is buffered.
If nothing can be done to "not buffer" (ie = disable retry) on GRPC streaming connexions, I would argue to warn this behaviour in the documentation.
On the Istio side, would it be fine to not retry by default and leave it up to the user ?
At lease, could be change the doc at https://istio.io/docs/reference/config/networking/v1alpha3/virtual-service/#HTTPRetry to clearly state that :
- retry is ON by default
- you can set (must set)
attempts: 0to disable it - warn that retry + GRPC streaming does not live well together ?
I'll try to resume this on the issue on Istio's side.
Thanks again @lizan !
prune998
on 7 Nov 2019
However I think it is possible to make router not to buffer request anymore in certain case, if it can't be retried anyway. Such as server already started response stream. WDYT? @mattklein123 @snowp
@lizan that's what I was thinking. For me, Envoy keeping requests that are inherently not retry-able seems wasteful. This optimization will always be best effort I guess as there can be other scenarios/protocols where Envoy won't know when to throw away buffered requests for retries.
nrjpoddar
on 7 Nov 2019
Maybe just stop buffering if the buffer get too big or the connexion last for too long ?
prune998
on 7 Nov 2019
There are options for limiting the size of the buffer used for retries: https://github.com/envoyproxy/envoy/pull/8574
It seems like we won't ever retry if the downstream response has started, so it seems like it would make sense to also stop buffering in that case, maybe even clearing out the decoding buffer. @alyssawilk might have thoughts here
That said, I can imagine certain gRPC bidi streams being set up to send a very large amount of upstream frames before ever receiving a response, in which case you'd have to rely on either disabling retries or setting the buffer limit at a reasonable level.
 snowp
on 7 Nov 2019
snowp
on 7 Nov 2019
What are your thinkings on the fact that Envoy never free the memory ?
Like if one client make a "huge" 1Gb request, Envoy process will consume 1Gb of memory until it is restarted ?
At least I've never seen release any memory yet, even after some days without any requests...
prune998
on 7 Nov 2019
It seems like we won't ever retry if the downstream response has started, so it seems like it would make sense to also stop buffering in that case, maybe even clearing out the decoding buffer. @alyssawilk might have thoughts here
Agreed, though it's hard to magically know about streaming requests, there are signals we can use to drop the buffer. Please open a fresh issue on this, this issue is too long and confused.
What are your thinkings on the fact that Envoy never free the memory ?
This is a well known behavior of tcmalloc, it does not typically like to give memory back to the OS. You need to either limit the amount of memory Envoy consumes in the first place and/or you can try configuring the overload action that actively tries to release memory (which may or may not be effective depending on fragmentation).
mattklein123
on 7 Nov 2019
Closing as answered, please open a fresh issue for enhancement etc.
lizan
on 12 Nov 2019
any update on this? or any new issue?
 danlanxiaohei
on 25 Feb 2020
danlanxiaohei
on 25 Feb 2020
Related issues
 phlax
·
3Comments
phlax
·
3Comments
 rshriram
·
3Comments
rshriram
·
3Comments
 alkov-ibm
·
3Comments
alkov-ibm
·
3Comments
 hawran
·
3Comments
hawran
·
3Comments
 boncheo
·
3Comments
boncheo
·
3Comments
Most helpful comment
any update on this? or any new issue?