Electron-react-boilerplate: Question: Debugging Main/Renderer Processes
how to debug main thread or node code?
i set
"start-hot": "cross-env HOT=1 NODE_ENV=development electron --debug-brk=5858 -r babel-register -r babel-polyfill ./main.development",
but it does`t work ?
how can i do?
 gorphensu
All 43 comments
Use the developer tools.
https://github.com/chentsulin/electron-react-boilerplate#devtools
 amilajack
on 28 Sep 2016
amilajack
on 28 Sep 2016
@amilajack but the main.js file? how to debug? and i cannot find it in the devtools
gorphensu
on 28 Sep 2016
At the moment I'm not sure how to do this. We should make this a high priority. There are plans to hot reload the main thread. But i'm not sure if its possible to run to run the debugger on the main thread just yet. It may be possible.
amilajack
on 28 Sep 2016
From what I've found, you need to setup an external debugger.
amilajack
on 28 Sep 2016
I can't figure this out either
 andrewjaykeller
on 30 Sep 2016
andrewjaykeller
on 30 Sep 2016
Electron has a number of shortcomings when it comes to development experience. For me, two major issues are the developer tools not having fully-working integration (specifically the debugger) and the lack of tooling/discussion on debugging the main thread. But I think that eventually the community will provide idiomatic ways or built-in support for these issues. But at the moment, current solutions seem super hacky.
amilajack
on 30 Sep 2016
Setting up debugging for the main.js file is honestly more work than debugging blind. It's truly ridiculous. Wasted 6 hours and still couldn't get the debugging up. A solution would be great, but I'm sure it will not come easy.
 Slapbox
on 7 Oct 2016
Slapbox
on 7 Oct 2016
Lets merge this discussion into https://github.com/chentsulin/electron-react-boilerplate/issues/379
amilajack
on 5 Nov 2016
Yea i have spent numerous hours trying to get this to work too @Slapbox :/
andrewjaykeller
on 6 Nov 2016
@aj-ptw Your best bet it to just use console.log() statements as much as possible and refer to your terminal for the output.
Unless it's formally integrated into the boilerplate, I've just come to terms with the fact that I'm going to have to live without it.
Slapbox
on 7 Nov 2016
Unless it's formally integrated into the boilerplate, I've just come to terms with the fact that I'm going to have to live without it.
A fix for this is being worked on at the moment. We will be using node-inspector to debug the main process. Also integration with vs code and atom will be provided for the client and sever side.
amilajack
on 14 Nov 2016
@amilajack that will be awesome. I'm looking forward to it. Thanks as always for all your hard work.
Slapbox
on 20 Nov 2016
@amilajack any update about this feature ?
 ritz078
on 9 Dec 2016
ritz078
on 9 Dec 2016
so many console.log() hahah
andrewjaykeller
on 9 Dec 2016
@ritz078 sorry for the delay on this. I've been looking into this for a while because its something I'm really excited for. I'll look into this over winter break
amilajack
on 10 Dec 2016
@amilajack happy to look too, just don't know where to start but if you're able to get a PR with what your thinking I'm glad to jump in. I really really need this haha
andrewjaykeller
on 10 Dec 2016
Guys I think this and hot reloading main process are the biggest bottleneck for developing project in this boilerplate. It turns out to be very irritating while development 😭
ritz078
on 14 Dec 2016
@ritz078 would be great if you or anyone else could PR for this. At the moment, I dont have much time. But expect a PR for this from me during late december or early january if one hasnt been made already. Also is node even hot-reload'able? I'm only aware of hot reloading react.
amilajack
on 14 Dec 2016
I got Webstorm's debugger working by removing babel-specific features from the background process files and running main.dev.js directly with electron / node.
The features I lost:
- ES6 module syntax, have to use
require() - FlowType
- async/await (should be here pretty soon though)
All other ES6/ES7 features I'd use babel for seem already covered by node, so the tradeoff was worth it for me. The best part is, I can still use webpack + babel to build an optimized production version of the app.
This is the setup:
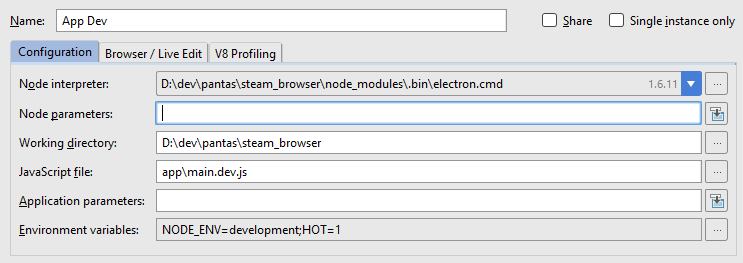
I start this configuration from Webstorm (with or without debugger), then run npm run hot-updates-server from a terminal. I can restart the main process freely as I make changes, or put it on nodemon, whatever.
IMO this is a good option for people who need to do a lot of development in the background process, or don't care about FlowType.
 panta82
on 9 Jul 2017
panta82
on 9 Jul 2017
@panta82, very cool. Thanks for sharing
Slapbox
on 19 Jul 2017
Thanks @panta82! I got debug running on PhpStorm (is Webstorm) via your method.
For others attempting the same, I have made a branch on a fork that shows what I changed (not a lot): https://github.com/chentsulin/electron-react-boilerplate/compare/master...DaanBroekhof:debug-main-process
In the current master, starting the renderer process is now npm run start-renderer-dev instead of hot-updates-server.
 DaanBroekhof
on 13 Oct 2017
DaanBroekhof
on 13 Oct 2017
I DONT CARE ABOUT FLOW TYPE AND DO A LOT OF DEVELOPMENT ON BACKGROUBD PROCESSES AND I USE WEBSTORM
Holllaaa thanks!!
andrewjaykeller
on 14 Oct 2017
I know this is a super old issue, but in case anyone stumbles here by way of Google: electron added main process debugging a while back. Practically, the way to debug the main process is to add --inspect=5858 to start-main-dev in package.json. Since this was solved upstream, this issue can probably be closed.
 nessup
on 24 Mar 2018
nessup
on 24 Mar 2018
Thanks @panta82! I got debug running on PhpStorm (is Webstorm) via your method.
For others attempting the same, I have made a branch on a fork that shows what I changed (not a lot): master...DaanBroekhof:debug-main-process
In the current master, starting the renderer process is now
npm run start-renderer-devinstead of hot-updates-server.
It's working by your method, do you know why need change the "import.. from..." to require() but original project don't need the change?
 PitterL
on 15 Nov 2018
PitterL
on 15 Nov 2018
I really don't think this should be closed as all that is being debugged is the Main process and not the renderer process.
This works to debug the main
"start-main-dev": "cross-env HOT=1 NODE_ENV=development electron $NODE_DEBUG_OPTION -r @babel/register ./app/main.dev.js",
The renderer process though is still not picking up on debugging even after
"start-renderer-dev": "cross-env NODE_ENV=development webpack-dev-server $NODE_DEBUG_OPTION --config configs/webpack.config.renderer.dev.babel.js",
 iyobo
on 28 Feb 2019
iyobo
on 28 Feb 2019
Debug both main and renderer
I had to browse through several posts (not only #428 and #528) until it worked for me with the current version, so here is a setup which worked in VS Code, at least with the current master (63cebabb467400c910acf51fa7a0b9285b7bff22)
In package.json add extra script:
"start-main-debug": "yarn start-main-dev --inspect=5858 --remote-debugging-port=9223"
In webpack.config.renderer.dev.babel.js:
Change noInfo in devServer from true to false
In launch.json:
{
  "version": "0.2.0",
  "configurations": [
      {
          "type": "node",
          "request": "launch",
          "name": "Electron: Main",
          "protocol": "inspector",
          "runtimeExecutable": "yarn",
          "runtimeArgs": [
              "start-main-debug"
          ],
          "preLaunchTask": "Start Webpack Dev"
      },
      {
        "name": "Electron: Renderer",
        "type": "chrome",
        "request": "attach",
        "port": 9223,
        "webRoot": "${workspaceFolder}",
        "timeout": 15000
      }
  ],
  "compounds": [
      {
          "name": "Electron: All",
          "configurations": [
              "Electron: Main",
              "Electron: Renderer"
          ]
      }
  ]
}
In targets.json:
{
  "version": "2.0.0",
  "tasks": [
    {
      "type": "npm",
      "label": "Start Webpack Dev",
      "script": "start-renderer-dev",
      "options": {
        "cwd": "${workspaceFolder}"
      },
      "isBackground": true,
      "problemMatcher": {
        "owner": "custom",
        "pattern": {
          "regexp": "____________"
        },
        "background": {
          "activeOnStart": true,
          "beginsPattern": "Compiling\\.\\.\\.$",
          "endsPattern": "(Compiled successfully|Failed to compile)\\.$"
        }
      }
    }
  ]
}
 Do-do-new
on 14 Apr 2020
Do-do-new
on 14 Apr 2020
What @Do-do-new said works for me, only if I changed
targets.json
to
tasks.json
Awesome! Thank you!
 pialin
on 3 Jun 2020
pialin
on 3 Jun 2020
Anybody have an idea on how to do this with Webstorm?
 ethanbonin
on 24 Jun 2020
ethanbonin
on 24 Jun 2020
Anybody have an idea on how to do this with Webstorm?
Webstorm hardly ever gets any love because it's paid.
I think it would be worth it at this point for JetBrains to have vscode run settings be consumable by their IDE.
iyobo
on 24 Jun 2020
Anybody have an idea on how to do this with Webstorm?
Webstorm hardly ever gets any love because it's paid.
I think it would be worth it at this point for JetBrains to have vscode run settings be consumable by their IDE.
It's true. What a fantastic idea!
ethanbonin
on 24 Jun 2020
Has anybody figured out how to connect it to the renderer? I used @Do-do-new file configuration, but it only working for the main process and not the renderer.
ethanbonin
on 24 Jun 2020
Has anybody figured out how to connect it to the renderer? I used @Do-do-new file configuration, but it only working for the main process and not the renderer.
@ethanbonin
Are you using compound configuration (Electron: All) when starting? Okay, it is a stupid question, but anyway.
If yes, have you also tried debugging renderer-only?
P.S. I will check the possibility to do it with Webstorm, even though it is in general not free, but it offers better refactoring support (at least, in my experience) and there is also EAP (early access program)
Do-do-new
on 25 Jun 2020
@Do-do-new, yes. I have tried Electron-All. I actually have tried the single Electron-Renderer by itself. .
But just looking at the configuration. It’s just attaching itself to the chrome. So I don’t know how that would help without starting the electron app. 😳
ethanbonin
on 25 Jun 2020
@Do-do-new, yes. I have tried Electron-All. I actually have tried the single Electron-Renderer by itself. .
But just looking at the configuration. It’s just attaching itself to the chrome. So I don’t know how that would help without starting the electron app. 😳
@ethanbonin
Unravel launch.json, the first part, Electron: Main. It has runtime argument, start-main-debug.
Which in turn calls start-main-dev. Which in turn starts electron app.
(you can see that in package.json of the boilerplate).
As for the renderer, it is started as a task before Main, see preLaunchTask.
Do-do-new
on 25 Jun 2020
@ethanbonin @iyobo
As for the webstorm, also doable. The only problem is that I couldn't find a possibility to run "Before launch" task in backround, so you have to start renederer manually.
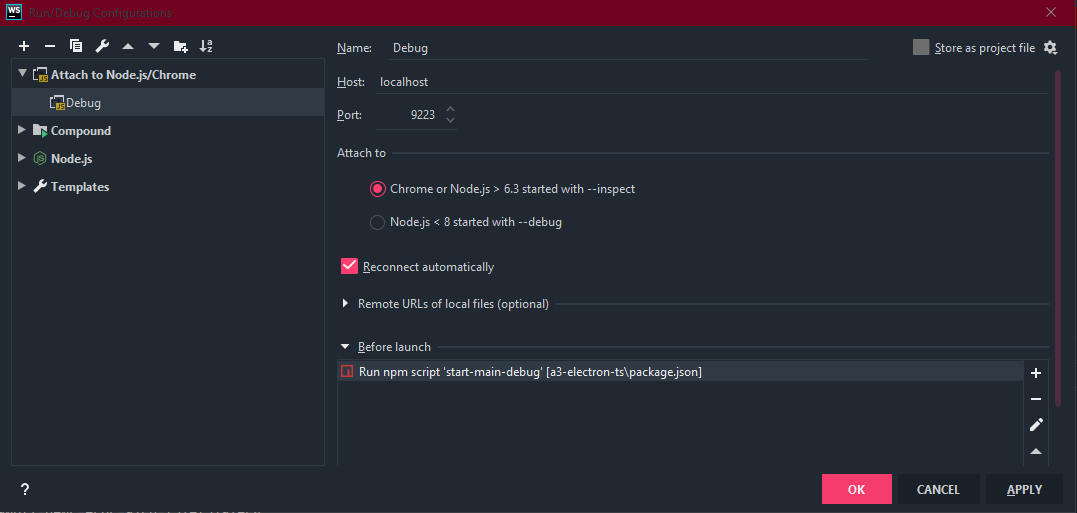
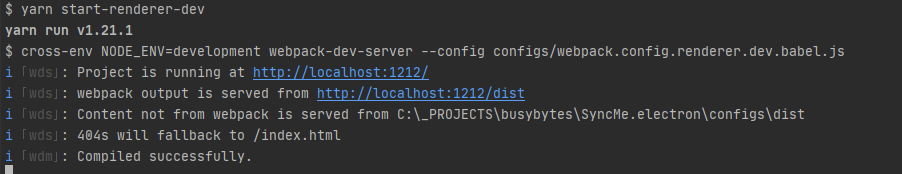
So.
1) run (and allow to keep running) yarn start-renderer-dev
2) Add two configurations, one npm, one Attach to Node.js/Chrome.
npm should run start-main-debug (I prefer yarn, but configuration is still called npm)
Attaching should connect to 9223.
3) Start both of them clicking on debug icon. (for the attaching you will be asked to choose page to debug)
OR use compound configuration which will start both
That's it.
Here are screenshots and correspondent run configs (they are normally in .run as separate files, but they won't work without referencing in .idea/workspace.xml. so I suggest following the screenshots).
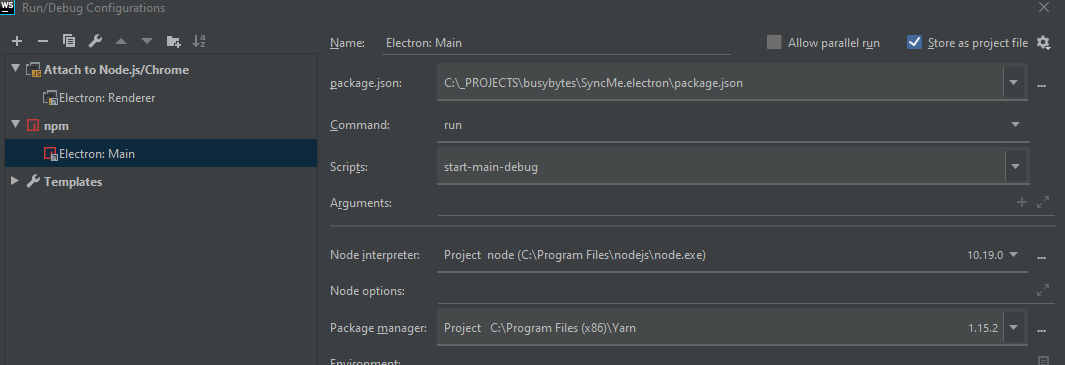
<component name="ProjectRunConfigurationManager">
<configuration default="false" name="Electron: Main" type="js.build_tools.npm">
<package-json value="$PROJECT_DIR$/package.json" />
<command value="run" />
<scripts>
<script value="start-main-debug" />
</scripts>
<node-interpreter value="project" />
<envs />
<method v="2" />
</configuration>
</component>
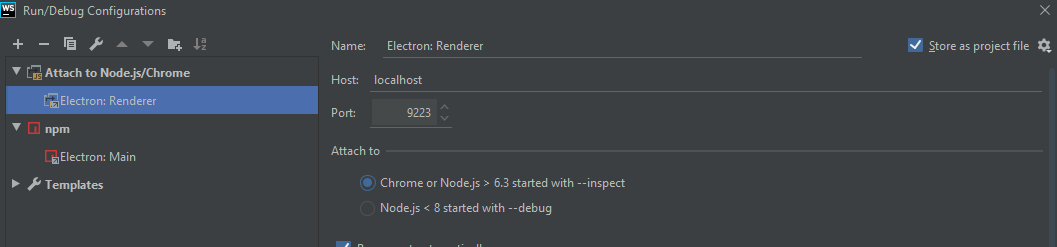
<component name="ProjectRunConfigurationManager">
<configuration default="false" name="Electron: Renderer" type="ChromiumRemoteDebugType" factoryName="Chromium Remote" port="9223" restartOnDisconnect="true">
<method v="2" />
</configuration>
</component>
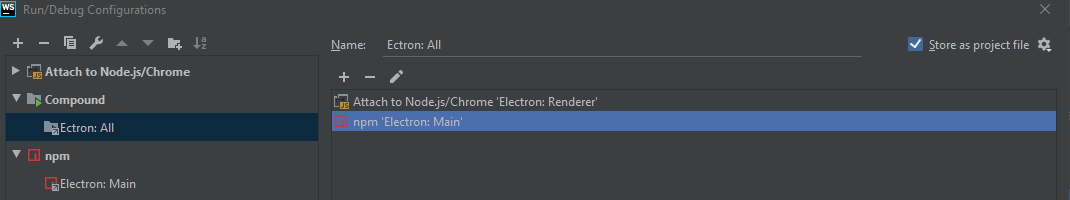
<component name="ProjectRunConfigurationManager">
<configuration default="false" name="Ectron: All" type="CompoundRunConfigurationType">
<toRun name="Electron: Main" type="js.build_tools.npm" />
<toRun name="Electron: Renderer" type="ChromiumRemoteDebugType" />
<method v="2" />
</configuration>
</component>
@Do-do-new, that is pretty slick. Here's what I got. What I did is created the Attach to Node.js/Chrome configuration. I then added in the Before Launch the NPM script to run start-main-debug
__NOTE: This configuration, doesn't work.__
<component name="ProjectRunConfigurationManager">
  <configuration default="false" name="Debug" type="ChromiumRemoteDebugType" factoryName="Chromium Remote" port="9223" restartOnDisconnect="true">
    <method v="2">
      <option name="NpmBeforeRunTask" enabled="true">
        <package-json value="$PROJECT_DIR$/package.json" />
        <command value="run" />
        <scripts>
          <script value="start-main-debug" />
        </scripts>
        <node-interpreter value="project" />
        <envs />
      </option>
    </method>
  </configuration>
</component>
@ethanbonin
Is it working for you?
Because, first, I don't see where you run renderer, second, I don't see how webstorm could attach to main here, and we discuss debugging both in parallel...
We have two processes in fact in any electron app. Main and Renderer.
We need to run both and to debug both.
Pre-launch tasks have nothing to do with debugging - they are just tasks to be done before debugging. Compiling, ensuring DB is running etc.
So you are not debugging main here. You are only starting it. And you can't attach to renderer because you are not starting it.
Do-do-new
on 25 Jun 2020
@Do-do-new, You're totally right.
ethanbonin
on 25 Jun 2020
@Do-do-new, I was able to get your main debug process working. The breakpoints work on the Main, but I can't seem to get it to work on the renderer. Any ideas?
ethanbonin
on 25 Jun 2020
@ethanbonin
Is your electron app displayed correctly? I mean, is renderer process running okay?
I ensure by running it explicitly (in case of webstorm) and with task in case of VS Code.
If yes, then you need to attach to it properly. When running compound configuration, the renderer part will ask you to select to what you want to attach. Select you app. For me it looks something like this:
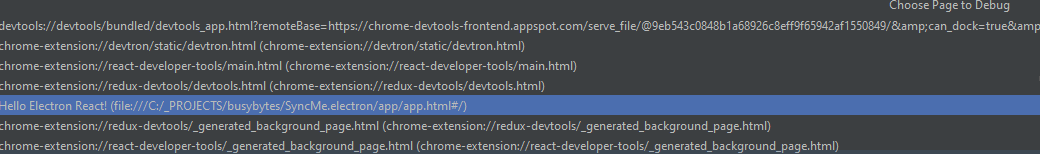
Do-do-new
on 25 Jun 2020
@Do-do-new, When I run yarn dev or yarn start-renderer-dev without the debugger, everything works great. The main and the renderer both work and display the app.
It gives me this weird bug when I try to run the Electron: All in debug and the renderer part never asks what to attach to.

Here are my run configuration files:
<!-- Electron Main-->
<component name="ProjectRunConfigurationManager">
  <configuration default="false" name="Electron: Main" type="js.build_tools.npm">
    <package-json value="$PROJECT_DIR$/package.json" />
    <command value="run" />
    <scripts>
      <script value="start-main-debug" />
    </scripts>
    <node-interpreter value="project" />
    <envs />
    <method v="2" />
  </configuration>
</component>

<!-- Electron Renderer-->
<component name="ProjectRunConfigurationManager">
  <configuration default="false" name="Electron: Renderer" type="ChromiumRemoteDebugType" factoryName="Chromium Remote" port="9223" restartOnDisconnect="true">
    <method v="2" />
  </configuration>
</component>

<!-- Electron All-->
<component name="ProjectRunConfigurationManager">
  <configuration default="false" name="Ectron: All" type="CompoundRunConfigurationType">
    <toRun name="Electron: Main" type="js.build_tools.npm" />
    <toRun name="Electron: Renderer" type="ChromiumRemoteDebugType" />
    <method v="2" />
  </configuration>
</component>
Just to ensure, here is my package.json scripts
{
   "start-main-debug": "yarn start-main-dev --inspect=5858 --inspect-brk=9223 --remote-debugging-port=9223",
    "start-main-dev": "cross-env START_HOT=1 NODE_ENV=development electron -r ./internals/scripts/BabelRegister ./app/main.dev.ts",
    "start-renderer-dev": "cross-env NODE_ENV=development webpack-dev-server --config configs/webpack.config.renderer.dev.babel.js",
}
and I set inside webpack.config.renderer.dev.babel.js devServer: {noInfo: false} to false. Do you see anything I'm missing?
I truly appreciate your help by the way!
ethanbonin
on 25 Jun 2020
@ethanbonin
The only difference I see is that you use --inspect-brk=9223 (don't know what it is though).
Funny, I now cloned currect version of the boilerplate and they update the setup with .vscode settings which are discussed here.
I will check if it works and create fork with webstorm settings.
Do-do-new
on 25 Jun 2020
@ethanbonin
Just re-cloned boilerplate.
Current version (2e85c08438ef209ff9dcb636056628abb9f7aa99) also works without any extra magic (just what I described for Webstorm VS code works right away).
The only thing is that after yarn install I had to restart the PC, attaching wasn't working for some reason until I did so.
Do-do-new
on 25 Jun 2020
Related issues
 ghost
·
20Comments
ghost
·
20Comments
 Vasniktel
·
30Comments
Slapbox
·
19Comments
amilajack
·
22Comments
amilajack
·
19Comments
Vasniktel
·
30Comments
Slapbox
·
19Comments
amilajack
·
22Comments
amilajack
·
19Comments
Most helpful comment
Setting up debugging for the main.js file is honestly more work than debugging blind. It's truly ridiculous. Wasted 6 hours and still couldn't get the debugging up. A solution would be great, but I'm sure it will not come easy.