Electricitymap-contrib: Double counting of emissions
Since you include emission from import from a country who already have counting its emission in their country the sum from each country will be higher than real. I have looked on Sweden and see that you calcukate the produktion in Sweden plus add import even if we export more.
Please explain
 yrrahknarf
All 14 comments
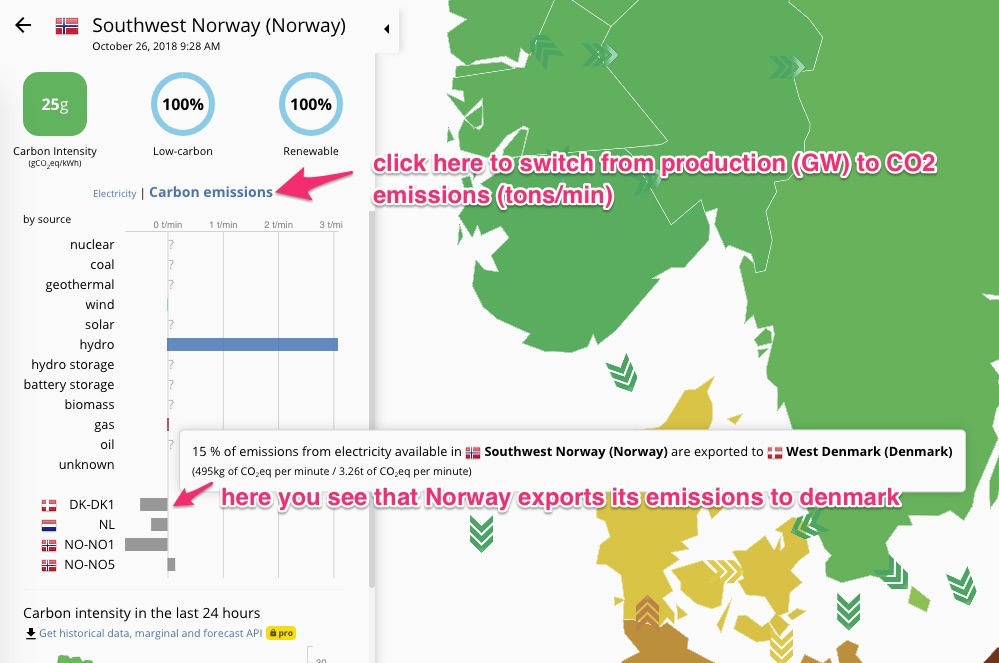
I don't believe we double count, have a look at the screenshot below from right now (but let me know if there is still something unclear, or that i might have missed!)
 brunolajoie
on 26 Oct 2018
brunolajoie
on 26 Oct 2018
To calculate the carbon intensity for exports, the carbon intensity for all production and imports is calculated. I think that you think it is double counting because you can get some high carbon fuel contributing to a higher carbon intensity in both the exporting country and the importing country. But I think this is OK because the carbon intensity is an weighted average value (gCO2eq/kWh).
 lorrieq
on 26 Oct 2018
lorrieq
on 26 Oct 2018
Lets us make a simple example:
Sweden have from their produktion 40 g and export only to Finland
Finland 200 g from their produktion and 5 from import from Sweden total 205.
Electricity map gives 40 + 205 = 245 g but the emission to the air 240 g
yrrahknarf
on 26 Oct 2018
Hi @yrrahknarf,
For your simple example, electricityMap doesn't do 40 + 205, but instead does a weighted average based on the amount imported and the amount produced. With 10% imports it would be 0.9 * 200 + 0.1 * 5 = 180.5 g/kWh for electricity consumed in Finland. There's not double counting as the sum of all carbon intensities multiplied by all consumptions is equal to the total amount emitted.
For a more detailed explanation, see https://github.com/tmrowco/electricitymap-contrib/blob/master/CO2eq%20Model%20Explanation.ipynb
A paper is soon being published by the way.
 corradio
on 26 Oct 2018
corradio
on 26 Oct 2018
I think the other point is that where Electricity Map gives the headline number as "64g" (for example Sweden right now), you have to note the smaller print with units: gCO2eq/kWh. That means that while Sweden is "64g" and Finland "250g", their emissions added up aren't "314g", because the emissions depend on kWh consumed in the two countries.
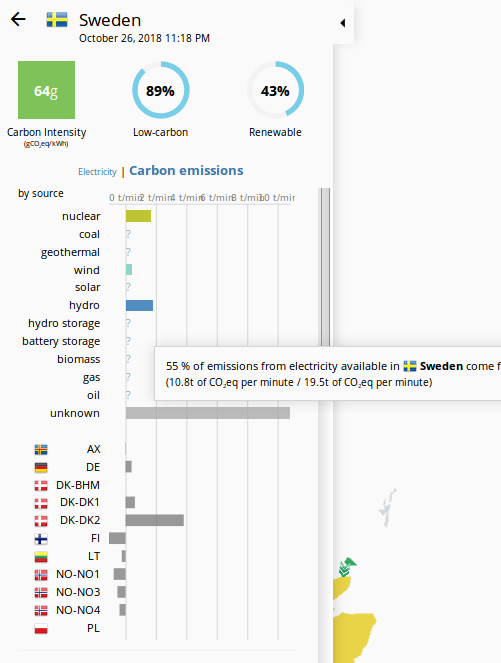
But I do have a possibly related question: in the Carbon emissions view, where the unit is tons CO2eq per minute, the exports aren't subtracted from the total, are they? See screenshot - the total "19.5t of CO2eq per minute" includes the imported values, but doesn't seem to have subtracted the exported values.
 jarek
on 27 Oct 2018
jarek
on 27 Oct 2018
Hi @jarek,
That's right, the % of emissions shown in your screenshot is based on the
total influx of carbon (without exports/storage).
That's what we mean by "electricity available". Some of it will be exported.
The reason we do that is to be able to showcase an equivalent tooltip for
exported values, that shows which % of electricity available is exported.
This is done to stay consistent with the electricity view.
To be clear, this doesn't mean we're double counting.
On Sat, Oct 27, 2018 at 1:30 AM jarek notifications@github.com wrote:
I think the other point is that where Electricity Map gives the headline
number as "64g" (for example Sweden right now), you have to note the
smaller print with units: gCO2eq/kWh. That means that while Sweden is "64g"
and Finland "250g", their emissions added up aren't "314g", because the
emissions depend on kWh consumed in the two countries.But I do have a possibly related question: in the Carbon emissions view,
where the unit is tons CO2eq per minute, the exports aren't subtracted from
the total, are they? See screenshot - the total "19.5t of CO2eq per minute"
includes the imported values, but doesn't seem to have subtracted the
exported values.[image: image]
https://user-images.githubusercontent.com/47415/47596622-04394d80-d977-11e8-857a-37bac007f842.png—
You are receiving this because you commented.
Reply to this email directly, view it on GitHub
https://github.com/tmrowco/electricitymap-contrib/issues/1654#issuecomment-433569093,
or mute the thread
https://github.com/notifications/unsubscribe-auth/ABlEKDY0EkGIKmwMYW4jMOQoeIXNZ5D1ks5uo5sRgaJpZM4X6w7_
.
corradio
on 28 Oct 2018
To go straight to the point:
You should have a value of emissions from electricity generation in each country. The statistical structure for reporting emissions is based on international agreements that the emissions count when they occur. The motive is that emissions within a country can be controlled. The method is used to monitor the climate targets set up within the UN, the EU and nationally for Sweden. Therefore, I think it is more valuable to highlight each country's electricity production and the associated emissions based on IPCC's value. Then we do not have any discussion about import and export.
yrrahknarf
on 28 Oct 2018
What you suggest is work in progress ;)
But let's be very clear : we're not double counting anything. If a Danish consumer consumes power at a time when DK imports from Sweden, he does consume (and should be accounted responsible for consuming) some nuclear or hydro from Sweden. So when you want to know what's the impact of your consumption, looking only at local production makes no sense. Another example: in some regions on the eMap, sometime, there is no power being produced. 100% is imported. So, if you want to know where you electricity comes from, in your region, well, you'll need to account for imports.
brunolajoie
on 28 Oct 2018
It seems will be fixed by https://github.com/tmrowco/electricitymap-contrib/issues/1554, so I'm closing this issue.
corradio
on 28 Oct 2018
Looks like this question has been posed before, just not for the matter I have in mind.
This is about energy storage. I've noticed that for Pumped Hydro Storage, its carbon intensity is based on the carbon intensity of its grid. For Germany, this figure is 348 gCO₂eq/kWh as shown on the map:
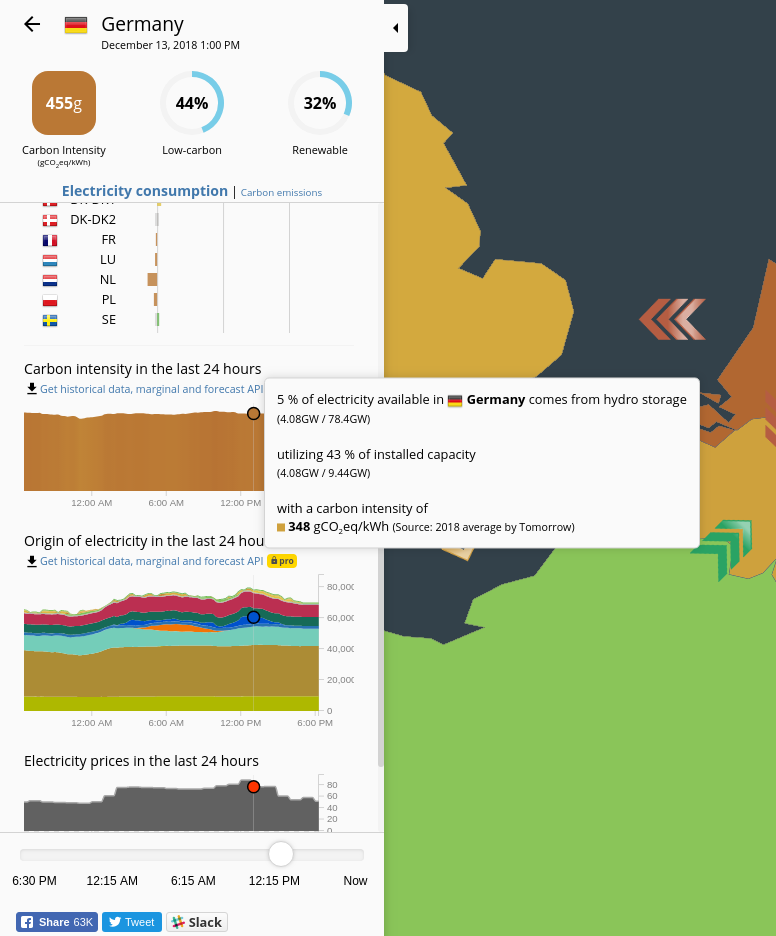
The logic is easy enough to infer: the electricity coming out of energy storage systems are only as clean as the electricity that charged them in the first place. This is something I thought about at length myself and I eventually concluded that it's best to keep the carbon intensity of energy storage systems as low as the levelized emissions required to build the system itself, much like what is done with wind and solar.
The reason for this is as follows: the emissions that went into charging these systems have already been counted when these systems were charging. Tallying the carbon intensity for energy storage is therefor double counting. While it is true that energy storage discharge brings electricity into the system that was generated in the past, the emissions that charged the system have already been emitted and discharging that energy does not cause new emissions. This system of tallying the emissions intensity is conveying that new emissions are being created by the discharge of energy storage systems.
Let me try and bring more clarity with an example. The fictional country of Kayalistan generates electricity primarily from coal. They have so much energy storage that they can afford to run the coal plants at a steady output 24/7. Their pumped hydro arsenal can simply charge up during the off-peak hours and then return the energy during the peak hours. Kayalistan has a peculiar demand profile: from 12 AM to 8 AM, their electricity demand is a flat 1,200 MW. Then, the moment the clock hits 8 AM, their demand for electricity goes up to 1,800 MW like in a step function! This continues until midnight where demand steps back down to 1,200 MW. Fortunately, Kayalistan supplements its Pumped Hydro Energy Storage arsenal with batteries and supercapacitors for just such an occasion. Because of this, Kayalistan's coal plants can afford to run continuously at 1,700 MW. Of course, not even Kayalistan has the technology to store energy without losses. It's why the power plants have to run at 1,700 MW instead of 1,600 MW if storing energy could be done at not one iota less than 100% efficiency.
From 12 AM to 8 AM, Kayalistan demands 1,200 MW of electricity. That's 9,600 MWh. During this time, the coal plants generated 13,600 MWh. Then come the peak hours. From 8 AM to 12 AM, Kayalistan is consuming electricity at 1,800 MW. That's 28,800 MWh. During that time, the coal plants generated 27,200 MWh. In the span of 24 hours, that's 38,400 MWh of demand with electricity generation by the coal plants at 40,800 MWh during that time.
But what about carbon emissions? During the off-peak hours, the 13,600,000 kWh generated from the coal plants (820 gCO₂eq/kWh) emitted 11,152 tonnes CO₂eq. Had these coal plants only done load-following at 1,200 MW, the 9,600,000 kWh demanded would have emitted only 7,872 tonnes CO₂eq from 12 AM to 8 AM. From 8 AM to 12 AM, that would be 27,200,000 kWh generated by the coal plants, thus 22,304 tonnes CO₂eq emitted. Had load following been done instead, the 28,800,000 kWh demanded would have emitted 23,616 tonnes CO₂eq. In total, running the coal plants at a steady 1,700 MW emitted 33,456 tonnes CO₂eq in 24 hours. Had load following been done instead, that figure would be 31,488 tonnes CO₂eq instead. This is to be expected given that storing energy loses energy in the process.
Quite a contrast between load following emissions in the off-peak hours and coal + energy storage emissions during that time. _What CO₂ emissions may have been saved during the peak hours was already emitted during the off-peak hours because the coal plants needed to run at a higher output than would otherwise have been necessary_. Not only that, this also accounts for energy losses already.
If anything needs clarification, please don't hesitate to ask.
 Hyric89
on 14 Dec 2018
Hyric89
on 14 Dec 2018
Hi @Hyric89,
Very good question.
the emissions that went into charging these systems have already been counted when these systems were charging
Actually, we don't count them when they charge. The consumption mix of a country excludes the electricity used for charging. Therefore, the emissions associated to the charge are ignored.
Another way to look at it is that charging electricity is considered like an export (it doesn't count towards the country's emissions).
Therefore, we don't double count.
Best,
Olivier
corradio
on 14 Dec 2018
If I'm understanding your point correctly, like with electricity exports, every kWh exported carries with it the intensity. In abstraction, what this means is that emissions are stored when charging up and then released when discharged.
Hyric89
on 16 Dec 2018
That's right!
On Sun, Dec 16, 2018 at 7:31 PM Hyric89 notifications@github.com wrote:
If I'm understanding your point correctly, like with electricity exports,
every kWh exported carries with it the intensity. In abstraction, what this
means is that emissions are stored when charging up and then released when
discharged.—
You are receiving this because you modified the open/close state.
Reply to this email directly, view it on GitHub
https://github.com/tmrowco/electricitymap-contrib/issues/1654#issuecomment-447665229,
or mute the thread
https://github.com/notifications/unsubscribe-auth/ABlEKCJIjyBMFYY6b92zENN4gaGeWwEpks5u5pF_gaJpZM4X6w7_
.
corradio
on 16 Dec 2018
We should probably write that down much more clearly in the FAQ
On Sun, 16 Dec 2018 at 19:36, Olivier Corradi notifications@github.com
wrote:
That's right!
On Sun, Dec 16, 2018 at 7:31 PM Hyric89 notifications@github.com wrote:
If I'm understanding your point correctly, like with electricity exports,
every kWh exported carries with it the intensity. In abstraction, what
this
means is that emissions are stored when charging up and then released
when
discharged.—
You are receiving this because you modified the open/close state.
Reply to this email directly, view it on GitHub
<
https://github.com/tmrowco/electricitymap-contrib/issues/1654#issuecomment-447665229
,
or mute the thread
<
https://github.com/notifications/unsubscribe-auth/ABlEKCJIjyBMFYY6b92zENN4gaGeWwEpks5u5pF_gaJpZM4X6w7_.
—
You are receiving this because you commented.
Reply to this email directly, view it on GitHub
https://github.com/tmrowco/electricitymap-contrib/issues/1654#issuecomment-447665578,
or mute the thread
https://github.com/notifications/unsubscribe-auth/AVEnG4CrjqdZ76HodCzzTye3XMykHB-9ks5u5pK8gaJpZM4X6w7_
.
brunolajoie
on 17 Dec 2018
Related issues
corradio
·
5Comments
 alixunderplatz
·
3Comments
alixunderplatz
·
3Comments
 jzlcdh
·
5Comments
corradio
·
4Comments
alixunderplatz
·
4Comments
jzlcdh
·
5Comments
corradio
·
4Comments
alixunderplatz
·
4Comments
Most helpful comment
Hi @yrrahknarf,
For your simple example, electricityMap doesn't do 40 + 205, but instead does a weighted average based on the amount imported and the amount produced. With 10% imports it would be 0.9 * 200 + 0.1 * 5 = 180.5 g/kWh for electricity consumed in Finland. There's not double counting as the sum of all carbon intensities multiplied by all consumptions is equal to the total amount emitted.
For a more detailed explanation, see https://github.com/tmrowco/electricitymap-contrib/blob/master/CO2eq%20Model%20Explanation.ipynb
A paper is soon being published by the way.