Electricitymap-contrib: Norway is grey while data is available on the left panel
- right now NO is grey (any bidding zone)
- clicking on one them shows "data not available" in the left panel
- slide back in time a bit and coming back to "now" --> data is now available, last datapoint is 10min ago, and carbon intensity is computed on the left panel.
Therefore, there's a bug: NO should not have been grey
 brunolajoie
All 16 comments
I can confirm this just now. Looks like there's some bug in the endpoint sending api/v3/state. production, co2intensity and some other keys are missing.
I was wondering if this was because the data shown in history panel has failed validation or was incorrect (as in the case of e.g. Switzerland) but that doesn't appear to be the case. Earlier today I screenshotted Norway zones being grey while reporting production, and about an hour later them being green again - the production shown in history panel was the same in both cases.
About five minutes ago we had NO3 as grey and NO5 coloured, I noted API outputs. Long stuff, sorry, please scroll to bottom for observations!
https://api.electricitymap.org/v3/state excerpt:
"NO-NO3": {
    "exchange": {
        "NO-NO1": -101.2335,
        "NO-NO4": 595.8152,
        "NO-NO5": 139.0645,
        "SE": -153.709
    },
    "price": {
        "currency": "EUR",
        "datetime": "2018-07-05T16:00:00.000Z",
        "value": 54.83
    },
    "countryCode": "NO-NO3",
    "_isFinestGranularity": true,
    "maxProduction": null,
    "totalProduction": null,
    "maxDischarge": 0,
    "maxStorage": 0,
    "totalStorage": 0,
    "totalDischarge": 0,
    "totalImport": 734.8797,
    "totalExport": 254.9425,
    "maxExport": 153.709,
    "maxImport": 595.8152,
    "totalNetExchange": 479.93719999999996,
    "maxCapacity": null,
    "maxStorageCapacity": null,
    "maxExportCapacity": 0,
    "maxImportCapacity": 0,
    "powerOriginRatio": {},
    "carbonOriginRatio": {},
    "exchangeCo2Intensities": {
        "NO-NO5": 39.50395913154534
    },
    "productionCo2Intensities": {},
    "productionCo2IntensitySources": {},
    "dischargeCo2Intensities": {},
    "dischargeCo2IntensitySources": {},
    "totalCo2Production": null,
    "totalCo2Discharge": 0,
    "totalCo2Storage": 0,
    "totalCo2Import": 5493598.324648786,
    "totalCo2Export": 0,
    "totalCo2NetExchange": 5493598.324648786
},


"NO-NO5": {
    "production": {
        "biomass": null,
        "gas": 123,
        "geothermal": null,
        "solar": null,
        "nuclear": null,
        "oil": null,
        "unknown": 5,
        "coal": null,
        "hydro": 3787,
        "wind": 0
    },
    "source": "entsoe.eu",
    "schemaVersion": 1,
    "updatedAt": "2018-07-05T16:03:37.897Z",
    "datetime": "2018-07-05T13:00:00.000Z",
    "countryCode": "NO-NO5",
    "storage": {
        "hydro": null
    },
    "exchange": {
        "NO-NO1": -1764.7312,
        "NO-NO2": -179.262,
        "NO-NO3": -139.0645
    },
    "price": {
        "currency": "EUR",
        "datetime": "2018-07-05T16:00:00.000Z",
        "value": 52.03
    },
    "_isFinestGranularity": true,
    "maxProduction": 3787,
    "totalProduction": 3915,
    "maxDischarge": 0,
    "maxStorage": 0,
    "totalStorage": 0,
    "totalDischarge": 0,
    "totalImport": 0,
    "totalExport": 2083.0577,
    "maxExport": 1764.7312,
    "maxImport": 0,
    "totalNetExchange": -2083.0577,
    "totalConsumption": 1831.9423000000002,
    "maxCapacity": null,
    "maxStorageCapacity": null,
    "maxExportCapacity": 0,
    "maxImportCapacity": 0,
    "co2intensity": 39.50395913154534,
    "fossilFuelRatio": 0.03269476372924649,
    "renewableRatio": 0.9673052362707535,
    "powerOriginRatio": {},
    "carbonOriginRatio": {},
    "exchangeCo2Intensities": {
        "NO-NO1": 39.50395913154534,
        "NO-NO2": 39.50395913154534,
        "NO-NO3": 39.50395913154534
    },
    "productionCo2Intensities": {
        "biomass": 230,
        "gas": 490,
        "geothermal": 38,
        "solar": 45,
        "nuclear": 12,
        "oil": 650,
        "unknown": 700,
        "coal": 820,
        "hydro": 24,
        "wind": 11
    },
    "productionCo2IntensitySources": {
        "biomass": "IPCC 2014",
        "gas": "IPCC 2014",
        "geothermal": "IPCC 2014",
        "solar": "IPCC 2014",
        "nuclear": "IPCC 2014",
        "oil": "UK POST 2014",
        "unknown": "assumes thermal (coal, gas, oil or biomass)",
        "coal": "IPCC 2014",
        "hydro": "IPCC 2014",
        "wind": "IPCC 2014"
    },
    "dischargeCo2Intensities": {
        "hydro": 24
    },
    "dischargeCo2IntensitySources": {
        "hydro": "IPCC 2014"
    },
    "totalCo2Production": 154658000,
    "totalCo2Discharge": 0,
    "totalCo2Storage": 0,
    "totalCo2Import": 0,
    "totalCo2Export": 82289026.24945083,
    "totalCo2NetExchange": -82289026.24945083
},
https://api.electricitymap.org/v3/history?countryCode=NO-NO3 excerpt (last two points):
{
    "data": [
    ...,
    {
        "production": {
            "nuclear": null,
            "oil": null,
            "unknown": 15,
            "coal": null,
            "hydro": 2037,
            "wind": 175,
            "biomass": null,
            "gas": 42,
            "geothermal": null,
            "solar": null
        },
        "source": "entsoe.eu",
        "schemaVersion": 1,
        "updatedAt": "2018-07-05T15:46:59.220Z",
        "datetime": "2018-07-05T12:00:00.000Z",
        "countryCode": "NO-NO3",
        "storage": {
            "hydro": null
        },
        "exchange": {
            "NO-NO1": -78.0191,
            "NO-NO4": 654.5681,
            "NO-NO5": 307.4973,
            "SE": -103.3126
        },
        "price": {
            "currency": "EUR",
            "datetime": "2018-07-05T15:00:00.000Z",
            "value": 52.97
        },
        "_isFinestGranularity": true,
        "maxProduction": 2037,
        "totalProduction": 2269,
        "maxDischarge": 0,
        "maxStorage": 0,
        "totalStorage": 0,
        "totalDischarge": 0,
        "totalImport": 962.0654,
        "totalExport": 181.3317,
        "maxExport": 103.3126,
        "maxImport": 654.5681,
        "totalNetExchange": 780.7337,
        "totalConsumption": 3049.7336999999998,
        "maxCapacity": null,
        "maxStorageCapacity": null,
        "maxExportCapacity": 0,
        "maxImportCapacity": 0,
        "co2intensity": 40.93074184984295,
        "fossilFuelRatio": 0.035205482158105636,
        "renewableRatio": 0.9642857186729493,
        "powerOriginRatio": {},
        "carbonOriginRatio": {},
        "exchangeCo2Intensities": {
            "NO-NO1": 40.93074184984295,
            "NO-NO4": 58.373671150639716,
            "NO-NO5": 39.50395913154534,
            "SE": 40.93074184984295
        },
        "productionCo2Intensities": {
            "nuclear": 12,
            "oil": 650,
            "unknown": 700,
            "coal": 820,
            "hydro": 24,
            "wind": 11,
            "biomass": 230,
            "gas": 490,
            "geothermal": 38,
            "solar": 45
        },
        "productionCo2IntensitySources": {
            "nuclear": "IPCC 2014",
            "oil": "UK POST 2014",
            "unknown": "assumes thermal (coal, gas, oil or biomass)",
            "coal": "IPCC 2014",
            "hydro": "IPCC 2014",
            "wind": "IPCC 2014",
            "biomass": "IPCC 2014",
            "gas": "IPCC 2014",
            "geothermal": "IPCC 2014",
            "solar": "IPCC 2014"
        },
        "dischargeCo2Intensities": {
            "hydro": 24
        },
        "dischargeCo2IntensitySources": {
            "hydro": "IPCC 2014"
        },
        "totalCo2Production": 81893000,
        "totalCo2Discharge": 0,
        "totalCo2Storage": 0,
        "totalCo2Import": 50356903.78735958,
        "totalCo2Export": 7422041.001893167,
        "totalCo2NetExchange": 42934862.78546641,
        "stateDatetime": "2018-07-05T15:45:00.000Z"
    }, {
        "production": {
            "unknown": 15,
            "coal": null,
            "hydro": 2037,
            "wind": 175,
            "biomass": null,
            "gas": 42,
            "geothermal": null,
            "solar": null,
            "nuclear": null,
            "oil": null
        },
        "source": "entsoe.eu",
        "schemaVersion": 1,
        "updatedAt": "2018-07-05T15:46:59.220Z",
        "datetime": "2018-07-05T12:00:00.000Z",
        "countryCode": "NO-NO3",
        "storage": {
            "hydro": null
        },
        "exchange": {
            "NO-NO1": -56.9809,
            "NO-NO5": 256.3115,
            "SE": -99.5329,
            "NO-NO4": 626.4535
        },
        "price": {
            "currency": "EUR",
            "datetime": "2018-07-05T16:00:00.000Z",
            "value": 54.83
        },
        "_isFinestGranularity": true,
        "maxProduction": 2037,
        "totalProduction": 2269,
        "maxDischarge": 0,
        "maxStorage": 0,
        "totalStorage": 0,
        "totalDischarge": 0,
        "totalImport": 882.765,
        "totalExport": 156.5138,
        "maxExport": 99.5329,
        "maxImport": 626.4535,
        "totalNetExchange": 726.2511999999999,
        "totalConsumption": 2995.2511999999997,
        "maxCapacity": null,
        "maxStorageCapacity": null,
        "maxExportCapacity": 0,
        "maxImportCapacity": 0,
        "co2intensity": 40.79328578174274,
        "fossilFuelRatio": 0.03491337017592971,
        "renewableRatio": 0.9645843113535453,
        "powerOriginRatio": {},
        "carbonOriginRatio": {},
        "exchangeCo2Intensities": {
            "NO-NO1": 40.79328578174274,
            "NO-NO5": 39.50395913154534,
            "SE": 40.79328578174274,
            "NO-NO4": 58.348355210641046
        },
        "productionCo2Intensities": {
            "unknown": 700,
            "coal": 820,
            "hydro": 24,
            "wind": 11,
            "biomass": 230,
            "gas": 490,
            "geothermal": 38,
            "solar": 45,
            "nuclear": 12,
            "oil": 650
        },
        "productionCo2IntensitySources": {
            "unknown": "assumes thermal (coal, gas, oil or biomass)",
            "coal": "IPCC 2014",
            "hydro": "IPCC 2014",
            "wind": "IPCC 2014",
            "biomass": "IPCC 2014",
            "gas": "IPCC 2014",
            "geothermal": "IPCC 2014",
            "solar": "IPCC 2014",
            "nuclear": "IPCC 2014",
            "oil": "UK POST 2014"
        },
        "dischargeCo2Intensities": {
            "hydro": 24
        },
        "dischargeCo2IntensitySources": {
            "hydro": "IPCC 2014"
        },
        "totalCo2Production": 81893000,
        "totalCo2Discharge": 0,
        "totalCo2Storage": 0,
        "totalCo2Import": 46677850.3618944,
        "totalCo2Export": 6384712.1721865265,
        "totalCo2NetExchange": 40293138.189707875,
        "stateDatetime": "2018-07-05T16:00:00.000Z"
    }],
    "cached": true
}
In particular, note the weirdness in timestamps of the last point:
"updatedAt": "2018-07-05T15:46:59.220Z",
"datetime": "2018-07-05T12:00:00.000Z",
"stateDatetime": "2018-07-05T16:00:00.000Z"
 jarek
on 5 Jul 2018
jarek
on 5 Jul 2018
Now it works again and history of NO-NO4 has in last point "datetime": "2018-07-05T13:00:00.000Z", "stateDatetime":"2018-07-05T16:15:00.000Z", "updatedAt": "2018-07-05T16:18:39.798Z". So perhaps backend is partly thrown off when stateDatetime is ahead of updatedAt?
jarek
on 5 Jul 2018
However in Kibana in last 4 hours I do not see errors for datapoints in the future for Norway which is what I might expect if updatedAt is less than stateDatetime
jarek
on 5 Jul 2018
A few insights about how the backend works:
datetimerepresents the time of the production dataupdatedAtrepresents the last time the production data was fetchedstateDatetimerepresents the timestamp used to compute the co2 values. As we need all data (production + exchanges of all zones) to compute the co2 values, we need to define astateDatetime, and then fetch the latest data (production + exchanges of all zones) that are at most 2 hours old, to compute the co2 values. NO should therefore be gray ifdatetime(of production) is 2h older thanstateDatetime. Is that what's happening?
 corradio
on 6 Jul 2018
corradio
on 6 Jul 2018
I don't think this is a bug.
Here's an example with Greece:
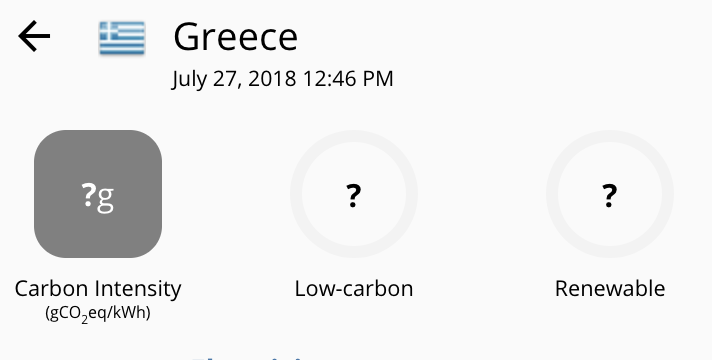
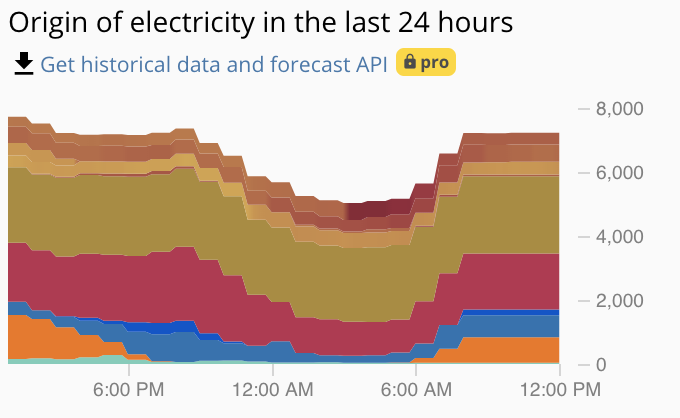
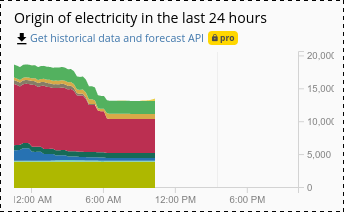
Notice how the last 2h of the graph is flat. That's because the last measurement of production is valid for 2h, but after that, it's not valid anymore. However, this causes the creating of states during 2h.
@brunolajoie in your initial bug report you state that the last datapoint is 10min old. You made that statement by looking at the graph right?
The last state was probably 10min old, but the last production measurement from NO was probably >2h old, thus explaining why it's greyed out.
In order to reproduce this, we will require to find a case where:
- the last history data point is less than 2h old (please dump the JSON)
- the state data has a missing carbon intensity (please dump the JSON)
What we could do however, would be to make sure the history graph goes up to current time.
With the greek example you can see it should have gone up to 12:45, instead of just 12.00
corradio
on 27 Jul 2018
Ha! Actually the graphs are allright, it's just that the axis have no lines so we dont see the bounds of the graph!
corradio
on 27 Jul 2018
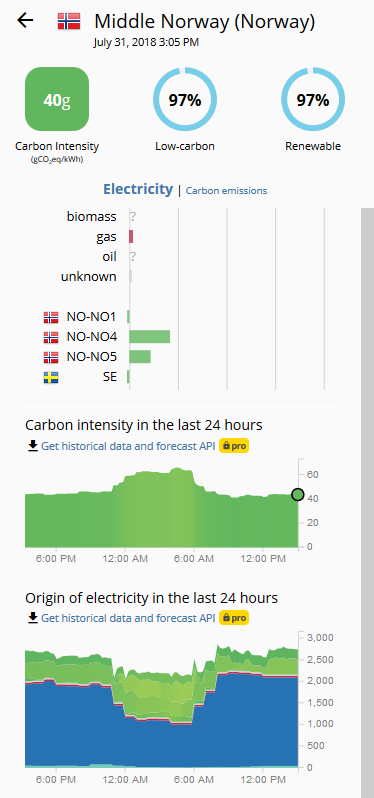
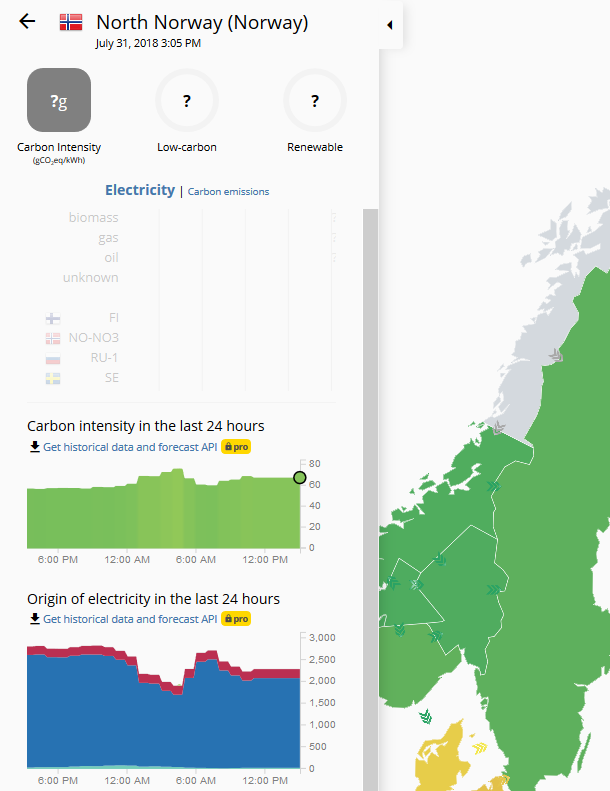
I actually saw this happening again today for NO4 / North Norway. Dumps of state endpoint and history for NO-NO3 and NO-NO4 at the time when the issue manifested are attached. Time in screenshots is in CEST.
From a quick glance, NO4 history has last datapoint with:
"updatedAt": "2018-07-31T12:31:37.859Z",
"datetime": "2018-07-31T09:00:00.000Z",
"stateDatetime": "2018-07-31T13:00:00.000Z"
I'm guessing it's being rejected from inclusion in state, but is still included in history and that is why it can be shown using the scrobbler.
history_no-no3.json.txt
history_no-no4.json.txt
state.json.txt
jarek
on 31 Jul 2018
Thanks for re-opening. We'll get to the bottom of this!
So the last history state is timestamped 2018-07-31T13:00:00.000Z
In theory, this means that its last valid measurement must be after 11:00 (2h tolerance).
The state of the map is timestamped 2018-07-31T13:05:59.744Z
In theory, this means that its last valid measurement must be after 11:05:59.744 (2h tolerance).
What could happen is that the last valid measurement was received between 11:00 and 11:05:59.744. In general, measurements are timestamped at the hour (that would be 11:00).
If the measurement is at 11:00, then the history at 13:00 will be valid, but anything >13:00 (including the map state) will be invalid.
So this is still consistent: the last history at 13:00 is ok, but after 13:00, well, we don't know anymore.
I do understand though that it's weird from a UX perspective. Not sure what to do. In this case the data from NO-NO4 just expired a few minutes ago, so it's hard to see on the history graph.
Do you follow my reasoning?
corradio
on 31 Jul 2018
I think the crux here is in the initial report from Bruno:
slide back in time a bit and coming back to "now" --> data is now available, last datapoint is 10min ago, and carbon intensity is computed on the left panel.
But actually it's not the last datapoint that is 10 minutes old, it is the last moment of validity of the last datapoint, and the last datapoint is actually 130 minutes old. The question is then how to display that...
As I understand it, the problem is that in database we have data timestamped for discrete time moments, but on front-end we want to draw lines between these time moments, because between a datapoint at 11:15 and a datapoint at 11:30 there is still reality (just not captured in reporting). We've assumed (in state I guess) that the datapoint is still considered "valid" for 2 hours, and we're drawing a straight line for those times when datapoint is still valid.
Maybe an answer is to not "extend" for 2 hours if the most recent datapoint is more than 2 hours in the past?
So for example, we have datapoints for 11:00 and 12:00. At 12:05 we show the most recent datapoint plus tiny extension. At 13:00 we show the 12:00 datapoint extended for 60 minutes. At 13:45 we show the 12:00 extended for 105 minutes. If we get a point for 13:00, the cycle extends, but if we don't, at 14:00 the extension disappears and the last point is shown for 12:00, or maybe extended for only 30 or 60 minutes.
This then gives a sort of a "probation" status to the extension of the last datapoint: "this is an assumption that the situation doesn't change, it will be helpful when the new data point comes in, but if a new point doesn't come in, we were building a bridge and found out there is no other coast - so we've un-built it".
An alternative could be to tweak the scrobbler behaviour, but honestly I don't know how I would do it.
I will watch and look what happens when e.g. MISO or Argentina drops off overnight.
jarek
on 31 Jul 2018
And also - is the extension 2 hours, or 4 hours?
Right now NEISO is showing a 4 hour extension/trail:
The last data update here was clearly at 6:15 CEST, but the flatline extends out to 10:15 CEST (exact times shown above when hovering).
The same is seen for MISO missing data, last data point is for 5:00 CEST and the line extends out to 9.
Could it be that the backend is extending by 2 hours, then the front end is extending by 2 hours more?
In the history JSON for NEISO, the last datapoint with production is:
"updatedAt": "2018-07-31T04:35:29.393Z",
"datetime": "2018-07-31T04:22:51.000Z",
"stateDatetime": "2018-07-31T08:15:00.000Z"
I understand your idea. It's actually a bit more tricky than that.
We have many different types of datapoints (exchanges, productions), and every new datapoint have far reaching ramification (think about how an exchange datapoint changes the whole co2 intensities of the whole grid). Therefore, we introduced the grid "state", which is just the latest version of all the different types of datapoints (productions+exchanges of all zones).
But datapoints don't always align in time, so we needed to define a concept of "how long a datapoint is valid for", which in turns defines if it will be part of a given state. To stay robust, we fixed this at a constant value of 2h.
Therefore, there's no way to have a short "probation", else, most countries would turn gray in real-time (the last measurement would often be on probation).
What we could do is have a probation only for the history. But that's super tricky as it introduces inconsistencies.
..and yes it seems like the system is set to 4 hours instead of 2. Everything is computed on the backend, so the frontend can't extend by 2h.. It's a bug.
corradio
on 31 Jul 2018
Hm, one more possible thing:
- my time now is 8:27 PM
- with a "live" zone, the timestamp shown under zone name is "August 1, 2018 8:25 PM"
- dragging the scrobbler back and forth on a live zone results in the right-most position it goes to being 8:15 PM (if I understand right, EM backend sends out data in 15-minute chunks?)
- Norway is showing currently grey
- when I drag the scrobbler to the past the colour in sidebar fills in, it works until 8:00, then at 8:15 it goes grey in the sidebar as well
- but I'm guessing that if the last Norwegian point was from 4:15, I would be able to drag to 8:15 and have it show as live in the sidebar even though the map was grey
But a "fix" to have the scrobbler go up to current time (8:25) rather than last datapoint (8:15) would mean that every "live" zone can be dragged into grey as well. So that's out.
Honestly, as it stands now it's probably _alright_, just a weird display edge case of the history replay functionality.
I would still suggest looking at the "trailing validity" thing... I realize it's data from different sources and possibly with different timestamps. But do I have this right?
- production data comes hourly, with datapoints timestamped 03:00 and 04:00. 04:00 is the
datetimeof the last datapoint. - said production data was fetched at, say, 04:32, because the data was not yet available at previous check at 04:17. Thus 04:32 is the
updatedAtof the last datapoint. - the only exchange for that zone reports every 15 minutes. It provides points timestamped 03:30, 03:45, 04:00, 04:15, 04:30, then has no more data. The exchange data for 04:30 was fetched at 05:37 because the server is weird and updates :30 to :30 rather than :00 to :60.
- the zone where the exchange came from reports hourly, with datapoints stamped 03:00, 04:00, and 05:00
What is the stateDatetime here? Or does it depend on other zones?
At what point does the zone go grey on map/state? Ignoring the 2 hr/4 hr thing for now...
As I understand it, it should go grey at either 06:01 (2 hours after last production) or 06:31 (2 hours after last component that would have impacted the intensity).
But then is anything stopping us - at 06:31 - from cutting off the "probation" history chart back to 04:30 (the datetime of the last confirmed data)? If more data was to come in, it would have been the next production data at 05:32, thus extending the validity anyway. If data comes in delayed because the source server was down, the zone would be grey in the state anyway.
A problem could be if the data for "production during 03:00 to 04:00" is published at 04:32 and we decide to timestamp it with 03:00 - then 2 hours will be up before the next parser result at 05:32. But it seems like it's more of a question of how long we're willing to tolerate stale data (the 2 hour/4 hour thing?) than a question of what to do once we do decide that data is too old.
I understand this is a complex issue (I haven't touched on the chain-of-exchange, I see), and maybe I'm misunderstanding it.
jarek
on 1 Aug 2018
Hi @jarek,
I've quoted some phrases to clarify:
if I understand right, EM backend sends out data in 15-minute chunks?
Yes for the histories. The "live" state is emitted at non-periodic intervals. It is emitted as soon as all the parsers have finished running.
But a "fix" to have the scrobbler go up to current time (8:25) rather than last datapoint (8:15) would mean that every "live" zone can be dragged into grey as well. So that's out.
I'm not sure I understand that fix. What do you mean by scrobbler? The slider? The history axis? They both go to the datetime of the current state (8:25).
What is the stateDatetime here? Or does it depend on other zones?
It depends on other zones that can be reached by means of one or multiple exchanges. stateDatetime is the latest of all the production/exchange datetime. If other data from the electricityMap arrives at say, 7:00, then the stateDatetime will be 7:00 as soon as the state is emitted.
At what point does the zone go grey on map/state? Ignoring the 2 hr/4 hr thing for now...
It goes grey if productionDatetime + 2h > stateDatetime. So it goes gray for states corresponding to times > 06:01 (both history and live).
But then is anything stopping us - at 06:31 - from cutting off the "probation" history chart back to 04:30 (the datetime of the last confirmed data)
By last confirmed data you really mean last "production or exchange data from a given zone". The problem if you do that, is that say you have another country importing from this one, that import will not have a co2 intensity anymore at 04:31 because you cut the history (effectively meaning that you ignore productionData from the country). Therefore, we need the "trail"/probation.
Also here you're differentiating real-time and history. It means that scrolling back to 04:31 is not the same as looking at the map in real-time at 04:31 (one is gray, the other is not). That inconsistency is important to have to ease processing.
The best way to think about the probation it is a validity time of an observation. With periodic data, you normally assume the validity is the frequency of observation. Here, the observation frequency is not well defined, so we set it to 2h regardless.
corradio
on 2 Aug 2018
Sorry, I've been calling this control the scrobbler:

Right now is 8:09 PM, when I load a page I get timestamp 7:57 (that's the stateDatetime I guess):

When I move the scrobbler a bit to left then back to as far right as it goes, I get shown timestamp 7:45. Because it moves in 15 minute intervals, perhaps?
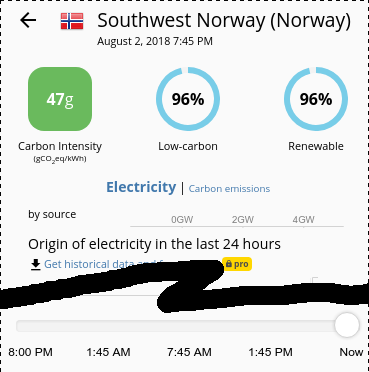
Could this be the crux of the issue described by Bruno? A zone might have been grey at 7:57, but valid at 7:45.
Also here you're differentiating real-time and history. It means that scrolling back to 04:31 is not the same as looking at the map in real-time at 04:31 (one is gray, the other is not). That inconsistency is important to have to ease processing.
Okay, that would be the chief argument against my idea then.
I'm out of other ideas, and I also think it's mostly fine to leave it as is.
jarek
on 2 Aug 2018
Allright, just wanted to make sure I understood you correctly.
You are correct with all your statements. I don't think it makes sense to update the backend, but we could try to be creative in the frontend (I don't really have ideas for now).
I was able to confirm the bug you mention. I'm opening a new issue.
corradio
on 3 Aug 2018
@jarek I'm closing this as I don't think there's anything we can do. Feel free to re-open if you think otherwise.
corradio
on 16 Sep 2018
Related issues
 StefanAO
·
4Comments
StefanAO
·
4Comments
 pascalheraud
·
4Comments
pascalheraud
·
4Comments
 systemcatch
·
5Comments
corradio
·
4Comments
systemcatch
·
5Comments
corradio
·
4Comments
 alixunderplatz
·
4Comments
alixunderplatz
·
4Comments