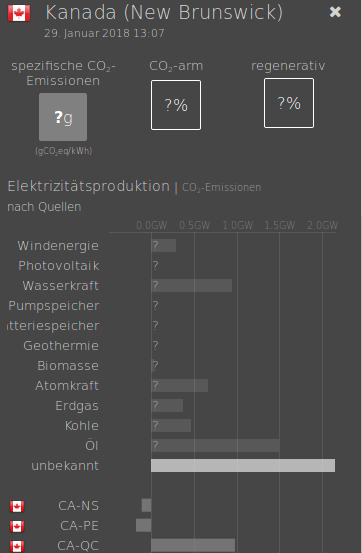
Electricitymap-contrib: Canada (New Brunswick) 4 different CO2 values: production unknown + 3x exporting
Comparing the CO2 numbers:
Canada (New Brunswick) --> Canada (Prince Edward Island): 11g
Canada (New Brunswick) --> Kanada (Nova Scotia): 599 g
Canada (New Brunswick) --> Vereinigte Staaten von Amerika (New England): 263
Canada (New Brunswick) only display unknown sources with 700g.
Where are that diff data from??
Think Canada new Brunswick parser?? needs a revision.
 strassburger
All 17 comments
it is the "ghost in the machine", the "buffer" and the "bias" inherent in the "Carbon Intensity" equation EM is using.
What is the average of only 1 "Carbon Intensity" sub-calculation active within the Parser based on "700 gCO2eq/kwh" for Unknown when there is a 0 valve generation output data???? --> 700
What is the average of only 2 "Carbon Intensity" sub-calculations active within the Parser that are 24 for Nuclear & 620 for Oil? --> 322
 HansHyde
on 29 Jan 2018
HansHyde
on 29 Jan 2018
Hi @strassburger,
What happens is that as we don't have enough data for NB, its carbon intensity is not calculated (you'll see "?" in the NB CO2 intensity in your screenshot).
Neighboring zones will fallback to their own carbon intensity when importing from NB (that's the least wrong assumption, i.e., importing from NB does not change their own carbon intensity), and therefore, they each display a different CO2 intensity number in the imports.
We should update the UI to clearly show when the system is in "fallback mode".
I hope this answers your question.
If you find better data for NB, let us know!
 corradio
on 29 Jan 2018
corradio
on 29 Jan 2018
Hi @corradio,
thanks for the prompt answer.
it does. Sorry that i can not help in that work.
Is there an existing issue for updating UI -UserInterface-?
By the way: I like the magic answer of @HansHyde.
strassburger
on 29 Jan 2018
Idea:
Think a form of "Red card" in ranking would help also.
A little numeric referee would made it.
Did look at Norway. There is a wrong CO2 number of Netherland. But only 3 % import.
Canada (Prince Edward Island) shows 92% import with fallback CO2 data.
A sportsman would say: cheating.
More than 10% import with fallback data -- > red card in ranking.
strassburger
on 29 Jan 2018
@corradio & @brunolajoie it is not "fallback mode". It is (yet another piece of) evidence of the error in your "Carbon Intensity" calculation. Simple question for either of you, did you ever run a series of _Controls_ on your "_Carbon Intensity_" equation? IMHO, you never did and only plugged in real-time data, where everything appeared to be in order, where the results were as you expected, and then you just rolled out more country parsers. The error is getting masked, and the EM universe is so large now, you will not be able to interpret data (or evidence thereof) when it is incorrect, biased, buffered or false readings. The error is manifesting itself in different ways and only a Excel charting genius could turn out/edit/modify charts fast enough to reflect where true values are hundreds of percentage points different that those EM is calculating. One can't even differentiate some of EM's data calculation results from true/accurate results because the error by EM is so great at times!
As to "fallback to their own carbon intensity", the evidence is right in front of you. The baseline "Carbon Intensity" of the Parser is 700. Why is that? Because there is only 1 sub-calculation occurring for Unknown = 700. Switch the Parser to Unknown & Gas and your "baseline" or "fallback" Carbon Intensity will be 595, the average of the two.
Do this for nuclear, hydro storage & wind, and your "baseline"/"fallback" will be 8.33 (the average of the 3 sub-calculations). You are running an average against total output of already weighted "carbon intensity" contributions from each fuel, and calling it a "_Carbon Intensity_". EM's "_Carbon Intensity_" calculation is a creation of EM, and it is not an algebraic formula that would pass any scientist, engineer or power system operator's basic first checks.
You guy's can put your heads in the sand all you want on this matter, idk as I wrote yesterday my intentions. All the modeling I did prior, where theses "ghosts" were revealing themselves, but I could not pinpoint directly their origin, became clear as day when I simply looked again at your calculation formulas. And honestly, I don't know if 1) you guys are just this stu*&^ , 2) it was an honest error from not fundamentally understanding the data & the subject matter you have built EM around, or 3) you have built a model that biases certain generation types & specifically certain countries knowingly.
EM's data is going to enter the world scene, it already has, and people/groups are going to use it for their own end-purposes and to support their own perspectives & opinions, and to influence global leaders & energy transition leaders. What is more important, believing EM's Carbon Intensity is correct, when it is not? Or actually getting it modeled correctly, producing accurate datasets that are reproducible, so that ultimately it can be independently validated & EM can do more than just be a "curiosity" to which energy nerds flock?
HansHyde
on 29 Jan 2018
@HansHyde you're not understanding what I say, and not understanding how the EM model works either.
Also, considering the issues you clearly have with our ways of calculating things, I will emphasise again that this work has been reviewed by many recognised organisations. We did a write-up back in the days here https://github.com/tmrowco/electricitymap/blob/master/CO2eq%20Model%20Explanation.ipynb together with folks from the industry.
We will happily read a peer-reviewed paper should you have a method that is more accurate or more widely recognised.
In the mean-time, if you can't restrict yourself to helping this project in a constructive way, we will be obligated to moderate your contributions, and ultimately prohibit you from writing here, as unfortunately you are causing more noise than constructive criticism.
Also, please stop insulting us.
Please consider this as a final warning. If you have any objections, please reach out to us/me in private.
corradio
on 29 Jan 2018
@strassburger we will look into updating the UI as soon as we have a bit of time. Thanks for flagging this.
corradio
on 29 Jan 2018
@corradio that posted link "CO2-equivalent Model Explanation" is not the series of calculations each Parser is making! It is the equations for balancing parsers through exchanges.
The calculations each Parser is making are here, within the Excel sheet from @alixunderplatz where the Parser is dividing by the Total GenMix Output in MW for each fuel sub-calculation.
I can replicate this across weeks of 5 minute frequency Gen Mix output for NY (where I can convert CSVs to Excel) with thousands of timestamps, and the "Carbon Intensity" calculated using that formula is exactly what EM would report as the "Carbon Intensity" of NY/NYISO at every timestamp.
I can even replicate the color scale (closely enough), and this too is spot on. The data is not lying.
Whatever calculations you are running for exchanges, I cannot replicate (nor have I tried - as I can't run a multi-dimensional database), but I know this much... Carbon Intensity "reactivity" to import/exports from an adjacent Parser are true and will mathematically balance (weight themselves accordingly for volume[flow] & Parser Carbon Intensity(calculated). The simultaneous exchange calculations ARE working IMHO.
Here are the actual Parser calculations defined/translated from Excel doc & that are running within each Parser. And the problem is the Parser is dividing each fuel type contribution (fuel type x fuel output) by overall electric output at that time. Then it sums all these calculations and returns the Parser's "Carbon Intensity".
This is false, and there is no reason to divide by overall electric output to get your "Carbon Intensity" Rate.
EM-Fundamental_Calculations_Error-Report.docx
The 3rd graph on EM for Alberta is showing an actual Carbon Emissions from this generation mix at each time (although it is off by roughly 1 decimal place). This graph stacks emissions (fuel type x fuel output), eg 490g x 100MW for each fuel type, and sums them together. It is not altered by Total Output, as is the Carbon Intensity Rate.
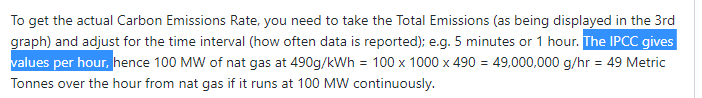
To get the actual Carbon Emissions Rate, you need to take the Total Emissions (as being displayed in the 3rd graph) and adjust for the time interval (how often data is reported); e.g. 5 minutes or 1 hour. The IPCC gives values per hour, hence 100 MW of nat gas at 490g/kWh = 100 x 1000 x 490 = 49,000,000 g/hr = 49 Metric Tonnes over the hour from nat gas if it runs at 100 MW continuously.
Now, to get the instantaneous Carbon Intensity Rate for nat gas, you need to divide by 3,600 seconds per hour. Thus, every second 100 MW of nat gas contributes 13,611 grams CO2 eq. Another way of saying this, 13.6 kg per second = 13.6kg/sec = 49 MT/hr
Repeat this for every fuel and their output, stack them all (sum them) and this is your Emissions Rate at the time you are looking at the EM UI.
If you want to take the True Emissions Rate and determine how much actual emissions occurred over a given period of time, then multiply the Emissions Rate per second by the duration of time in seconds (NOT hours or minutes!). This is exactly how kilowatt-hours consumed are calculated at a person's meter. The meter is spinning against a clock measured in seconds, well actually in Joules - but we know 1 Joule = 1 Watt-second. 100 W for 10 min + 500 W for 20 min = 6000Ws + 30,000Ws = 100 W-hr = 0.1kW-hr
The other day, Alex said it would be impossible for a "Carbon Intensity" Rate to be greater than any (the highest) fuel type in the mix. The Emissions Actual or the Emissions Rate is stacked (summed) from its components, it is not an average divided by something.
If each of these has an Output of 100 MW, damn straight the Emissions Rate & the Emissions Actual will be greater than the highest fuel's "Carbon Intensity". Otherwise, one would be saying, "I only have one 1,000-Watt lightbulb and five 40W LEDs, it would be impossible for me to consume more than 1,000 Watts per second!"
- Biomass | 1. INTENSITYBIOMASS | 230
- Coal | 2. INTENSITYCOAL | 820
- Gas | 3. INTENSITYGAS | 490
- Geotherm | 4. INTENSITYGEOTHERMAL | 38
- Hydro | 5. INTENSITYHYDRO | 24
- Nuclear | 8. INTENSITYNUCLEAR | 12
- Oil | 9. INTENSITYOIL | 650
- Other | 12. INTENSITYOTHER | 700
- Peat | | 1,120
- Solar | 10. INTENSITYSOLAR | 45
- Unknown 1 | 13. INTENSITYUNKNOWN | 700
- Unknown 2 | | 700
- Unknown 3 | | 700
- Wind | 11. INTENSITYWIND | 11
- Discharge-Battery | 7. INTENSITYBATTERY-DISCHARGE | -1*
- Discharge-Hydro | 6. INTENSITYHYDRO-DISCHARGE | -10*
THEY NEED TO BE stacked/summed: (230g x 100 MW) + (820g x 100 MW) + .... + (-10g x 100 MW)
THEY ARE NOT DIVIDED by the total output of 16 fuel types x 100 MW each = 1,600 MW Total Output. If you divide them by 1,600 I guarantee you it will return EM's "Carbon Intensity" rate. And that is not correct.
But that is what the Parser does to get the "Carbon Intensity" Rate.
It is averaging against total of the Output.
And the above "ghost" or "fallback" as you called it, is not some default setting, it is the average (or baseline) Carbon Intensity for that Parser because there is only 1 fuel type, and that fuel type = 700. And this baseline, to put it lightly, messes with emissions (if they were calculated).
Here are various EM Parsers, baselines calculated based on fuel types (quantities) in the Parser, with minimum and maximum "Carbon Intensity" Rates that could occur.
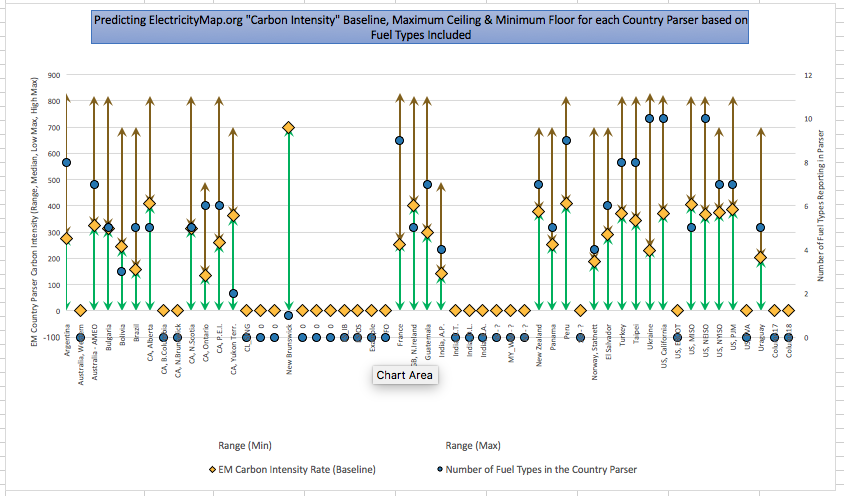
I just added New Brunswick, and bamm.... 700 as predicted for a Parser with 1 fuel type = Unknown = "700 grams CO2eq/kwh"
The EM "Carbon Intensity" Rate is fluctuating above & below this pre-decided Parser "baseline", it is not based on a zero-value. If more of the mix is above the baseline, the rate goes up but only proportional to how much of the mix is above the baseline. If more of the mix is below the baseline, the rate goes down but only proportional to how much of the mix is below the baseline.
At this point, I cannot be any more clearer than I am here now. The model & methodology that EM outlined & had peer-reviewed is not the same model that is being run inside the Parsers.
HansHyde
on 29 Jan 2018
@HansHyde again and again I read something like "The IPCC gives values per hour".
Where do you take that info from??? From "kWh" ??? I hope not ...
This, once again, is the fundamental thing I could never extract from all your comments...
In metric units, 1 kWh is just 3,600,000 Ws or 3,600,000 J - I guess we all agree on that?
Therefore it does not include any time component from which you could derive, in what period of time an arbitrary unit x of energy was/is consumed.
An electricity meter (old one with a spinning wheel) doesn't care in what "section" we measure time, since it measures the amount (=energy in kWh) of electricity consumed. If you consume 1 kWh within a second or a minute or an hour does not influence the way it will show the data - it will only display the amount of energy as product of "current x voltage" (edit: as W, not kWh) as W by scrolling the numbers foward for an amount of time (edit: here comes the "hour" or "second" or "whatever time unit") the consumption is present - in the "kWh" itself, there is absolutely no time component included from which you retrospecitively could make any assumptions on "hourly" or "minute" or "second" consumption! It could also display that as Wh or Ws - it's just a matter of scale, of course.
I'll read through all your work later and will come back and see what the issue is.
Alex
Edit: I had a typo and updated my comment to correct what I wanted to say.
 alixunderplatz
on 29 Jan 2018
alixunderplatz
on 29 Jan 2018
If one day, a consumer can tap into EM and tap into their Smartmeter, sync them together in realtime, then they (or even EM) will be able to calculate their carbon emissions (LCA) in grams, kg or MT over a billing cycle (roughly one month) or maybe even over an hour.
But now, EM does not have enough information to calculate this.
You only have
- "Realtime" Output per frequency of reporting, and
- IPCC average emissions per kilowatt-hour (across time, not against Output).
That is it, you don't have enough information to go further.
You can calculate an Instantaneous Rate of emissions (which is an average Rate across the 5 min, 30 min, 1 hr or 1 day Output reporting from the ISO/RTO/Grid Operator) and you can use those Rates to calculate a volume of emissions (Rate x Interval of Time) during that time, or adjusted for time to hours or days or year. Which is similar to what is seen in Alberta's 3rd graph, but it is not adjusted for time, so it is not actual emissions (although the error is much closer than it would be if calculated from EM "Carbon Intensity" Rate).
HansHyde
on 29 Jan 2018
@alixunderplatz you may laugh again, but the dial on a electric meter is like your car's speedometer. The kwh consumed is like your car's odometer.
Note this discussion, "3600" keeps coming up, and even though one might not want to use it, it has to be used.
http://mathforum.org/library/drmath/view/57258.html
So here it is... time, measured in seconds, is the assumed value that is dropped when we are looking at MW output. It really is MW-seconds or MW per second. But it is a mathematical assumption that in order to make an algebraic calculation from a Rate (speed, electric output) you have to account for time accordingly. Otherwise, you are in working in Calculus at a time equal to "0" or instantaneous.
The area under triangle Output plotted against Time, eg 30 minutes to ramp to 100 MW, then 30 minutes to ramp down to 0 MW, is your total energy generated is it not? The Rate is the line going from 0 to 100 MW and then to 0 again is your Power is it not? Where does time fit into this?
The EM graphs are very crude emissions calculators... if you know the Rate & the interval of time it is reporting for, then you can find the emissions as the area under the curve (under the Rate). But if the frequency of reporting is 5 minutes, not 1 hour, watch out because your emissions (area) would be based on 5 minutes (not 1 hour) & would be the Rate times 300 seconds. To get your emissions for 1 hour, then you need to add the 12 "areas under the curve" together.
So EM's Rate should track exactly with emissions (like are seen in Alberta graph 3), but they don't because the Rate calculation divides emissions by Output.
What happens when you divide by 1, as in 1 hour? The answer is the same. What happens when you divide by 3600 seconds (which equals 1 hour)? Much different result.
I don't know how dividing by Total Output ended up in the Parser Carbon Intensity calculation, other than it is there when it should not be. The only way I can surmise, is because it helps "cancel out" labels, that allows IPCC labels into the Carbon Intensity calculations to be magically returned as results of the calculations with the same labels too. Then, label in equals label out. That's magic, but it does not follow the rules of algebra.
HansHyde
on 29 Jan 2018
Here is a Control run on EM's Parser Calculations
For Alex's info, the Control does not factor time. All intervals are equal, or "1" hour.
The Ramping is 5% going up from 0 for 70 intervals, the Ramping Down is 15% per interval. First decrease is -20%, then up 30%, then up 25%, each holding for 10 intervals.
Outputs for each fuel type is equal throughout, if nuclear = 100 MW, coal = 100 MW, Unknown = 100 MW etc.
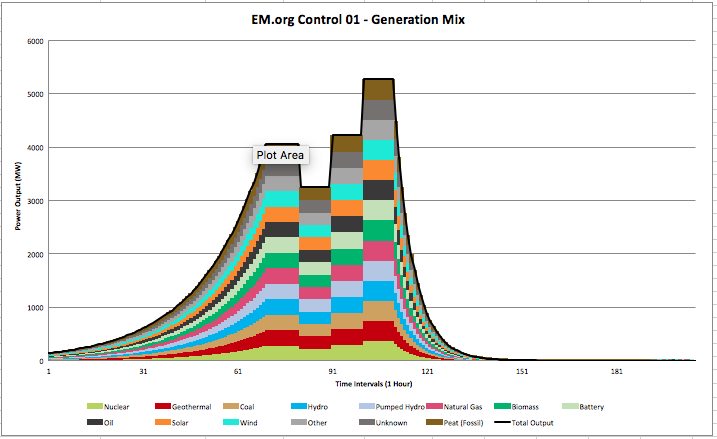
Here are Rates (EM & Properly Calculated) & Emissions (EM & Properly Calculated) from those same Outputs
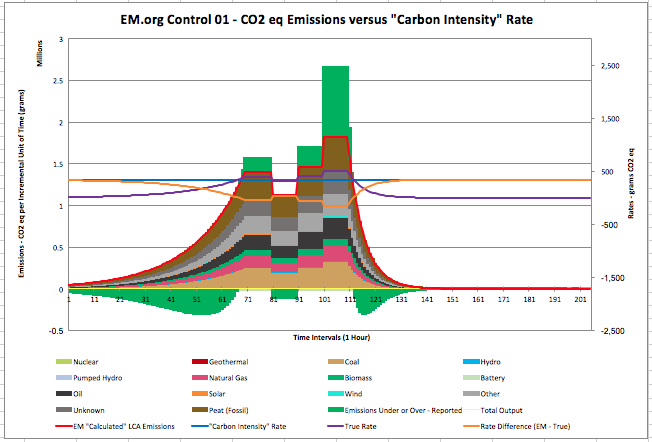
Look at EM's Carbon Intensity Rate - the blue line. It is constant at roughly 345, which not surprisingly, is the average of all the carbon intensities of the fuels that are included within the "Parser".
A value other than "0" in the 4th column indicates it is reporting in the "Parser".
- Biomass | 1. INTENSITYBIOMASS | 230 | 230
- Coal | 2. INTENSITYCOAL | 820 | 820
- Gas | 3. INTENSITYGAS | 490 | 490
- Geotherm | 4. INTENSITYGEOTHERMAL | 38 | 38
- Hydro | 5. INTENSITYHYDRO | 24 | 24
- Nuclear | 8. INTENSITYNUCLEAR | 12 | 12
- Oil | 9. INTENSITYOIL | 650 | 650
- Other | 12. INTENSITYOTHER | 700 | 700
- Peat | | 1,120 | 1,120
- Solar | 10. INTENSITYSOLAR | 45 | 45
- Unknown 1 | 13. INTENSITYUNKNOWN | 700 | 700
- Unknown 2 | | 700 | 0
- Unknown 3 | | 700 | 0
- Wind | 11. INTENSITYWIND | 11 | 11
- Discharge-Battery | 7. INTENSITYBATTERY-DISCHARGE | -1 | -1
- Discharge-Hydro | 6. INTENSITYHYDRO-DISCHARGE | -10 | -10
Look what happens when "stacked emissions" & its total Rate (red line) have not reached EM's "baseline" Rate, there are negative emissions occurring. And then, as soon as "stacked emissions" reach the EM "baseline" Rate excess emissions start to appear.
At time 80 --> 81, Output drops, EM "stacked emissions" Rate drops below the "baseline", and negative emissions occur again.
At times 90 --> 91, and times 100 --> 101 Outputs increase, "stacked emissions" Rate go above the "baseline" Rate, and excess emissions occur, but they increase proportionally to the difference between the EM "baseline" Rate and the EM "stacked emissions" Rate, not from zero.
Then Output ramps down, and as soon as "stacked emissions" Rate drops below "baseline" Rate, here's the negative emissions again.
The data and the calculations are not lying, they are simply reporting the results from running the EM Parser model.
As you can see, if I pushed Total Output above 5,000 MW the excess emissions would go through the roof and we would be looking at a "hockeystick" graph, where all the details needed would be indiscernible. That I first saw signs of this in NYISO with an output of 15,000 - 20,000 MW is rather fortunate. What would PJM be, running at 100,000 MW?
HansHyde
on 29 Jan 2018
@HansHyde No parser "is dividing by the Total GenMix Output in MW for each fuel sub-calculation." - I don't know where you're getting that idea from. Please read a few parsers to get a feeling of what they do.
When you say we only have ""Realtime" Output per frequency of reporting" - that is incorrect as we have the average power (which is independent of the frequency of reporting).
When you say "IPCC average emissions per kilowatt-hour (across time, not against Output)" it clearly shows that you are misunderstanding the usage of SI units. "Across time, not against Output" does not mean anything. IPCC gives emissions per output, never across time.
I do understand there's a lifetime assumption underneath, but that's exactly made in order to exclude time. If you want to do an emissions model that is as robust as IPCC, and takes lifecycle emissions + operation emissions, be my guest (actually I'd really like that). But unless it's peer-reviewed, the best we can do is use IPCC.
From all of this I can only say that we do not have the same scientific background on which to establish sound reasoning.
I will therefore lock down this thread, and prevent further contributions as you're not following contribution guidelines. Again, feel free to reach out to us in private. However, I suggest you take a deeper look into what IPCC numbers mean before resorting to any excel or control procedures that are flawed by design as you don't understand what the numbers represent and don't agree to describe things by common concepts.
corradio
on 29 Jan 2018
First:
i want to make elestrecitymap better.
So i have to point us thinks which can nait be:
There are sinple mistakes everybody can see.
Example:
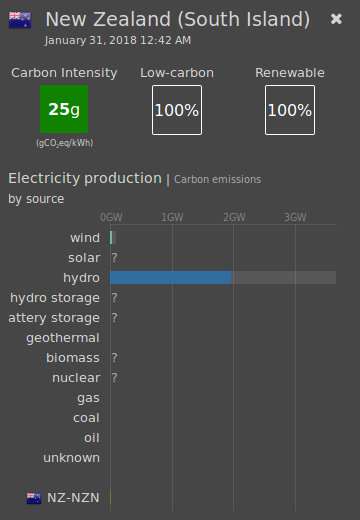
Newzeeland with
98% water and 24g...
2% Wind with 11g...
the result shown is 25g.
There i can not follow, sorry. Think it is not a problem of education.
That for me really not is a question, for me it is just a mistake, not hidden any more.
Where it comes from, sorry i can not say, still hidden.
Please check yourself.
strassburger
on 31 Jan 2018
Hi @strassburger.
The increased emission comes from the import from the North Island which is
around 200-300g. Although it is almost not visible, the high carbon
intensity is enough to push the average up to 25g.
At first I was afraid there was a mistake, but it turns out there's not!
Olivier
On Jan 31, 2018 02:07, "strassburger" notifications@github.com wrote:
First:
i want to make elestrecitymap better.
So i have to point us thinks which can nait be:
There are sinple mistakes everybody can see.
Example:
Newzeeland with
98% water and 24g...
2% Wind with 11g...
the result shown is 25g.
There i can not follow, sorry. Think it is not a problem of education.
That for me really not is a question, for me it is just a mistake, not
hidden any more.
Where it comes from, sorry i can not say, still hidden.
Please check yourself.
[image: grafik]
https://user-images.githubusercontent.com/28303688/35599727-241a6dd8-0622-11e8-8d24-e23f7bcf7819.png
—
You are receiving this because you were mentioned.
Reply to this email directly, view it on GitHub
https://github.com/tmrowco/electricitymap/issues/1041#issuecomment-361788876,
or mute the thread
https://github.com/notifications/unsubscribe-auth/ABlEKM4cHZwA0_7cBgHVzyi439OmWN8cks5tP7y7gaJpZM4RwlwX
.
corradio
on 31 Jan 2018
@strassburger I'm closing this issue and creating a new one to update the UI per your original request -> #1051
corradio
on 31 Jan 2018
For reference, my original request about whether an approximate value for New Brunswick could be hardcoded (rather than defaulting to unknown) was https://github.com/tmrowco/electricitymap/issues/563
One day we'll get better data from NB, I hope...
 jarek
on 3 Feb 2018
jarek
on 3 Feb 2018
Related issues
corradio
·
4Comments
 StefanAO
·
4Comments
StefanAO
·
4Comments
 Alain-Ivadolabs-Ext
·
4Comments
Alain-Ivadolabs-Ext
·
4Comments
 jiwidi
·
4Comments
corradio
·
4Comments
jiwidi
·
4Comments
corradio
·
4Comments
Most helpful comment
@HansHyde No parser "is dividing by the Total GenMix Output in MW for each fuel sub-calculation." - I don't know where you're getting that idea from. Please read a few parsers to get a feeling of what they do.
When you say we only have ""Realtime" Output per frequency of reporting" - that is incorrect as we have the average power (which is independent of the frequency of reporting).
When you say "IPCC average emissions per kilowatt-hour (across time, not against Output)" it clearly shows that you are misunderstanding the usage of SI units. "Across time, not against Output" does not mean anything. IPCC gives emissions per output, never across time.
I do understand there's a lifetime assumption underneath, but that's exactly made in order to exclude time. If you want to do an emissions model that is as robust as IPCC, and takes lifecycle emissions + operation emissions, be my guest (actually I'd really like that). But unless it's peer-reviewed, the best we can do is use IPCC.
From all of this I can only say that we do not have the same scientific background on which to establish sound reasoning.
I will therefore lock down this thread, and prevent further contributions as you're not following contribution guidelines. Again, feel free to reach out to us in private. However, I suggest you take a deeper look into what IPCC numbers mean before resorting to any excel or control procedures that are flawed by design as you don't understand what the numbers represent and don't agree to describe things by common concepts.