Electricitymap-contrib: CAISO imports
Live data is available here:
http://www.caiso.com/TodaysOutlook/Pages/supply.aspx
However those are only net imports. We should determine who they import power from, and try to figure out if a live data source exists. Seems like OASIS has some of it?
 corradio
All 12 comments
Information from California Emissions Commission shows Intermountain Power Project (coal) located 2 states away in Utah is owned by LADWP and reports end of the year data to California in MWHr produced and Primary Energy consumed. I calculated g/kWh in #960 as it was a great dataset (1,460 power generation units over a year) to use.
I think the 3 of us (@brunolajoie) should try to talk this week. The underlying CO2/kWh methodology is flawed, but I honestly think we have the data available & resources to fix it.
 HansHyde
on 31 Dec 2017
HansHyde
on 31 Dec 2017
As far as I can tell from a quick scroll through https://github.com/WattTime/pyiso/blob/master/pyiso/caiso.py they are also only getting absolute import/export, not who it's coming from.
Nevertheless it might be good to just add a generic import from "US" even if we don't get its properties. It seems to be about a third of the in-state reported supply and our supply chart looks particularly odd around "duck curve" time.
 jarek
on 2 Jan 2018
jarek
on 2 Jan 2018
Hmm checking Oasis I do see something that might be exchange data under Energy > EIM Transfer by Tie. Would have to write a script to see if the values there line up with summed up data on CAISO's Today's Outlook page.
jarek
on 3 Jan 2018
I see that one as well. It's possible to eventually get a CSV containing 1000's of datapoints for the current day though I haven't checked to see if they match up with absolute totals.
However I'm not sure we gain much at the moment by having this level of detail. All the regions/states surrounding CAISO have no data currently and I don't think we have any leads for sources yet. Everything will be set to unknown anyway. Let's start by using the absolute import/export number and improve from there.
To make that work we just need a fetch_exchange method in CAISO, also it would probably be a good idea to merge all states without data into a generic 'USA' to keep things simple.
 systemcatch
on 3 Jan 2018
systemcatch
on 3 Jan 2018
That could work in order to get the ball rolling.
corradio
on 3 Jan 2018
EDIT: as soon as #1040 BPA will be added, all of what i wrote below will be invalid anyway^^ should have thought about this earlier 😅😅😅
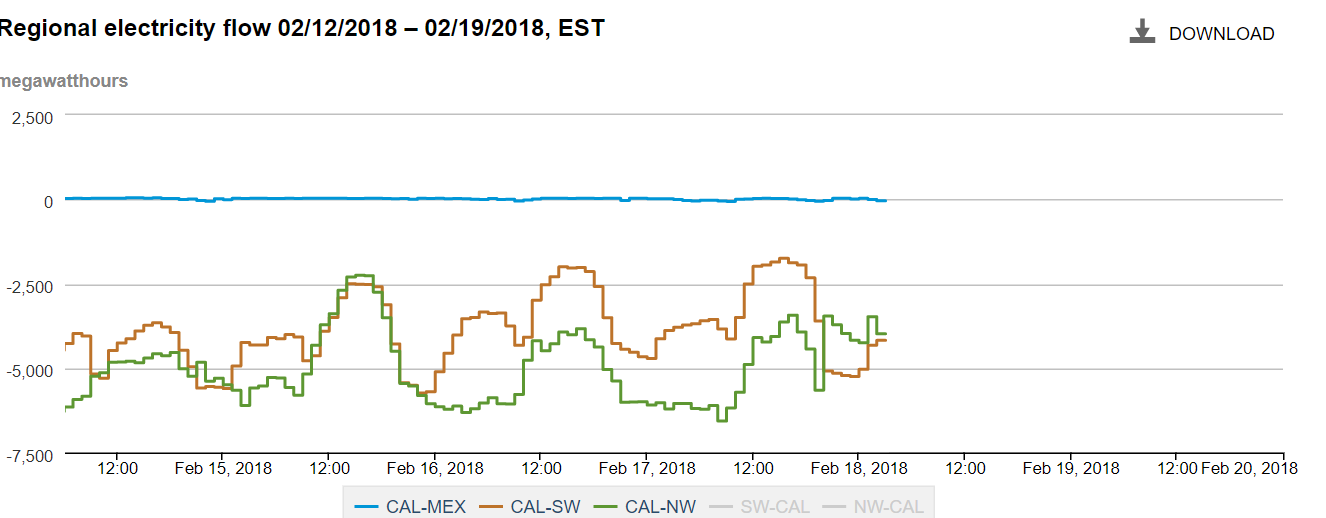
To get historical exchanges from the entire state of California to grid regions labeled as "Northwest", "Southwest" and Mexico, it is worth taking another look at the eia.gov "U.S. ELECTRIC SYSTEM OPERATING DATA" website.
Seperate data to these 3 zones seems to be about 1.5 days behind.
https://www.eia.gov/realtime_grid/#/data/graphs?end=20180219T14&start=20180212T19®ions=g
There also is the total exchange balance which is "only" about 12 hours behind:
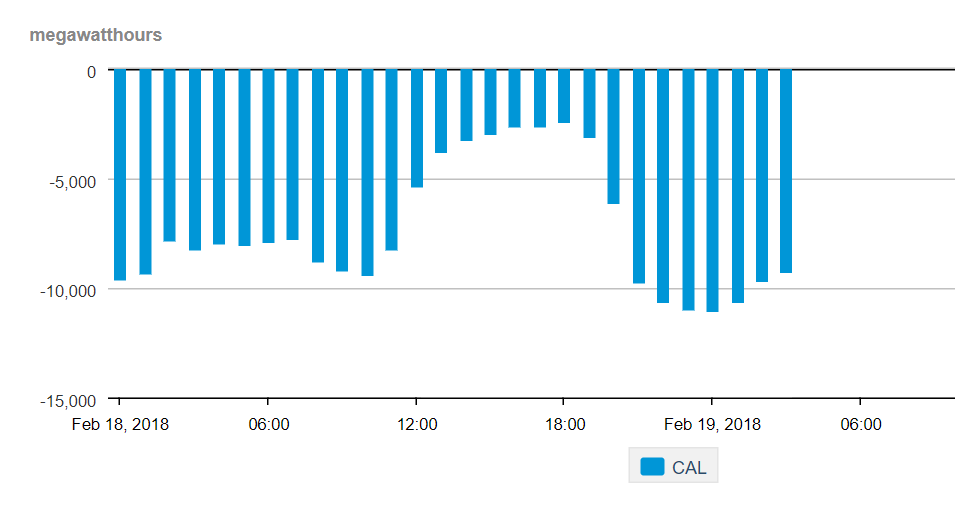
We may label the other two purple areas ("Northwest" and "Southwest") as something like "Western Interconnection USA" or "USA West" and include that 12-hour-delayed total exchange balance. Exchanges with Mexiko are low and could be neglected. That would allow covering at least half of the time in the "origin of last 24h graph" with the imports (/exports).
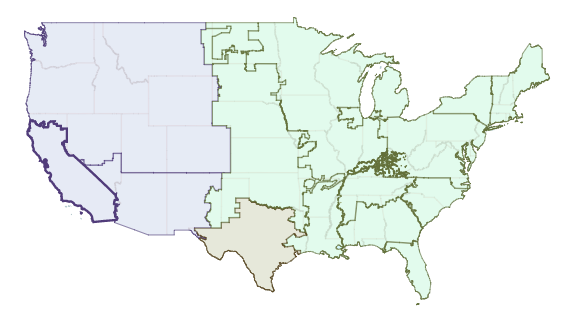
But we need to be very careful! I want to remind you that CAISO is covering about 80% of California. There are other regions named BANC, TDC, LDWP within the State of CA. See:
https://www.eia.gov/realtime_grid/#/status?end=20180219T14
The data used in the electricitymap for "CAISO" is related to the "CISO" region in that gov map.
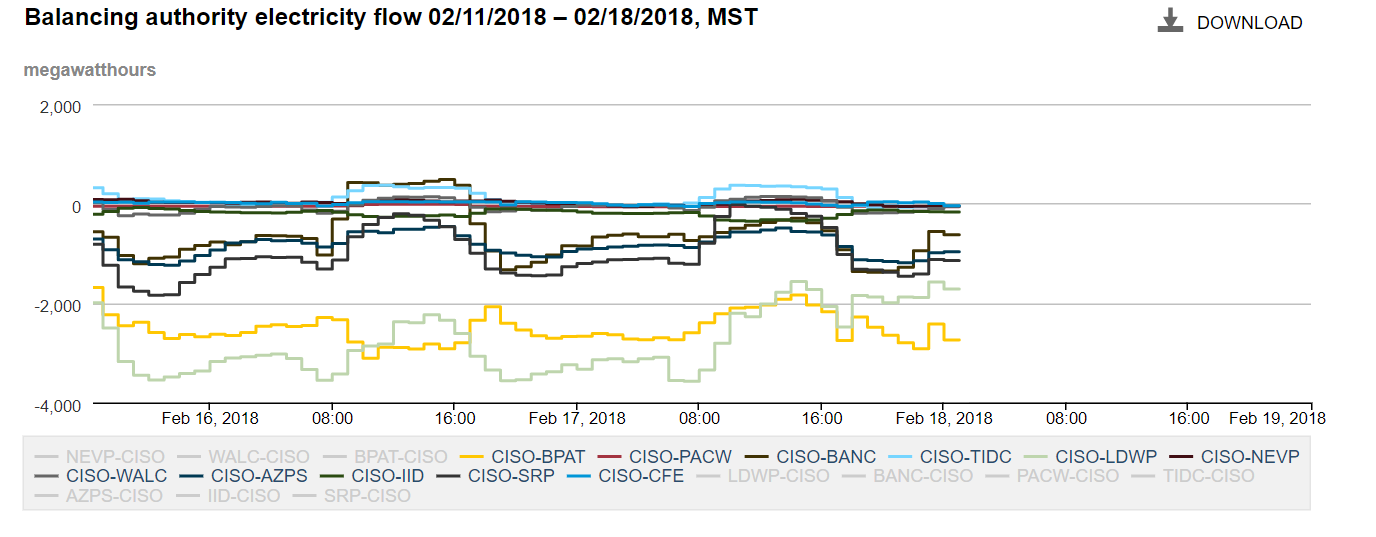
If you select the CISO circle instead of the entire state, exchanges of CAISO with Oregon, Nevada and Arizona are available with about 1.5 days delay. We'd "only" need to figure out which exchanges to select. But considering the "inter-Californian" power flows would make this way too complicated since CAISO is also having exchanges with the other grid regions within California and within CAISO itself which have interconnections with the other states and and and ... 😩 😩 😩
To make a long story short:
- We could use the 12-hour-delayed exchange balance for the entire state of California with Northwest and Southwest for the live map. This would neglect that we only have data for CAISO and not entire California, but at least the exchanges would have a distinct "origin of imports".
- Using the CAISO 12-hour-delayed exchange may be problematic to determine the "origin" of imports, because of inter-Californian exchanges.
- Historical detailed exchange data is available with a delay of ~1.5 days for California, CAISO, and the other regions within CAISO or California.
 alixunderplatz
on 19 Feb 2018
alixunderplatz
on 19 Feb 2018
I don't really know how we'll represent BPA on the map at this point, so I wouldn't worry too much about that yet. Seems like the Mexican exchange is relatively straightforward and won't run into problems with the zone representations. The EIA's API looks decent and only needs an email address to use.
systemcatch
on 19 Feb 2018
Imports from "rest of US" should have been added in #1234 and I don't see any errors about it in the logs - the parser is logged as running, e.g. "end exchange parser for US->US-CA - took 16.54 seconds". However the import is not reflected on the site, I am not sure why.
jarek
on 24 Mar 2018
Imports from the "rest of US" now appear on the website :+1:
jarek
on 28 Mar 2018
Nice job!
What do you guys think about computing a static "rest of the US" carbon intensity for CAISO imports, in order to finetune CAISO carbon intensity? It seems feasible technically speaking
 brunolajoie
on 28 Mar 2018
brunolajoie
on 28 Mar 2018
@brunolajoie it's really hard to determine what is happening around California and where the energy is atually coming from.
- There is a high share of hydro from BPA (#1040) in the north.
- Nevada mostly generates from gas, but also has significant geothermal, solar and hydro.
- Arizona has mostly generation from nuclear, coal, and gas, only some hydro and other RES.
But it's not very clear if the neighbours import a lot of energy from other states themselves or in what extent this influences their carbon intensity. The direct neighbours in the east also have quite some PV installed, so the carbon intensity could decrease significantly during the day.
With all these uncertainties, I'd personally leave California as it is now.
alixunderplatz
on 28 Mar 2018
Closing due to inactivity. Thank you all for your inputs!
corradio
on 6 Jan 2020
Related issues
 jzlcdh
·
5Comments
systemcatch
·
4Comments
corradio
·
4Comments
jzlcdh
·
5Comments
systemcatch
·
4Comments
corradio
·
4Comments
 Alain-Ivadolabs-Ext
·
4Comments
Alain-Ivadolabs-Ext
·
4Comments
 pascalheraud
·
4Comments
pascalheraud
·
4Comments
Most helpful comment
@brunolajoie it's really hard to determine what is happening around California and where the energy is atually coming from.
But it's not very clear if the neighbours import a lot of energy from other states themselves or in what extent this influences their carbon intensity. The direct neighbours in the east also have quite some PV installed, so the carbon intensity could decrease significantly during the day.
With all these uncertainties, I'd personally leave California as it is now.