Electricitymap-contrib: US: NYISO
Data seems to be available here:
Also, PYISO has already coded some of the parsers.
 corradio
All 32 comments
CSV data is at http://mis.nyiso.com/public/P-63list.htm
nyiso lines up very nicely with the actual state of New York. However the nyiso class is what is causing the problem in #864. That's fixed but won't be usable until pyiso repackage at some point. Therefore I think we should disable nyiso in US.py and create a new parser called US_NY.py that can replace pyiso's nyiso until fixed. This lets us show the US aggregate again plus NY state individually.
 systemcatch
on 7 Dec 2017
systemcatch
on 7 Dec 2017
Spotted by @HansHyde:
Here is NYISO realtime (updates every 5 min) system demand with flows in/out from IESO (Ontario), PJM, HydroQuebec and NEISO
http://www.nyiso.com/public/markets_operations/market_data/maps/index.jsp
Here gives you generation within NYISO (which does not include the imports), so potentially some assumptions can be made from the data in the Daily Fuel & Current Fuel tabs.... http://www.nyiso.com/public/markets_operations/market_data/graphs/index.jsp
Sorry, I can't search around ERCOT.com anymore... they appear to have a security measure that is blocking access from outside the US.
corradio
on 7 Dec 2017
Ok basic parser is written. Couple of questions on how you want the generation type mapping for these.
Dual Fuel - facilities capable of using natural gas and/or other fossil fuels
Other Renewables - solar, methane, refuse or wood
Other Fossil Fuels - unknown I assume?
systemcatch
on 9 Dec 2017
I'd suggest putting all as unknown, except for Other Renewables that we might be able to put as biomass (but not if solar is included..)
corradio
on 9 Dec 2017
As part of this we should also update https://github.com/tmrowco/electricitymap/blob/master/parsers/CA_ON.py#L161 to split out New York, Michigan, and Minnesota.
 jarek
on 10 Dec 2017
jarek
on 10 Dec 2017
Hi all... on the "dual fuel" aspect in NY, please note the following (ie don't put into "unknown"...
"Power plants fueled by natural gas (both gas-only and dual-fuel) provide 57% of New York’s total generating capacity.
47% of New York’s generating capacity is composed of dual-fuel units. These facilities, predominantly located in downstate New York, offer the flexibility of operating on natural gas or an alternative fuel (typically oil), as determined by market signals or reliability requirements.
Natural gas and dual-fuel projects account for more than 70% of the proposed generating capacity being studied by the NYISO for interconnection to the grid."
I will look around more to see if I can find any info (whether compiled over the year/monthly) to set a historically based Kg CO2eq/MWhr for "dual fuel" to apply to the parser.
NYISO will be very imperfect (with regards to imports from PJM) - and NE ISO (Maine, Connecticut, Rhode Island, Vermont & New Hampshire) should likely be the next region to work on for the US.
 HansHyde
on 10 Dec 2017
HansHyde
on 10 Dec 2017
@systemcatch - hi, please note your map for NYISO may need to have subregions as seen here...
http://www.nyiso.com/public/markets_operations/market_data/maps/index.jsp
11 subregions - A thru J These are seen & identified as the "Zonal Load" areas - some of these will be able to be "matched" to specific generating assets (i.e., Gennessee-B has a nuclear reactor, Central-C has 3 reactors) and from this can be assigned an average CO2eq. I'm looking at a report that has average CO2eq rates for NYC areas where a lot of the "dual fuel" plants are located. For example... "Hudson Valley has as average of 0.55 tons per MWHr."
10 "external" interfaces - PJM (4x), IESO (1x) "Ontario ISO", HQ (2x) "HydroQuebec" & NPX (3x) "NEISO" seen as the 10 blocks outside the state boundaries in the "Interface Flows" checkbox.
7 "internal" interfaces - the 7 blocks seen within the state boundaries in the "Interface Flows" checkbox.
@corradio - I sent you a connection request on LinkedIn.... maybe we can talk by Whatsup in the near future?
HansHyde
on 10 Dec 2017
@HansHyde do you have any connections at NYISO? Optimally they would update their reporting to report what fuel they are currently using at the "Dual fuel" stations. Traditionally Electricity Map has reported anything not-assigned-elsewhere as unknown partly to encourage operators to release _actual_ data.
jarek
on 10 Dec 2017
@jarek Not at NYISO, but at NYPA I do - who may be able to help me (us) decipher the above internal zones & flows to achieve "best guestimates" - see below.
I'm scanning through a 400+ page document now (2016 State of the Market Report) and the good news is that on Appendix pages A-180 & A-181, dual fuel usage has gone to virtually 0 oil combustion in 2016 from 2015. In other words, a safe assumption is that "dual fuel" can be counted as natural gas generated power.
The bad news, this is reported for 6 zonal areas (1 has 3 different regimes, and 1 has 2 regimes) at the end of the year where the natural gas assets are located. The further bad news (and maybe not something Europeans are familiar with) the natural gas fleet in the US is further complicated by different designs, each having different Heat Rates which affect CO2eq/MWHr.
This may require a "best guess" averaged estimate CO2eq/MWHr for NY in both the Natural Gas & "Dual Fuel" categories for each subzone (if you go that route) or for NYISO overall (if you want to simplify).
Although EM may decide to show NYISO (New York) as a single entity on the map, I think you guys will need to design it in the background along the lines to what Europe looks like, with the 11 subregions I noted above.
So to your point about _encouraging operators_, I honestly don't think they (NYISO, etc) even know and rely on monthly, quarterly or end of year reporting to arrive at a CO2eq for the year.
If you guys can tackle NYISO, then ERCOT or CAISO, and NEISO - this will be an achievement in itself for the US. PJM is as large as all 4 combined, if not larger - it has between 350 - 400+ GW of generating capacity alone!
South of PJM - TVA, Duke, FPL (Nextera), Georgia Power (Southern Company), etc., are all IOUs (Investor Owned Utilities) - they have no reason to release realtime system information to the public. PJM itself is littered with countless IOUs, as is MISO and SPP, so unlikely they would have access to CO2eq data.
Not trying to discourage, only set reasonable expectations for what may be possible.
HansHyde
on 10 Dec 2017
@HansHyde Thanks for doing the research into NYISO and it's surrounding areas. I think for now simply aggregating for the whole state of NY is best as we can't integrate new shapefiles or get real time generation by region/zone.
corradio can decide about the emissions factors. I think the 'gas' label already allows for different designs though. As to IOU's south of PJM that's frustrating to know but given how crazy the US grid is not surprising.
systemcatch
on 10 Dec 2017
Interconnections to NYISO - _The Cross Sound Cable (“CSC”), which connects Long Island to Connecticut, is frequently used to import up to 330 MW to New York. Likewise, the Neptune Cable, which connects Long Island to New Jersey, is frequently used to import up to 660 MW to New York. The Northport-to-Norwalk line (“1385 Line”), which connects Long Island to Connecticut, is frequently used to import up to 200 MW (the capability increased from 100 MW to 200 MW in May 2011 following an upgrade to the facility). The Linden VFT Line, which connects New York City to PJM with a transfer capability of 315 MW (this increased from 300 MW on November 1, 2012), began normal operation in November 2009. The Hudson Transmission Project (“HTP Line”) connects New York City to New Jersey with a transfer capability of 660 MW, which began its normal operation in June 2013.
In addition to the controllable lines connecting New York City and Long Island to adjacent control areas, there is a small controllable line between upstate New York and Quebec that is known as the “Dennison Scheduled Line” and which is scheduled separately from the primary interface between New York and Quebec._ pg A89
Installed Capacity in NYISO - simplified to 5 areas of the 11 noted above... A-157/8
On imports from PJM - primarily from contracted NG generators in Pennsylvania & New Jersey - _"This trend reversed in the past two capability periods, with imports from PJM increasing by 400 MW to 500 MW in the summer and winter capability periods. A majority of this capacity has originated from gas units in Pennsylvania and New Jersey which are contracting with suppliers in New York per PJM guidelines to delist and register as capacity resources in New York."_
On NYISO exports to NE-ISO - _"Since 2010, between 100 and 200 MW of capacity have steadily exported to ISO-NE, while the imports from ISO-NE have ranged from 0 to 200 MW, primarily from small hydro units."_
pages A-159/60
On the NG fleet... note pages A-173 & A-174 Provides some heat rates (seasonal) which could also be applied for the PJM imports above.
NOx Bubble - from May to September, it can be assumed less efficient steam generation units in the NYC area will be used instead of more efficient Combined Cycle Generating Turbines as the CCGT generate NOx - a local pollution concern for NYC.
Pumped Storage - NYISO has large 2 pumped storage facilities - at the Niagara Power project & at Bienheim-Gilboa https://en.wikipedia.org/wiki/Blenheim-Gilboa_Hydroelectric_Power_Station - I read somewhere, it is not accounted for directly on the NYISO site - only as a negative (reduction in reported load) on load when pumping and positive in "hydro" when generating. This may be difficult to account for as has been done for Germany.
This was everything I could find in that document noted above that should help in the CO2eq balancing equations you guys are using.
HansHyde
on 10 Dec 2017
Imports from Ontario constituted around 5% of NYISO supply at one point today
jarek
on 10 Dec 2017
@jarek - upto 200MW can be a result of the Lake Erie loop effect - a balancing necessity due to EISO's exports to MISO.
HansHyde
on 11 Dec 2017
Next step is to split Ontario exchanges as @jarek pointed out. Thanks all for pushing this forward!
corradio
on 11 Dec 2017
@systemcatch is there a "good" reason for both NY & CA showing up as "United States of America - New York", as opposed to "USA-NY" (or "USA-New York") as all the other states are showing up?
USA-state name (or abbreviation) is sufficient IMHO
HansHyde
on 11 Dec 2017
@HansHyde it's to do with how the locale is translated in https://github.com/tmrowco/electricitymap/blob/master/web/locales/en.json#L387. Only NY and CA have actually been translated, the rest just default to the zone name. The name is making the box kind of long, though if we switched it I would keep full state names as not everyone knows all the states.
systemcatch
on 11 Dec 2017
Copy that @systemcatch - please see my last comment on #143
HansHyde
on 11 Dec 2017
NYISO update
NYISO three (3) Zones (Regions) - see attached image
- NYISO 1 _(this will be quite green on EM)_
- NYISO 2 _(this is be tan on EM)_
- NYISO 3 _(this will be approaching black)_

- NYPA - NY Power Authority runs NY's 3 large hydro & pumped storage units & the transmission system. Currently in contact with a colleague at NYPA.
- Inquiring on realtime data access. NYISO "Fuel Mix" does not report status of the PS - (charge/discharge).
- Inquiring about INTERNAL Interface Flows, so we can attribute data streams accurately in 3 Zone geometries
Hi Hans... Moses Saunders has 32 turbines, with 16 operated by Ontario Hydro and 16 by NYPA. The other facilities, including Lewiston pump storage in Niagara are entirely operated by NYPA. I know that there is a website out there somewhere that provides real time data for these facilities, because I remember watching it a few years ago during the summer as NY's peak load approached 34,000 megawatts. I cant seem to find it right now, but will ask somebody today in our energy control center of its whereabouts. I will also get you a contact there that would be able to better answer any technical questions. I am leaving for Puerto Rico on sunday, so let me apologize in advance if I am slow to respond to questions during the next six weeks!
- "Loads & Flows" provides all realtime data for Internal (2) & External (10) InterConnections - http://www.nyiso.com/public/markets_operations/market_data/maps/index.jsp
- Organizing "Backend Mechanics", so available data streams can be linked to parsers correctly - _90% complete_
- "Current Fuel" underreports when compared to "Loads & Flows" - upwards of 20-25%.
Isolate Generation & External Interfaces by 3 Zones & Fuel Type - _90% complete_
NYISO 3 Zones affected by...
- Ontario - EM live
- Quebec - no parser
- 6 New England States (NEISO) - @systemcatch located data stream, parser not started
- PJM - not started
Est. Comp. - _less than 1 week_ - b4 customized geometries are available
HansHyde
on 15 Dec 2017
[unneeded - deleted]
HansHyde
on 16 Dec 2017
Have you tried using google sheet? I know that you can write script that
automatize what you need
https://webapps.stackexchange.com/questions/95739/
automatically-split-text-to-column-using-google-app-script
For excel, there may be a way but i haven't looked at it in detail sorry!
 brunolajoie
on 17 Dec 2017
brunolajoie
on 17 Dec 2017
Let's please try to keep the conversation on this issue related to improvements or new information regarding real-time data for NYISO.
The noise level is quite high and it makes it very hard for newcomers (or even myself) to keep track of progress. For conversations, let's use slack instead.
Thanks guys :)
I believe next step is to split Ontario exchanges as stated in https://github.com/tmrowco/electricitymap/issues/898#issuecomment-350636232
corradio
on 17 Dec 2017
@brunolajoie & @corradio - copy, I have sorted it.
It is an improvement, as I have now sorted all the realtime External exchanges with NYISO - 10 total (which includes one for Ontario) and working on the Internal Exchanges in NYISO - 7 total (which will allow us to balance the External Exchanges properly).
Can either of you provide the link to the Real-Time Generation Mix you are using in the Parser? The link above gives a daily file that updates every 5 minutes, then creates a new file for each day?
HansHyde
on 17 Dec 2017
@HansHyde That's the link used. We just request the file for the current day.
We'll need to add capacities for New York state. Luckily the EIA provides breakdown by type at the state level here. If anyone wants to do that then feel free.
systemcatch
on 17 Dec 2017
@systemcatch - already calculated NY capacities
NYISO has 3 realtime data streams available & of use to us...
- Generation Mix - dynamic CSV link named "Reports/Real-Time Fuel Mix", updates every 5 minutes, creates new file every day - http://www.nyiso.com/public/markets_operations/market_data/reports_info/index.jsp
- Interchanges - static CSV link named "Most Recent Data", updates every 5 minutes, no log created of past datestamps - http://mis.nyiso.com/public/csv/ExternalLimitsFlows/currentExternalLimitsFlows.csv
- Zonal Loads - dynamic csv link named "Load Data/Actual Load/Real-Time", updates every 5 minutes, creates new file every day - http://www.nyiso.com/public/markets_operations/market_data/load_data/index.jsp
If anyone was in contact with them, and they were to create "Most Recent Data" static links for 1 & 3, that would make ElectricityMap's efforts easier, no?
HansHyde
on 17 Dec 2017
@systemcatch @corradio
Are you able to pull this RTD for 1. Generation Mix (from the "_Real-Time Fuel Mix_" csv)?
Bold data is "Gen Type" & "Generation (MWH)"
- 12/18/2017 00:05:00,EST,Dual Fuel,2391.0
- 12/18/2017 00:05:00,EST,Natural Gas,2298.0
- 12/18/2017 00:05:00,EST,Nuclear,4400.0
- 12/18/2017 00:05:00,EST,Other Fossil Fuels,0.0
- 12/18/2017 00:05:00,EST,Other Renewables,276.0
- 12/18/2017 00:05:00,EST,Wind,439.0
- 12/18/2017 00:05:00,EST,Hydro,3021.0
Are you able to pull this RTD for 3. Zonal Load (from the "_Actual Load/Real Time_" csv)?
Bold data is "Zone" & "Load MWH)
- "12/18/2017 00:00:00","EST","CAPITL",61757,1348.2
- "12/18/2017 00:00:00","EST","CENTRL",61754,1794.3
- "12/18/2017 00:00:00","EST","DUNWOD",61760,607.2
- "12/18/2017 00:00:00","EST","GENESE",61753,1067
- "12/18/2017 00:00:00","EST","HUD VL",61758,1060.3
- "12/18/2017 00:00:00","EST","LONGIL",61762,2079.8
- "12/18/2017 00:00:00","EST","MHK VL",61756,903.2
- "12/18/2017 00:00:00","EST","MILLWD",61759,300.9
- "12/18/2017 00:00:00","EST","N.Y.C.",61761,5178
- "12/18/2017 00:00:00","EST","NORTH",61755,622.9
- "12/18/2017 00:00:00","EST","WEST",61752,1693.4
As long as you can access it, I am working out the back end "formulas" so that we can balance it all within NY and also to neighboring regions. Sorry, as they are dynamic files (unlike the static csv link in 2. Interchanges) I can't access them with Excel.
FYI 3. Zonal Load will correspond with Electricity Pricing data (at a future time for EM), possibly in a sum ((Load 1 * Zone 1 $) + (Load 2 * Zone 2 $) + ... ) format to give a weighted average price in NY.
Latest version of these efforts (NYISO worksheet)...
HansHyde
on 18 Dec 2017
First things first.
Do we have real-time generation mix per zone? Else, there's no way to move further.
I only see load per zone in what you sent. That is not enough. We need the mix.
corradio
on 18 Dec 2017
@corradio - no disrespect (as I know I am only 10 days new to Github & Slack & 30 min of online tutorials into Python), but you are way over your head with how electric systems operate. Maybe, ENSOE spoon feeds all the data exactly as ElectricityMap needs, (Generation Mix, Generation, Exchanges & Prices) but this will not be the case with the US.
Chris @systemcatch seems to get it (based on how he configured NEISO), and to build the US we are going to need some of those skills magnified. We are also going to need some "temporary" builds/layouts to make it all work.
I added those "issues" as I can not add (or do not know how to without getting way over my head in the EM python coding) "pull requests", but they are the perfect sized units we will need to build the US. Each will require some backend calculations (which I am attempting to decipher which is not easy (nor can I post every data link or working excel file I am using to do so) and it starts in NY) in order to make it work with the realtime information we have available to us.
And you have closed them??? These will require input from other contributors as well - hence why they should be open.
You didn't close Moldova - that has no better/no worse data than I am providing???
None of the information I have provided is without at least 1 form of verification, if not multiple. I have read through over 500 pages of data/reports already.
Again, no disrespect, but the US is not going to be built as "easily" as has Europe with one central "Energy Union" organization & ENSOE data clearing house to retrieve realtime data.
Please reopen them, as I do not have the time to keep explaining the what & the why for the information I am providing & methodology, and I don't have time to keep tracking down closed "issues" or whatever one wants to call them. Others could start building them/looking for further information.
Have you at least looked at the breakdown of the US from the EIA I posted last night in #903 (which you have closed also)? Here it is again... https://www.eia.gov/todayinenergy/detail.php?id=27152
HansHyde
on 18 Dec 2017
Issues about data that do not bring real-time generation mix information clutter our (already very high) amount of issues. Because they do not enable us to implement anything, they should and will be closed.
It's not personal: it's simply a matter of project management. Furthermore, it would be very rude for me to question your knowledge of how electricity systems operate - and I apologise if it was felt that way. It was never the intention.
Let's take it offline to make sure no personal feelings get in the way.
Finally, I will close this issue as it seems to me we can't bring NYISO further without having a proper breakdown of generation mix per zone.
If anyone has any information about real-time generation mix data that can enable us to breakdown NYISO to their 3 subzones, feel free to re-open the issue with additional data.
Thank you all for the hard work put here.
Olivier
corradio
on 18 Dec 2017
@systemcatch
I converted NYISO's Real-Time Fuel Mix and Real-Time Load csv files into Excel and noticed that there were some instances of R-TFM having extra timestamps. It was about 15 instances over the 24hr, 5 minute frequency daily csv dataset. Some we doubles on the ##:05 increments (with different generation values), others were intra-frequency timestamps such as ##:13 or ##:22.
Not certain if the Parser (pandas?) you built for this filters doubles or extras out, but wanted to let you know.
I am not certain if Electricity Map currently has the capacity to display a real-time System Load line on the Generation Mix graph, but if it does you can sum the 11 (CAPITL <--> WEST) values, reporting at the same frequency of R-TFM, in this CSV file to report it.
http://mis.nyiso.com/public/csv/pal/20180106pal.csv
There is no "static" daily CSV url, but I believe you know how to have it switch to new daily CSV created every day.
This real-time system load line (if possible) could act as a data check that internal generation + imports/exports are all reporting/balancing within the Parser & (multiple) Exchanges.
HansHyde
on 7 Jan 2018
@HansHyde I don't see the duplicates in 6th Jan, which day were you looking at?
systemcatch
on 7 Jan 2018
@systemcatch I found them on both the 5th & 6th... I think it might be a system error on their part (data reporting delays), but as long as it's not causing issues or the pandas filter them out as irregular, then all is good.
HansHyde
on 7 Jan 2018
@systemcatch
PS, I'm getting close to cracking how we can separate the pumped hydro that counts against hydro generation but doesn't get reported distinctly.
Look here... all generation & import/exports accounted for on Jan 5
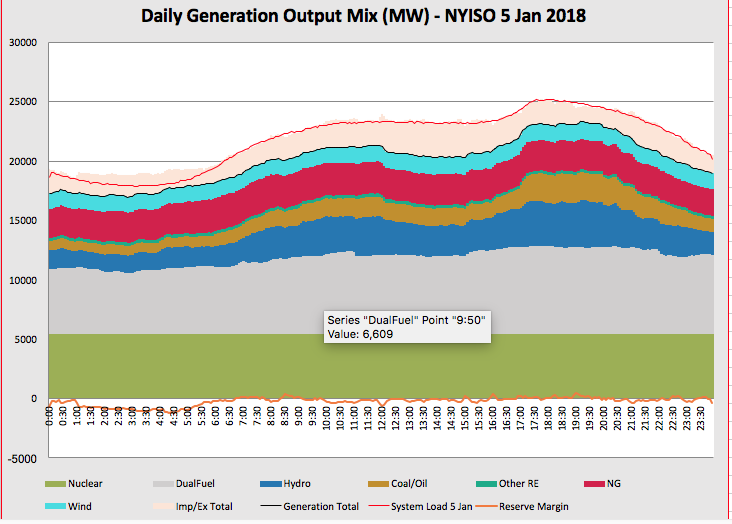
NY Gen is blue & below, pink band is imports, System Load is the red line. I calculated Reserve Margin (actual) from the data - the orange line at the bottom +/- that should be 5-7% of system demand, and never a negative value.
But we can see during the 1am to 6am hours hydro drops off (NY's biggest hydro are run-of-the-river), load drops well below Gen + Imports (to about the tune of 2.5 GW - NY's PS capacity) and come evening peak, hydro goes double.
The PS design at Niagara gets a multiplier... it only costs 240 MW into the reservoir drawing from the penstock, then dumps this water in just above all the generators of the Niagara power project.
HansHyde
on 7 Jan 2018
Related issues
 alixunderplatz
·
4Comments
alixunderplatz
·
4Comments
 consideRatio
·
4Comments
consideRatio
·
4Comments
 Alain-Ivadolabs-Ext
·
4Comments
Alain-Ivadolabs-Ext
·
4Comments
 pascalheraud
·
4Comments
pascalheraud
·
4Comments
 StefanAO
·
4Comments
StefanAO
·
4Comments