Electricitymap-contrib: Singapore has solar data
https://www.emcsg.com/ has generation mix for Singapore. It's overwhelmingly gas, but it is real time... Raw data comes from https://www.emcsg.com/ChartServer/blue/ticker (updated half-hourly).
The data has demand and "system loss" in MW, and mix in percent. Should generation be calculated based on demand plus system loss, then?
The data also contains prices for the following categories: USEP, LCP, Primary Reserve,
Secondary Reserve, Contingency Reserve, and Regulation. Is one of those of interest for the price parser?
 jarek
jarek
All 14 comments
Found this for the explanation of the prices https://www.emcsg.com/marketdata/guidetoprices
jarek
on 26 Jul 2017
@jarek nice find on the data. I searched around and found this report from the government which may be useful in cross checking some figures. System loss looks quite low but Singapore is very compact so it makes sense I guess.
 systemcatch
on 27 Jul 2017
systemcatch
on 27 Jul 2017
Indeed generation should be based on demand + loss.
For the prices I think that's a tricky issue. In general we have to rethink how we want to show prices, because currently they are very hard to compare.
Let's leave prices out for now, or simply take the spot price.
 corradio
on 27 Jul 2017
corradio
on 27 Jul 2017
OK, I'll write a parser for the generation and the USEP now then.
jarek
on 27 Jul 2017
Awesome!
On Thu, Jul 27, 2017 at 8:33 PM, jarek notifications@github.com wrote:
OK, I'll write a parser for the generation and the USEP now then.
—
You are receiving this because you commented.
Reply to this email directly, view it on GitHub
https://github.com/tmrowco/electricitymap/issues/653#issuecomment-318448661,
or mute the thread
https://github.com/notifications/unsubscribe-auth/ABlEKO9UkUIuIcyo-N10KgC85hr2eY3qks5sSNgVgaJpZM4OkHwm
.
corradio
on 27 Jul 2017
Now done :tada:
jarek
on 3 Aug 2017
@corradio @jarek
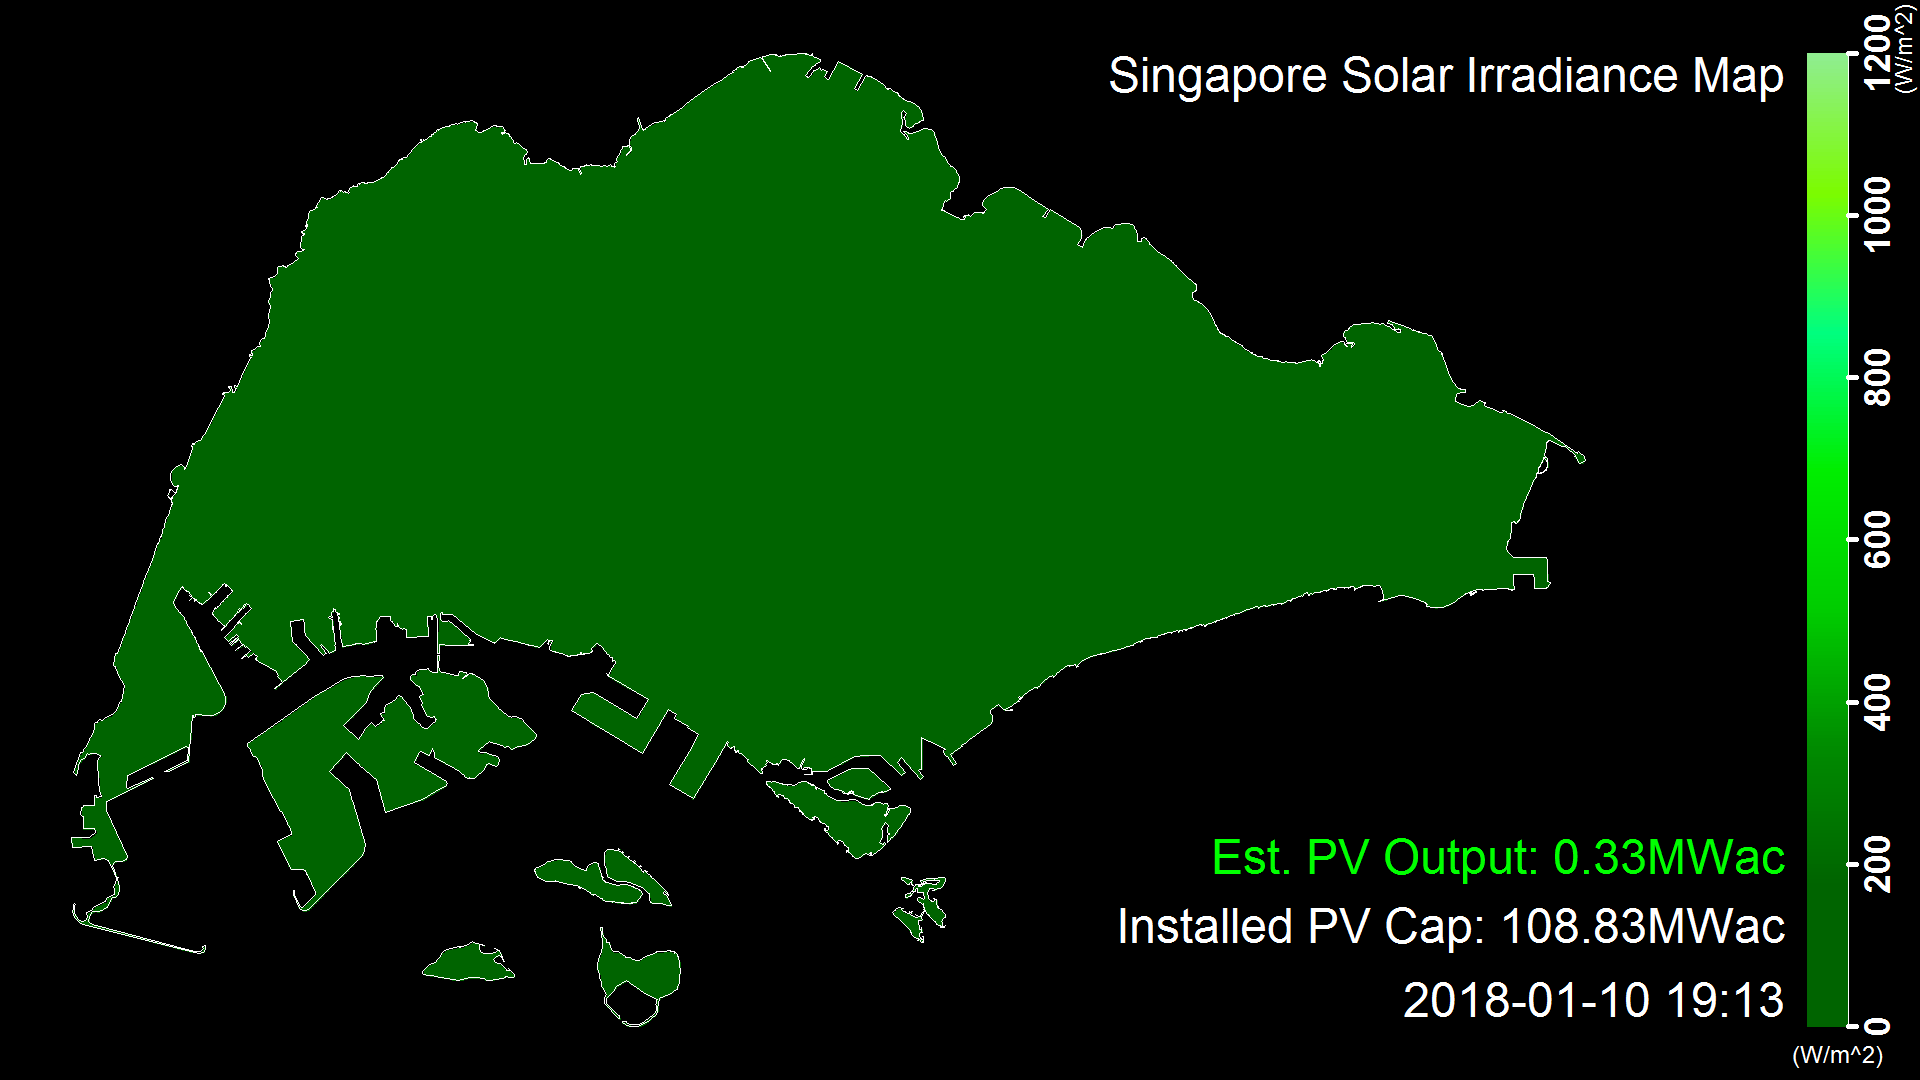
I found a link to Singapore's PV production.
https://www.ema.gov.sg/solarmap.aspx
Unfortunately, it's a png-image only.
https://www.ema.gov.sg/cmsmedia/irradiance/plot.png?ref=636512085214679676
Installed inverter capacity is ~109 MW, so only 1% of natural gas capacity / <2% of current daily peak demand.
Installed PV module capacity is ~141 MW according to:
https://www.ema.gov.sg/cmsmedia/Publications_and_Statistics/Statistics/31RSU.pdf
It's a quite insignificant share at the moment, but is there any way to use OCR or something similar for reading the data?
Edit: I've just seen PV was also described in the documentation in the Singapore parser, also mentioning its small impact on the mix. So the source for real time data is the only thing adding new info ;)
 alixunderplatz
on 10 Jan 2018
alixunderplatz
on 10 Jan 2018
@alixunderplatz OCR would be fun to try.
Running the following commands on your image.
convert sing_pv.png -threshold 30% sing_bw.gif
tesseract sing_bw.gif output
Tesseract Open Source OCR Engine v3.03 with Leptonica
Gives me this result in a .txt file.
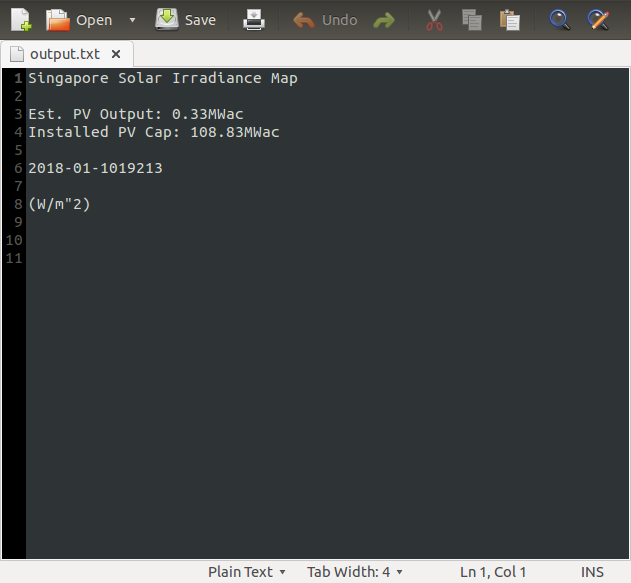
We're in business!
systemcatch
on 10 Jan 2018
@systemcatch That simple, wow :) 👍 ❤️
As you can see, there is an output of 0.33 MW now, although it's night in Singapore. I don't think it comes from light pollution but it is kind of an "offset" value from their radiation data.
Would make sense to implement a threshold like 1 MWac or sth.
Edit: right now its 0 MWac, so forget the stuff about the threshold :)
alixunderplatz
on 10 Jan 2018
@systemcatch I noticed the image's URL is changing - it is refreshing every minute according to the site https://www.ema.gov.sg/solarmap.aspx
NEXT EDIT: Numbers behind the image URL are irrelevant.
alixunderplatz
on 10 Jan 2018
haha that's brilliant! 🔍
 brunolajoie
on 10 Jan 2018
brunolajoie
on 10 Jan 2018
Maybe we can email them and ask if same info is available in text format somewhere
jarek
on 10 Jan 2018
Built a function that gets this data. Only question is whether it should be added to SG.py or in parsers/lib like AU_solar.
systemcatch
on 21 Feb 2018
All done here, feel free to reopen if anything new comes up.
systemcatch
on 28 Feb 2018
Related issues
 StefanAO
·
4Comments
corradio
·
4Comments
StefanAO
·
4Comments
corradio
·
4Comments
 ghost
·
5Comments
ghost
·
5Comments
 consideRatio
·
4Comments
systemcatch
·
5Comments
consideRatio
·
4Comments
systemcatch
·
5Comments
Most helpful comment
@alixunderplatz OCR would be fun to try.
Running the following commands on your image.
Gives me this result in a .txt file.

We're in business!