Electricitymap-contrib: Map is too dark
 corradio
All 31 comments
Here's a test:

corradio
on 12 Mar 2017
Not bad actually!
 brunolajoie
on 13 Mar 2017
brunolajoie
on 13 Mar 2017
@scarlac FYI, this is a screenshot of the Uber Movement dataset, where they use a similar color scale:

corradio
on 17 Mar 2017
Where do we stand on this issue? I like your first screenshot Oli. Spring is coming, we need more light :)
 ThierryOllivero
on 26 Mar 2017
ThierryOllivero
on 26 Mar 2017
Didnt have time to work on it. I think we should investigate the Uber colorscale on the light template.
corradio
on 26 Mar 2017
What about this?

corradio
on 18 Apr 2017
I liked better the other one. This one makes me sad. Don't know why.
ThierryOllivero
on 18 Apr 2017
I share Thierry's opinion
brunolajoie
on 19 Apr 2017
I think that we should put an option to switch between the original (That it would be a great dark/night theme) and the one in the screenshot
 Raffox97
on 19 Jun 2017
Raffox97
on 19 Jun 2017
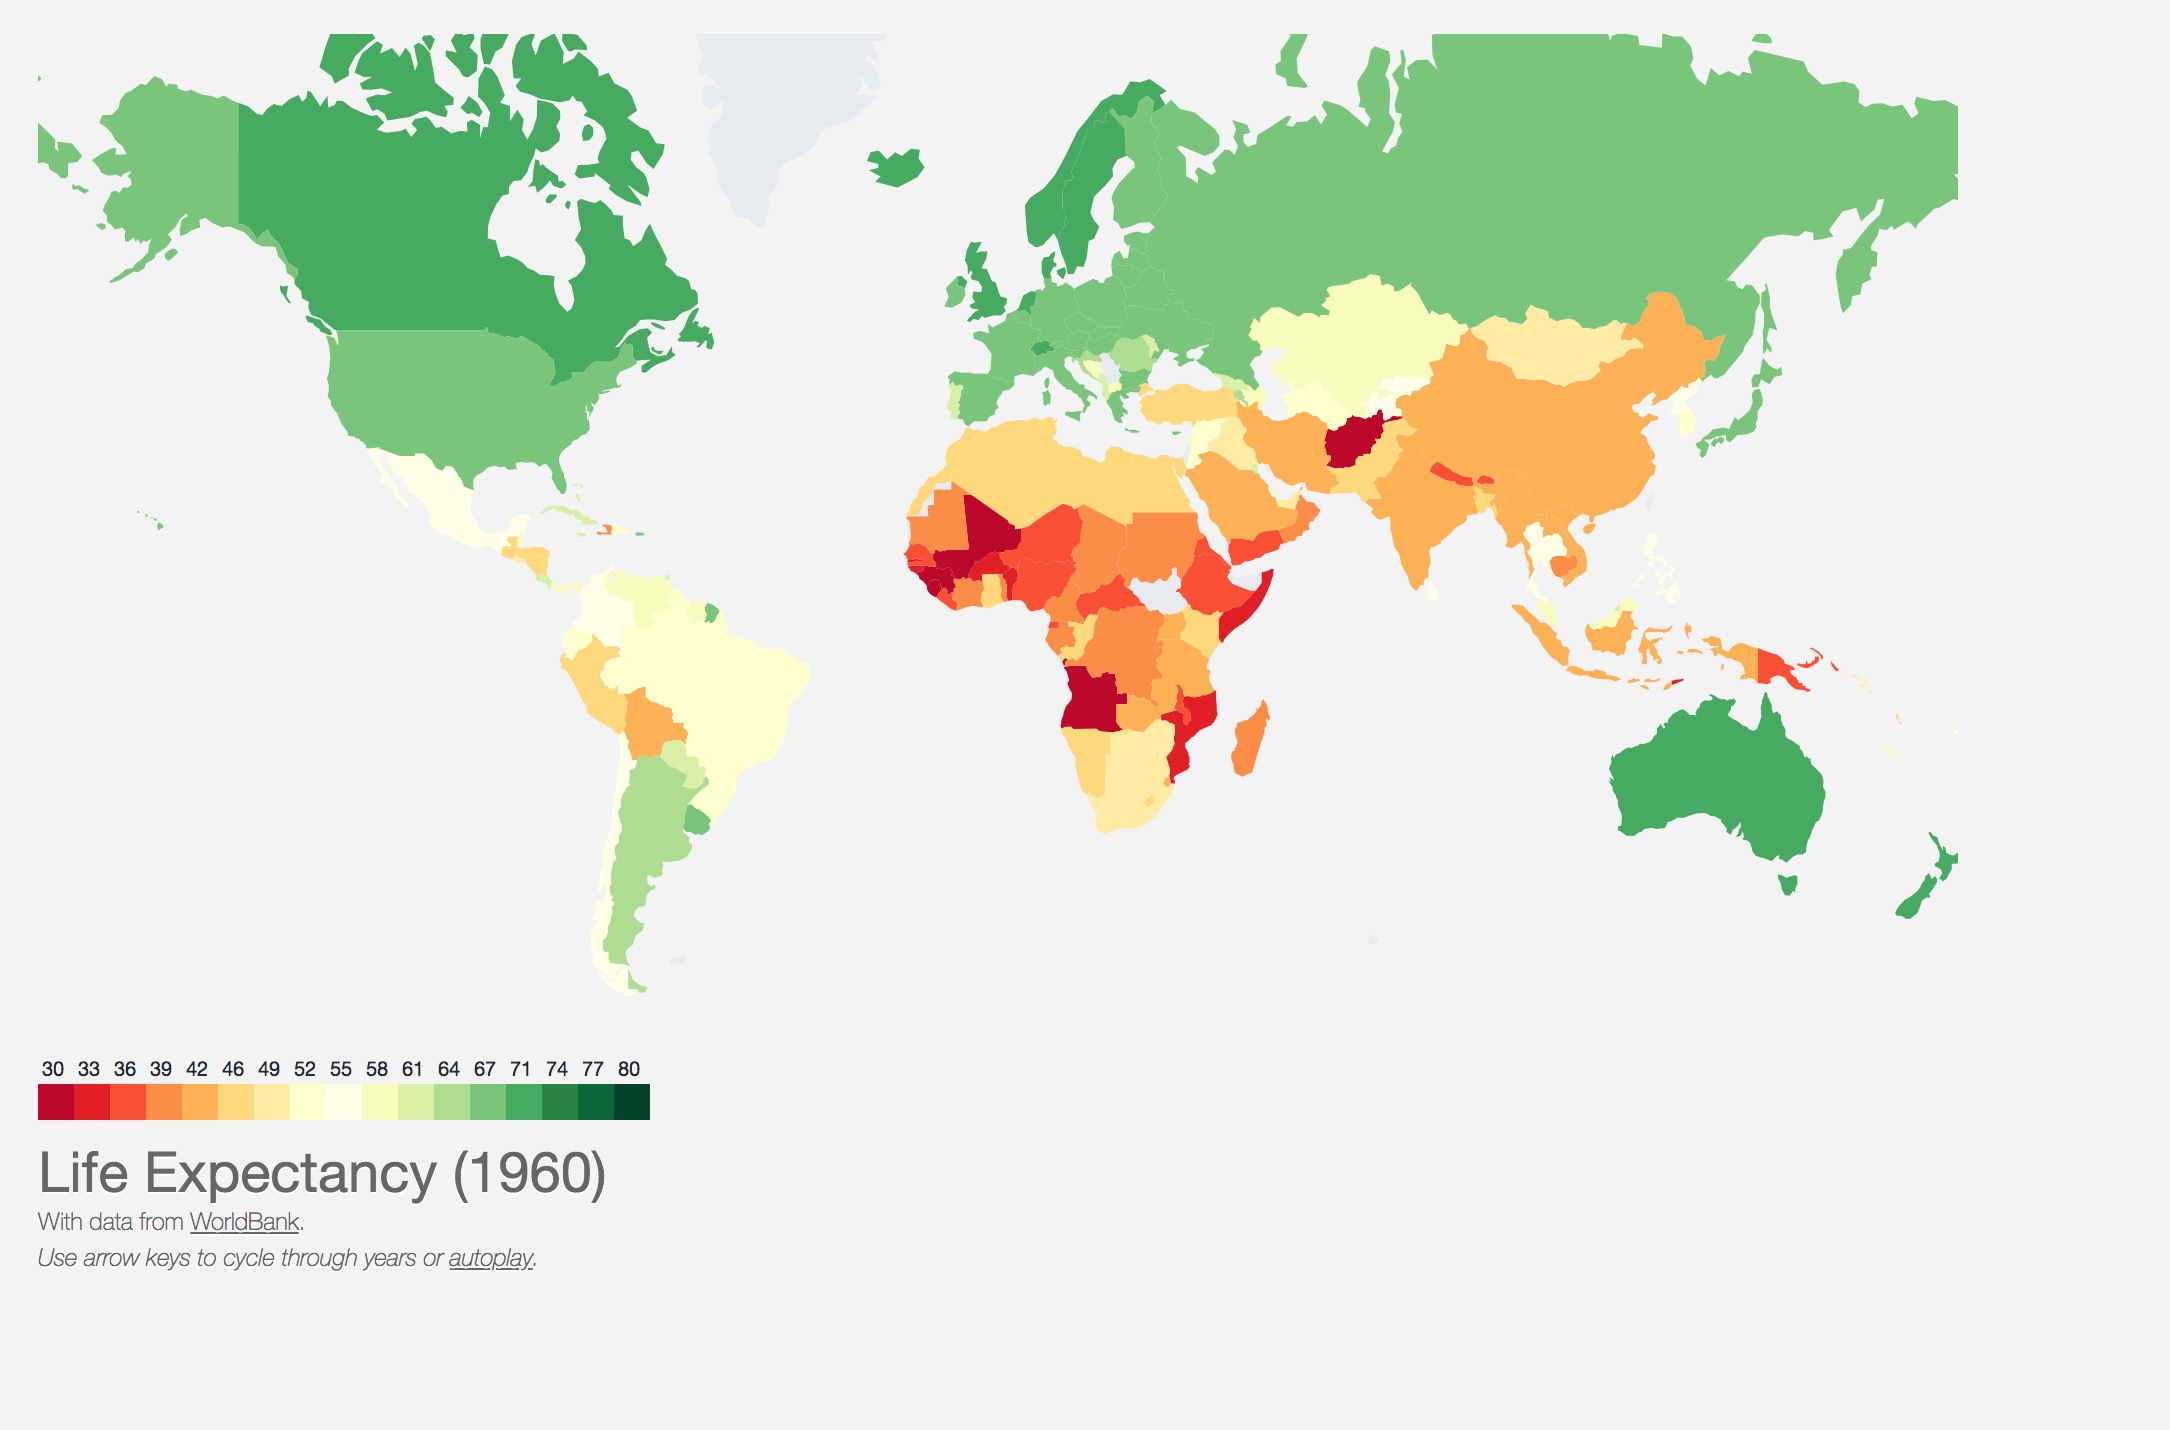
I like the first proposal for lighter background colors. Additionally, I've mocked up a single-hue scale for carbon intensity below:
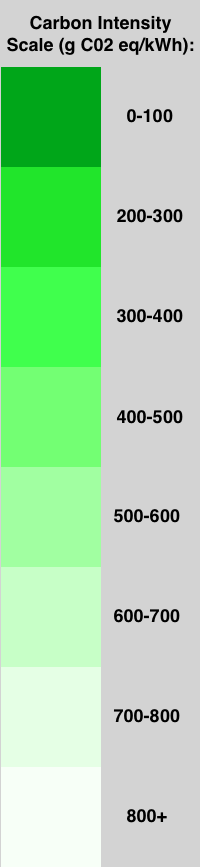
My reasoning for switching to a single-hue scale:
Intuitively, it doesn’t make sense to me to represent carbon intensity in non-green colors/multiple colors. I understand the motivation behind using blacks/oranges to represent countries with high carbon intensity, but I think that this could confuse users who might associate these colors more with temperature, solar resources, or another metric. Currently, the transition of greens to orange/black implies a change from positive to negative values in my mind. Yet the actual measures start at an absolute zero and increase from there. What I’m proposing is a scale reflects this absolute zero with a very light color and increases in saturation with an increase in carbon-neutral energy infrastructure. In this scale, a more intense green would mean a less carbon-intensive energy mix. From a psychological standpoint, we would be representing a country with a high carbon intensity as lacking in “green energy” infrastructure as opposed to that country being “bad”. I think that climate change activism already suffers from an overuse of finger-pointing and blaming, so there could be something useful here in terms of positive psychology. Also, green is of course generally the color most-associated with eco-friendly things. That being said, these ideas are largely based off of my assumptions and I think that such a change would best be made after some validated learning is done.
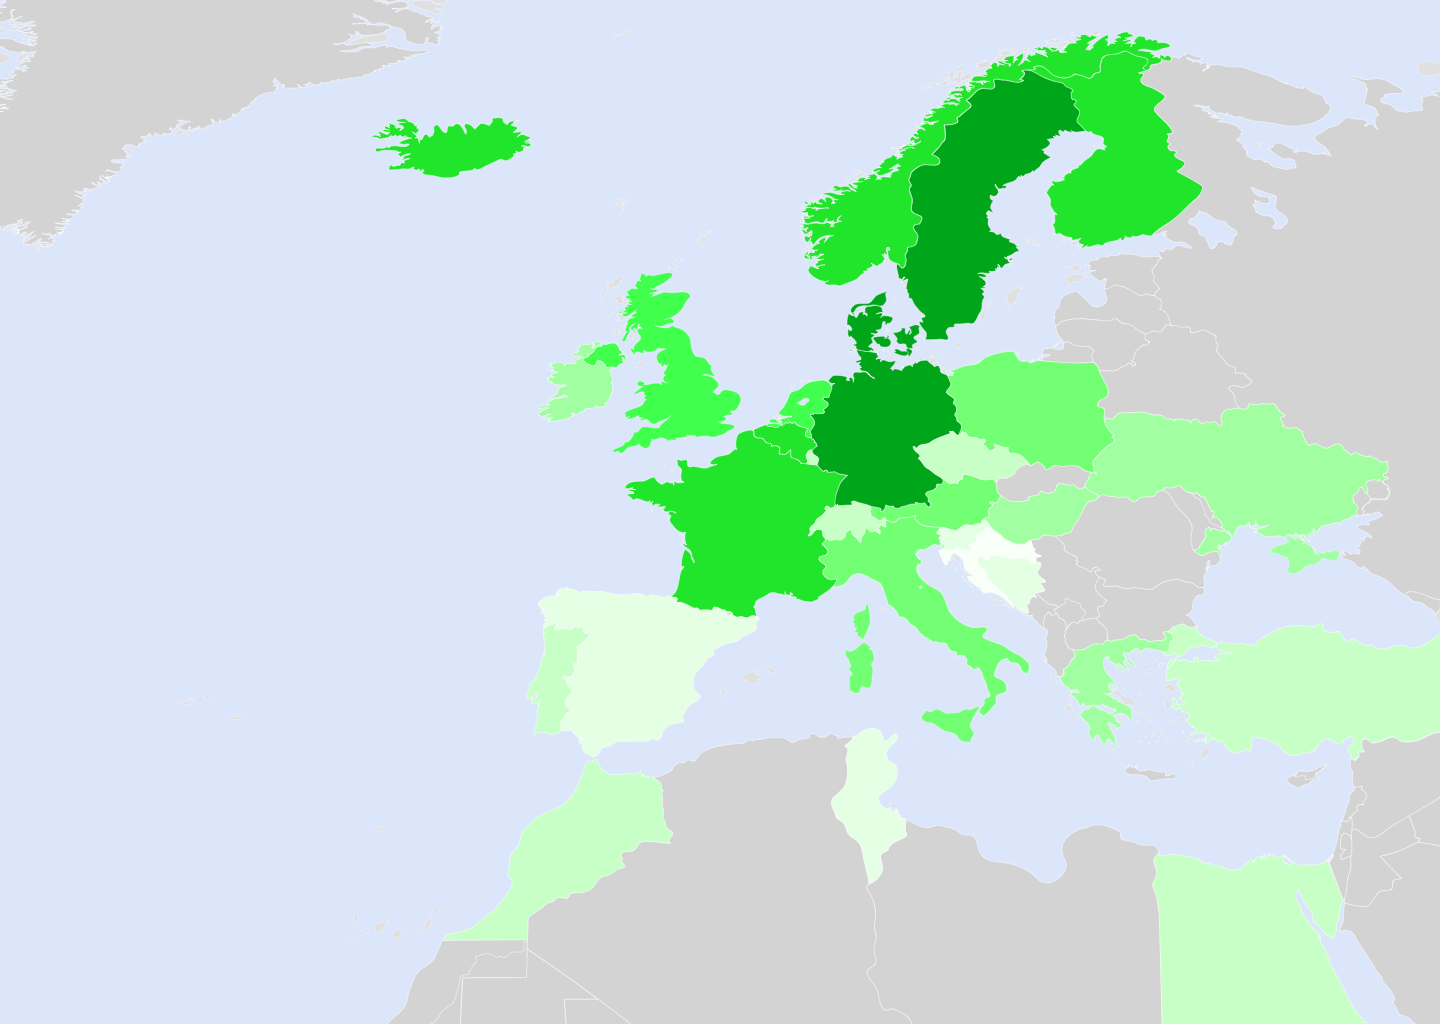
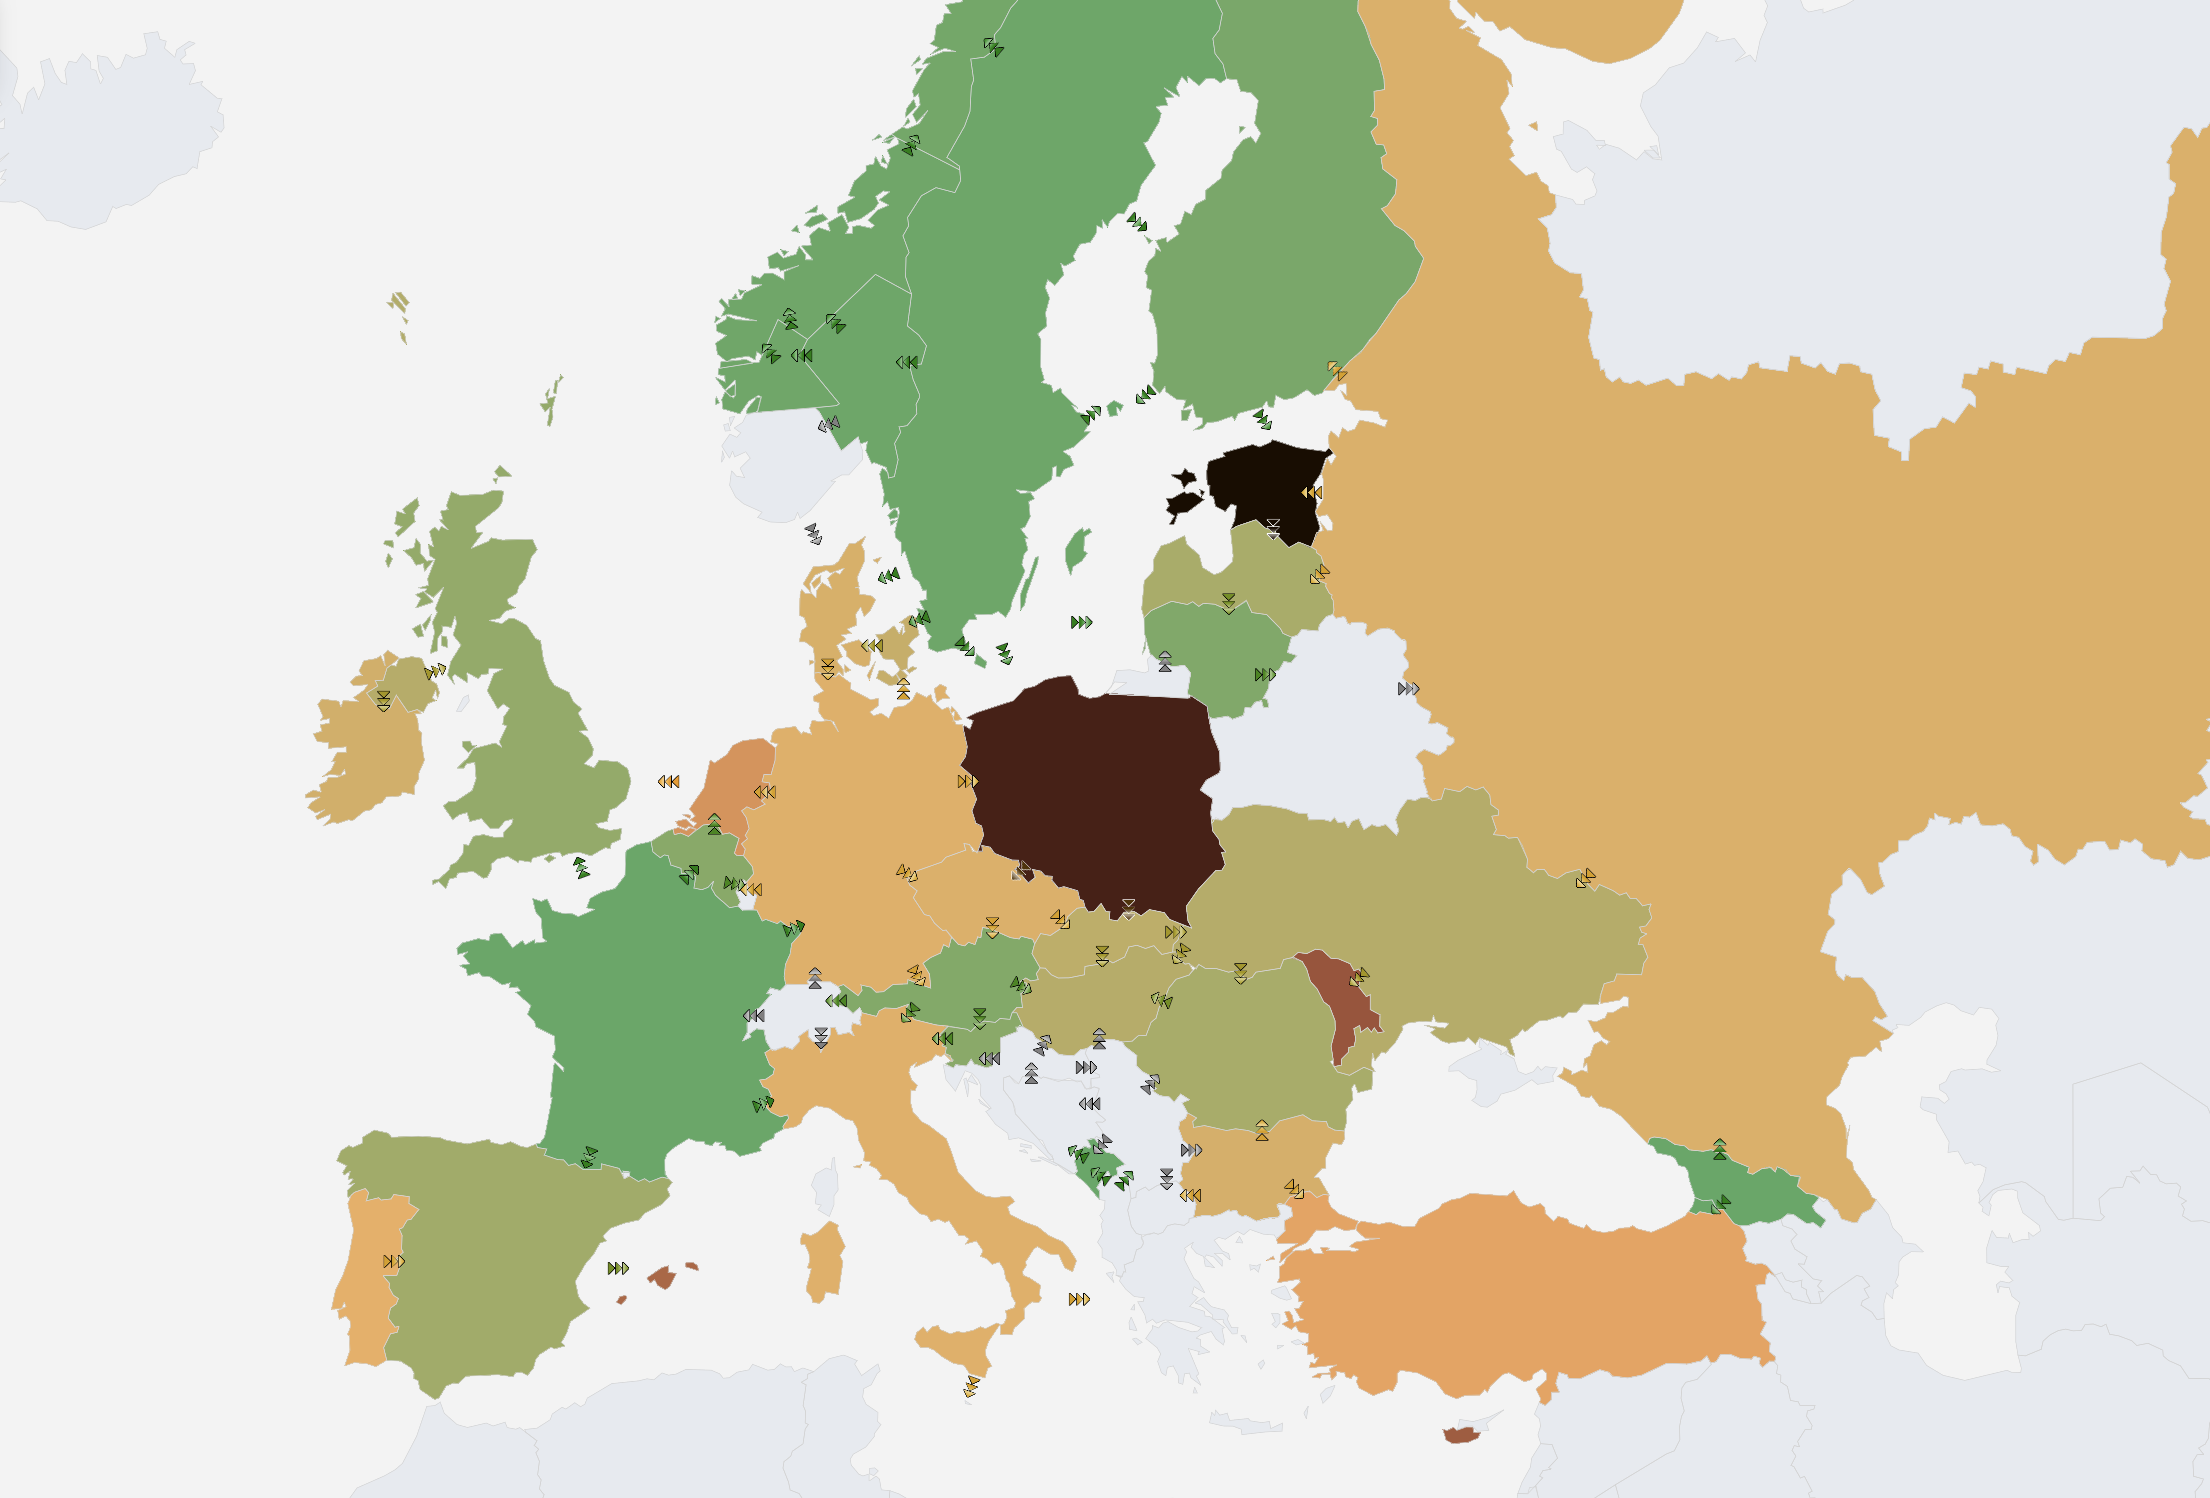
Eliminating the blacks and oranges from the color scale gives us more flexibility in color schemes on the rest of the map, particularly when viewing the solar/wind resources layers in conjunction with the carbon intensity layer.
And here's what it would look like on the actual map (note: the assigning of colors is not accurate, and several countries are intentionally grey to represent a lack of data):
 tth4vb
on 26 Jun 2017
tth4vb
on 26 Jun 2017
For colours, we could use something like https://jiffyclub.github.io/palettable/ , e.g. getting colours from "Greens_9" palette" is possible continuously.
Key term when reading about this is apparently "sequential palette". I was reading http://seaborn.pydata.org/tutorial/color_palettes.html#sequential-color-palettes, though note that sequential palettes usually provide a set amount of colours, which won't work for us. Palettable apparently supports continous, somehow, though I'm not sure how.
 jarek
on 26 Jun 2017
jarek
on 26 Jun 2017
I think the key issue here is whether we should be using a sequential or gradient palette, gradient allowing for more continuous granularity in data representation.
My opinion is that we don't need to use a gradient palette and can instead put each country into a histogram-style bucket for carbon-intensity, as I don't think the users will really be able to distinguish slight changes in the colors if two countries are off in carbon intensity by 10g C02 eq/kWh for example.
I think in terms of visually communicating information in a way that is immediately useful to someone reading this map, it generally would be more useful to use a sequential system and put the two fictional countries in the above example in the same color on the color scale. That being said, I can see an argument for a gradient, but I feel like I need to hear a good concrete use case to sell me on it.
tth4vb
on 26 Jun 2017
I like where this is going. Regarding color, I'd like to suggest going for a single hue, but instead of showing the amount of green infrastructure, I'd show instead the amount of fossil fuel (for example with a white -> brown scale).
The reason is that, for carbon emissions, what matters is turning off the fossil fuel production, not necessarily building more green production modes.
corradio
on 3 Jul 2017
A possible issue with featuring fossil fuels is that currently the header is "Live CO2 emissions of electricity consumption", so you'd have to change that and all the translations. I do see your point about rewarding turning off fossil though...
Regarding continuous gradient vs e.g. 9 colours. I agree that 78 vs 87 g co2eq/kWh isn't really an important distinction to make. A downside is that when using distinct categories, you have to draw the boundaries somewhere, so you might be making a colour distinction between 98 and 102 g/kWh. Although, depending on how different visually the 9 colours are, that might not be a big issue in practice if they look fairly similar anyway.
jarek
on 3 Jul 2017
@jarek Sorry for not being clear. I didn't mean change from co2 intensity
to fossil fuel %. Instead, I simply meant that instead of using a scale
that shows amount of "greenness", we could use a scale that shows the
amount of "darkness", i.e. from white to brown (from 0 to 800 gCO2/kWh).
On Mon, Jul 3, 2017 at 10:58 PM, jarek notifications@github.com wrote:
A possible issue with featuring fossil fuels is that currently the header
is "Live CO2 emissions of electricity consumption", so you'd have to change
that and all the translations. I do see your point about rewarding turning
off fossil though...Regarding continuous gradient vs e.g. 9 colours. I agree that 78 vs 87 g
co2eq/kWh isn't really an important distinction to make. A downside is that
when using distinct categories, you have to draw the boundaries somewhere,
so you might be making a colour distinction between 98 and 102 g/kWh.
Although, depending on how different visually the 9 colours are, that might
not be a big issue in practice if they look fairly similar anyway.—
You are receiving this because you authored the thread.
Reply to this email directly, view it on GitHub
https://github.com/tmrowco/electricitymap/issues/391#issuecomment-312732629,
or mute the thread
https://github.com/notifications/unsubscribe-auth/ABlEKASYJOEHNHFL4MfGTnhkf_Os0qFMks5sKVYAgaJpZM4ML968
.
corradio
on 4 Jul 2017
I fully support the idea of a single-hue, changing according to CO2 emissions, with a color that could highlight the fact that high fossil fuels means high CO2 emissions (correlation and causation).
ThierryOllivero
on 4 Jul 2017
Other examples:
https://www.mapbox.com/gallery/#map-3
http://feltron.com/BikeCycle.html
corradio
on 13 Sep 2017
I like the idea of having the option to switch between different colour schemes, though I don't know if that's loads of work to implement on the frontend? The oceans on the map currently look very dark and I think that making them lighter (e.g. 12 Mar screenshot) would improve the focus on countries.
 systemcatch
on 13 Sep 2017
systemcatch
on 13 Sep 2017
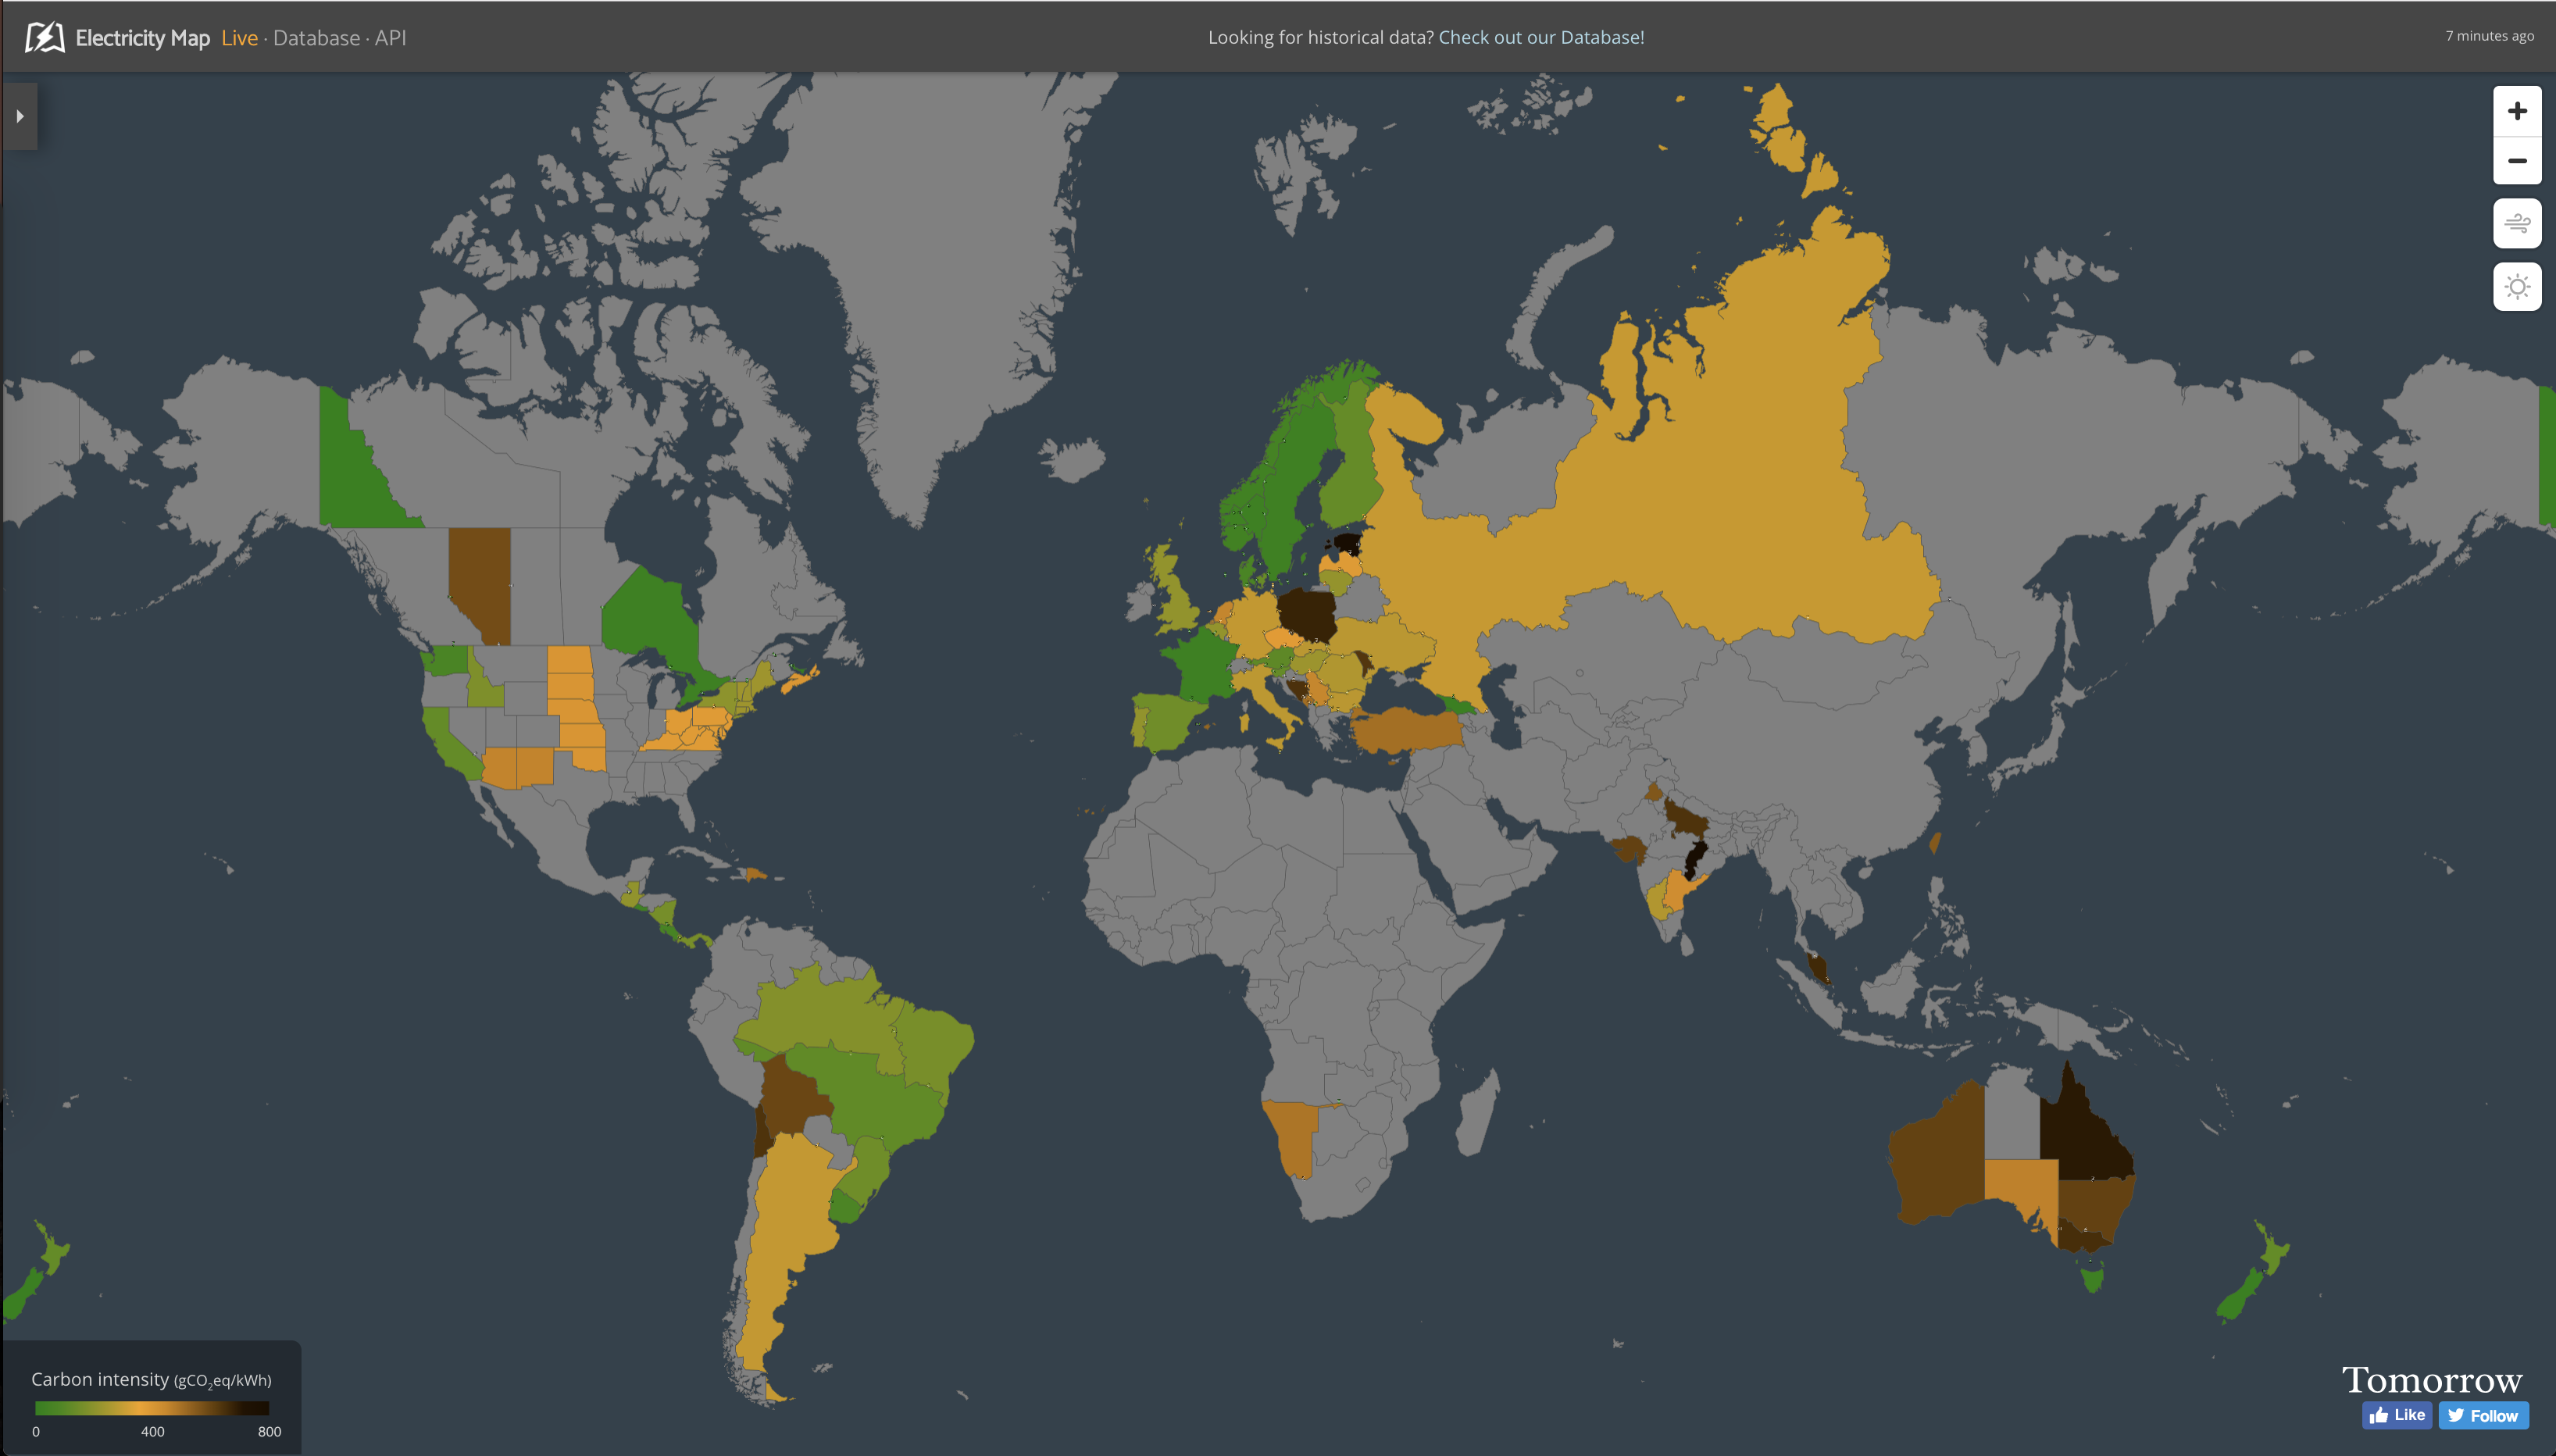
On a projector, the issue becomes quite apparent:
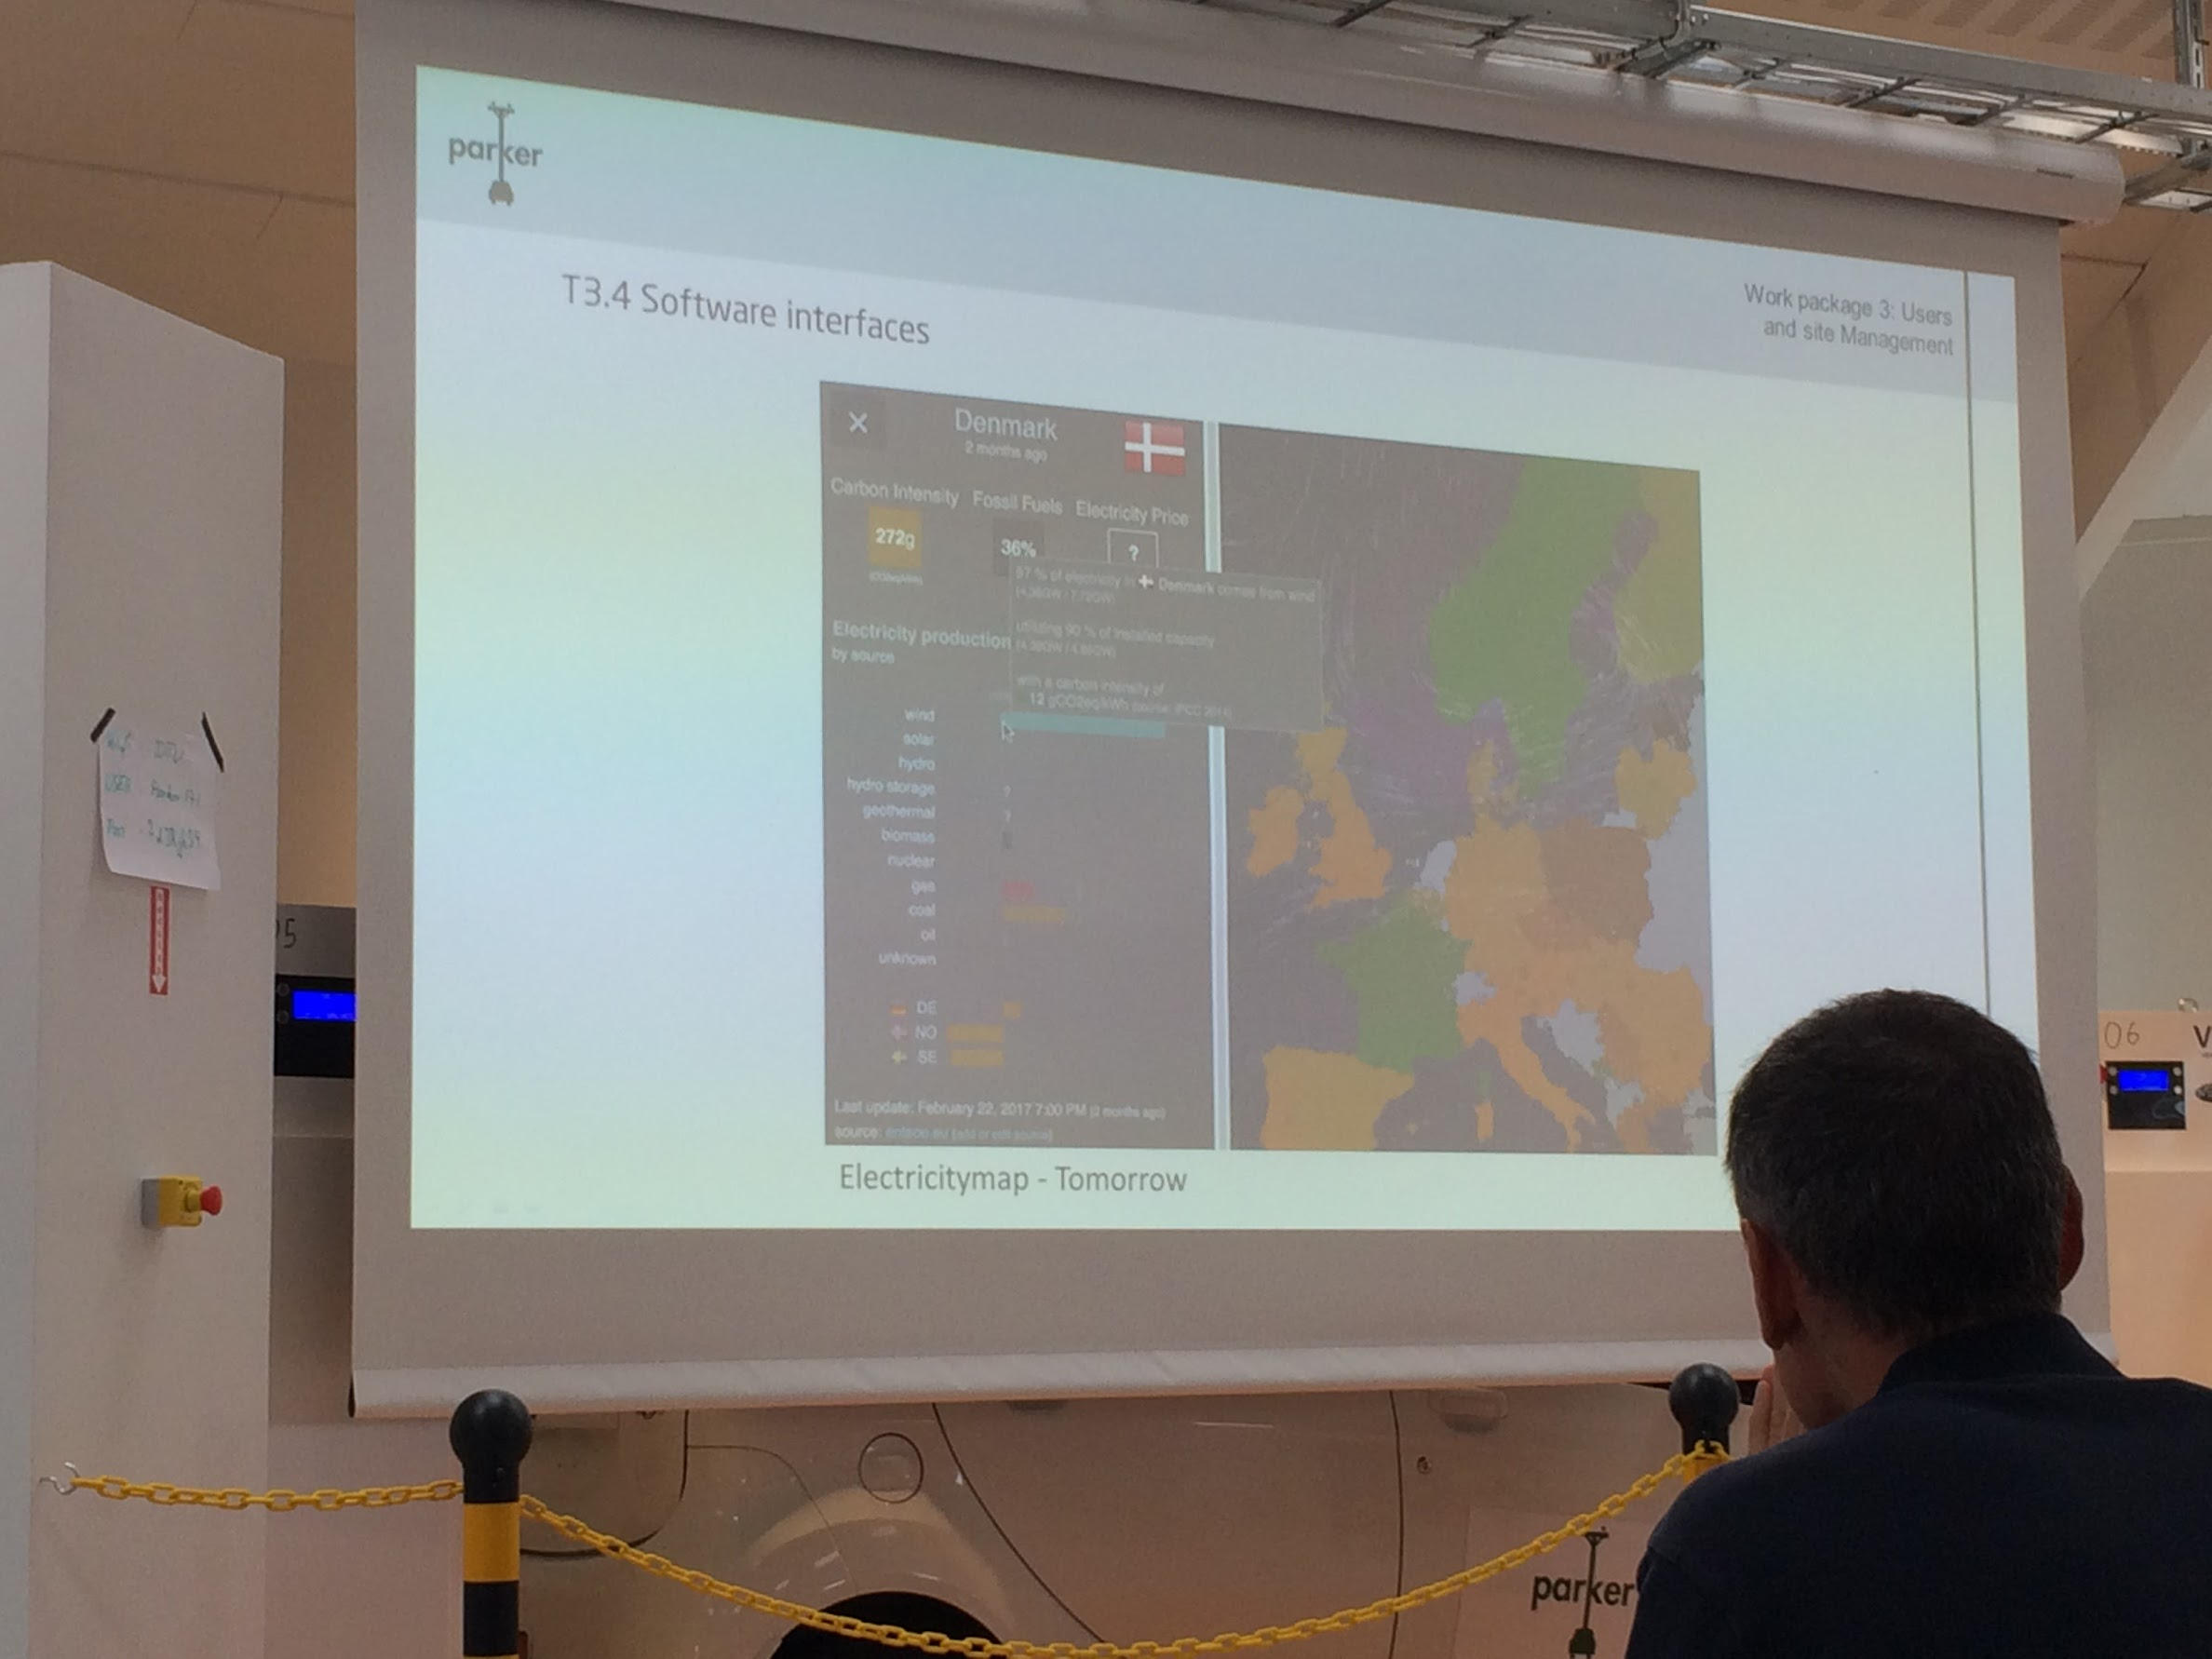
corradio
on 20 Sep 2017
Basically it seems that the country colors blend with the panel background and with the sea.
The contrast ration should probably be bigger.
corradio
on 20 Sep 2017
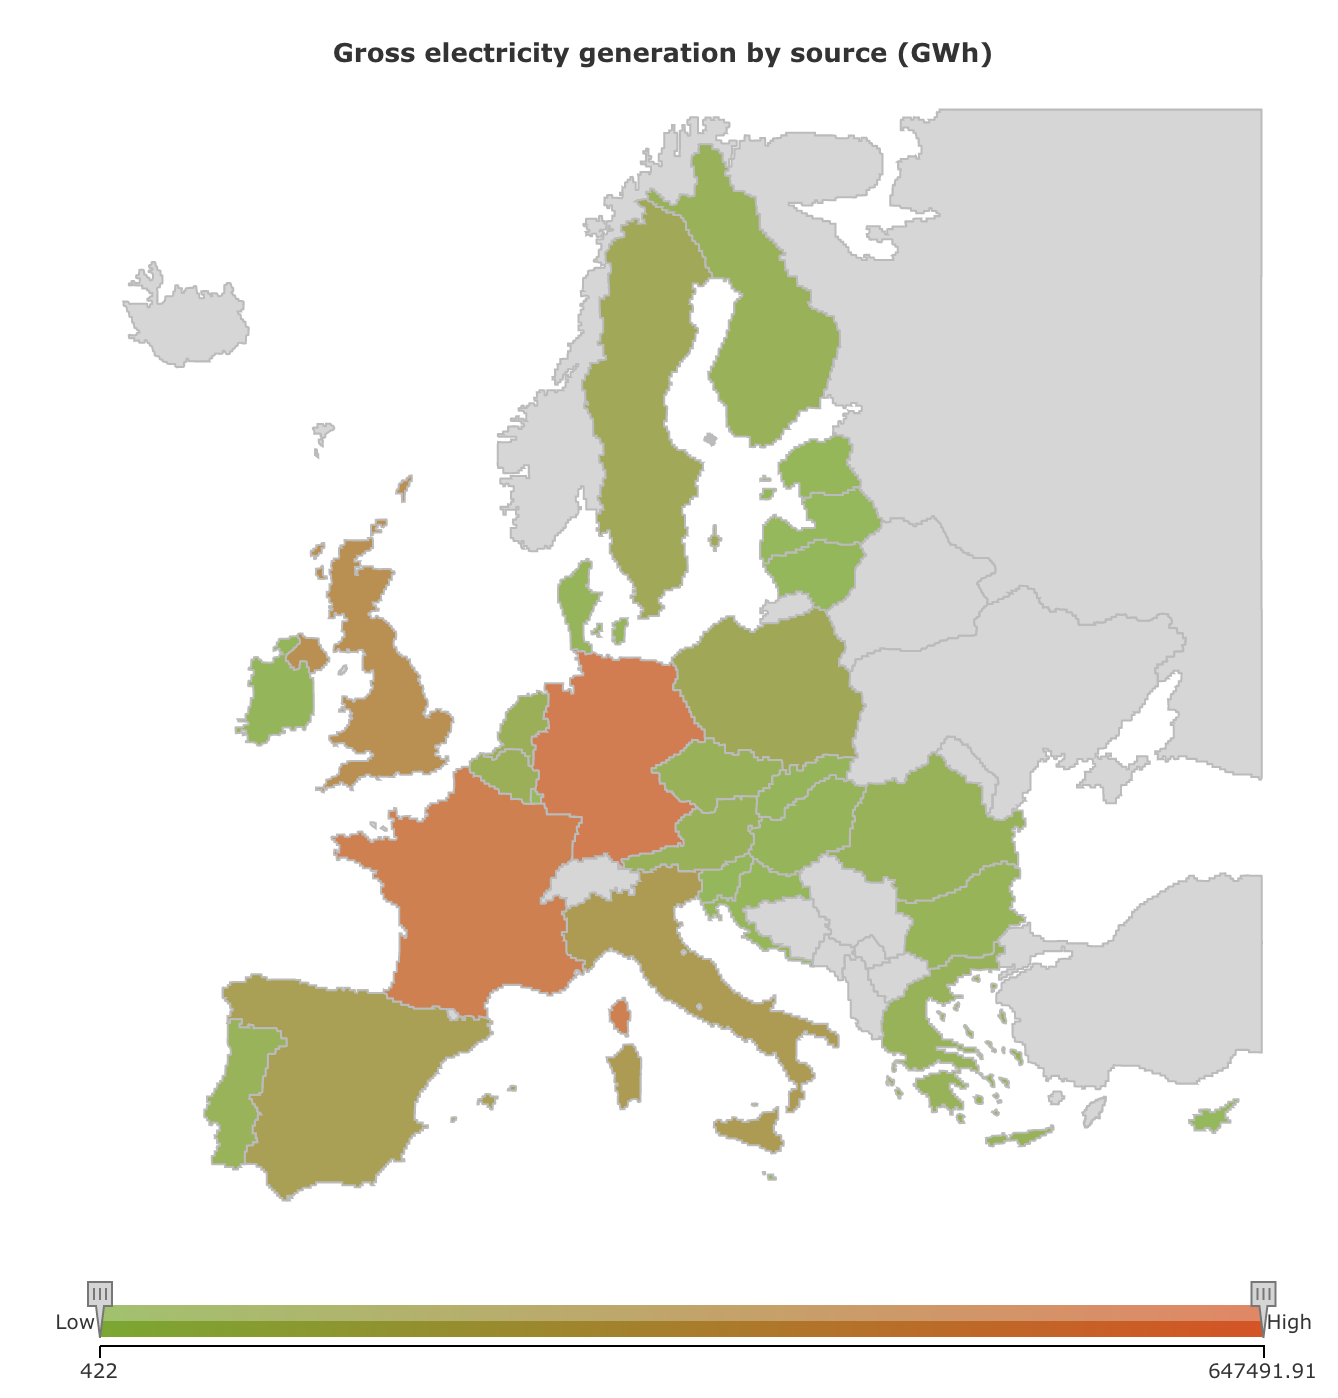
More inspiration:
corradio
on 22 Feb 2018
I really like this color scheme. The greens are friendly, the sea color is unobtrusive. The only thing I'd change is stronger outlines for countires, apart from that Iove it. Will make a test in the near future to try it out.
 ovbm
on 9 May 2018
ovbm
on 9 May 2018
corradio
on 11 May 2018
That looks damn cool. The're just a bit of lack of contrast between a no-data country and the sea probably
brunolajoie
on 12 May 2018
Proposal for a new bright mode:
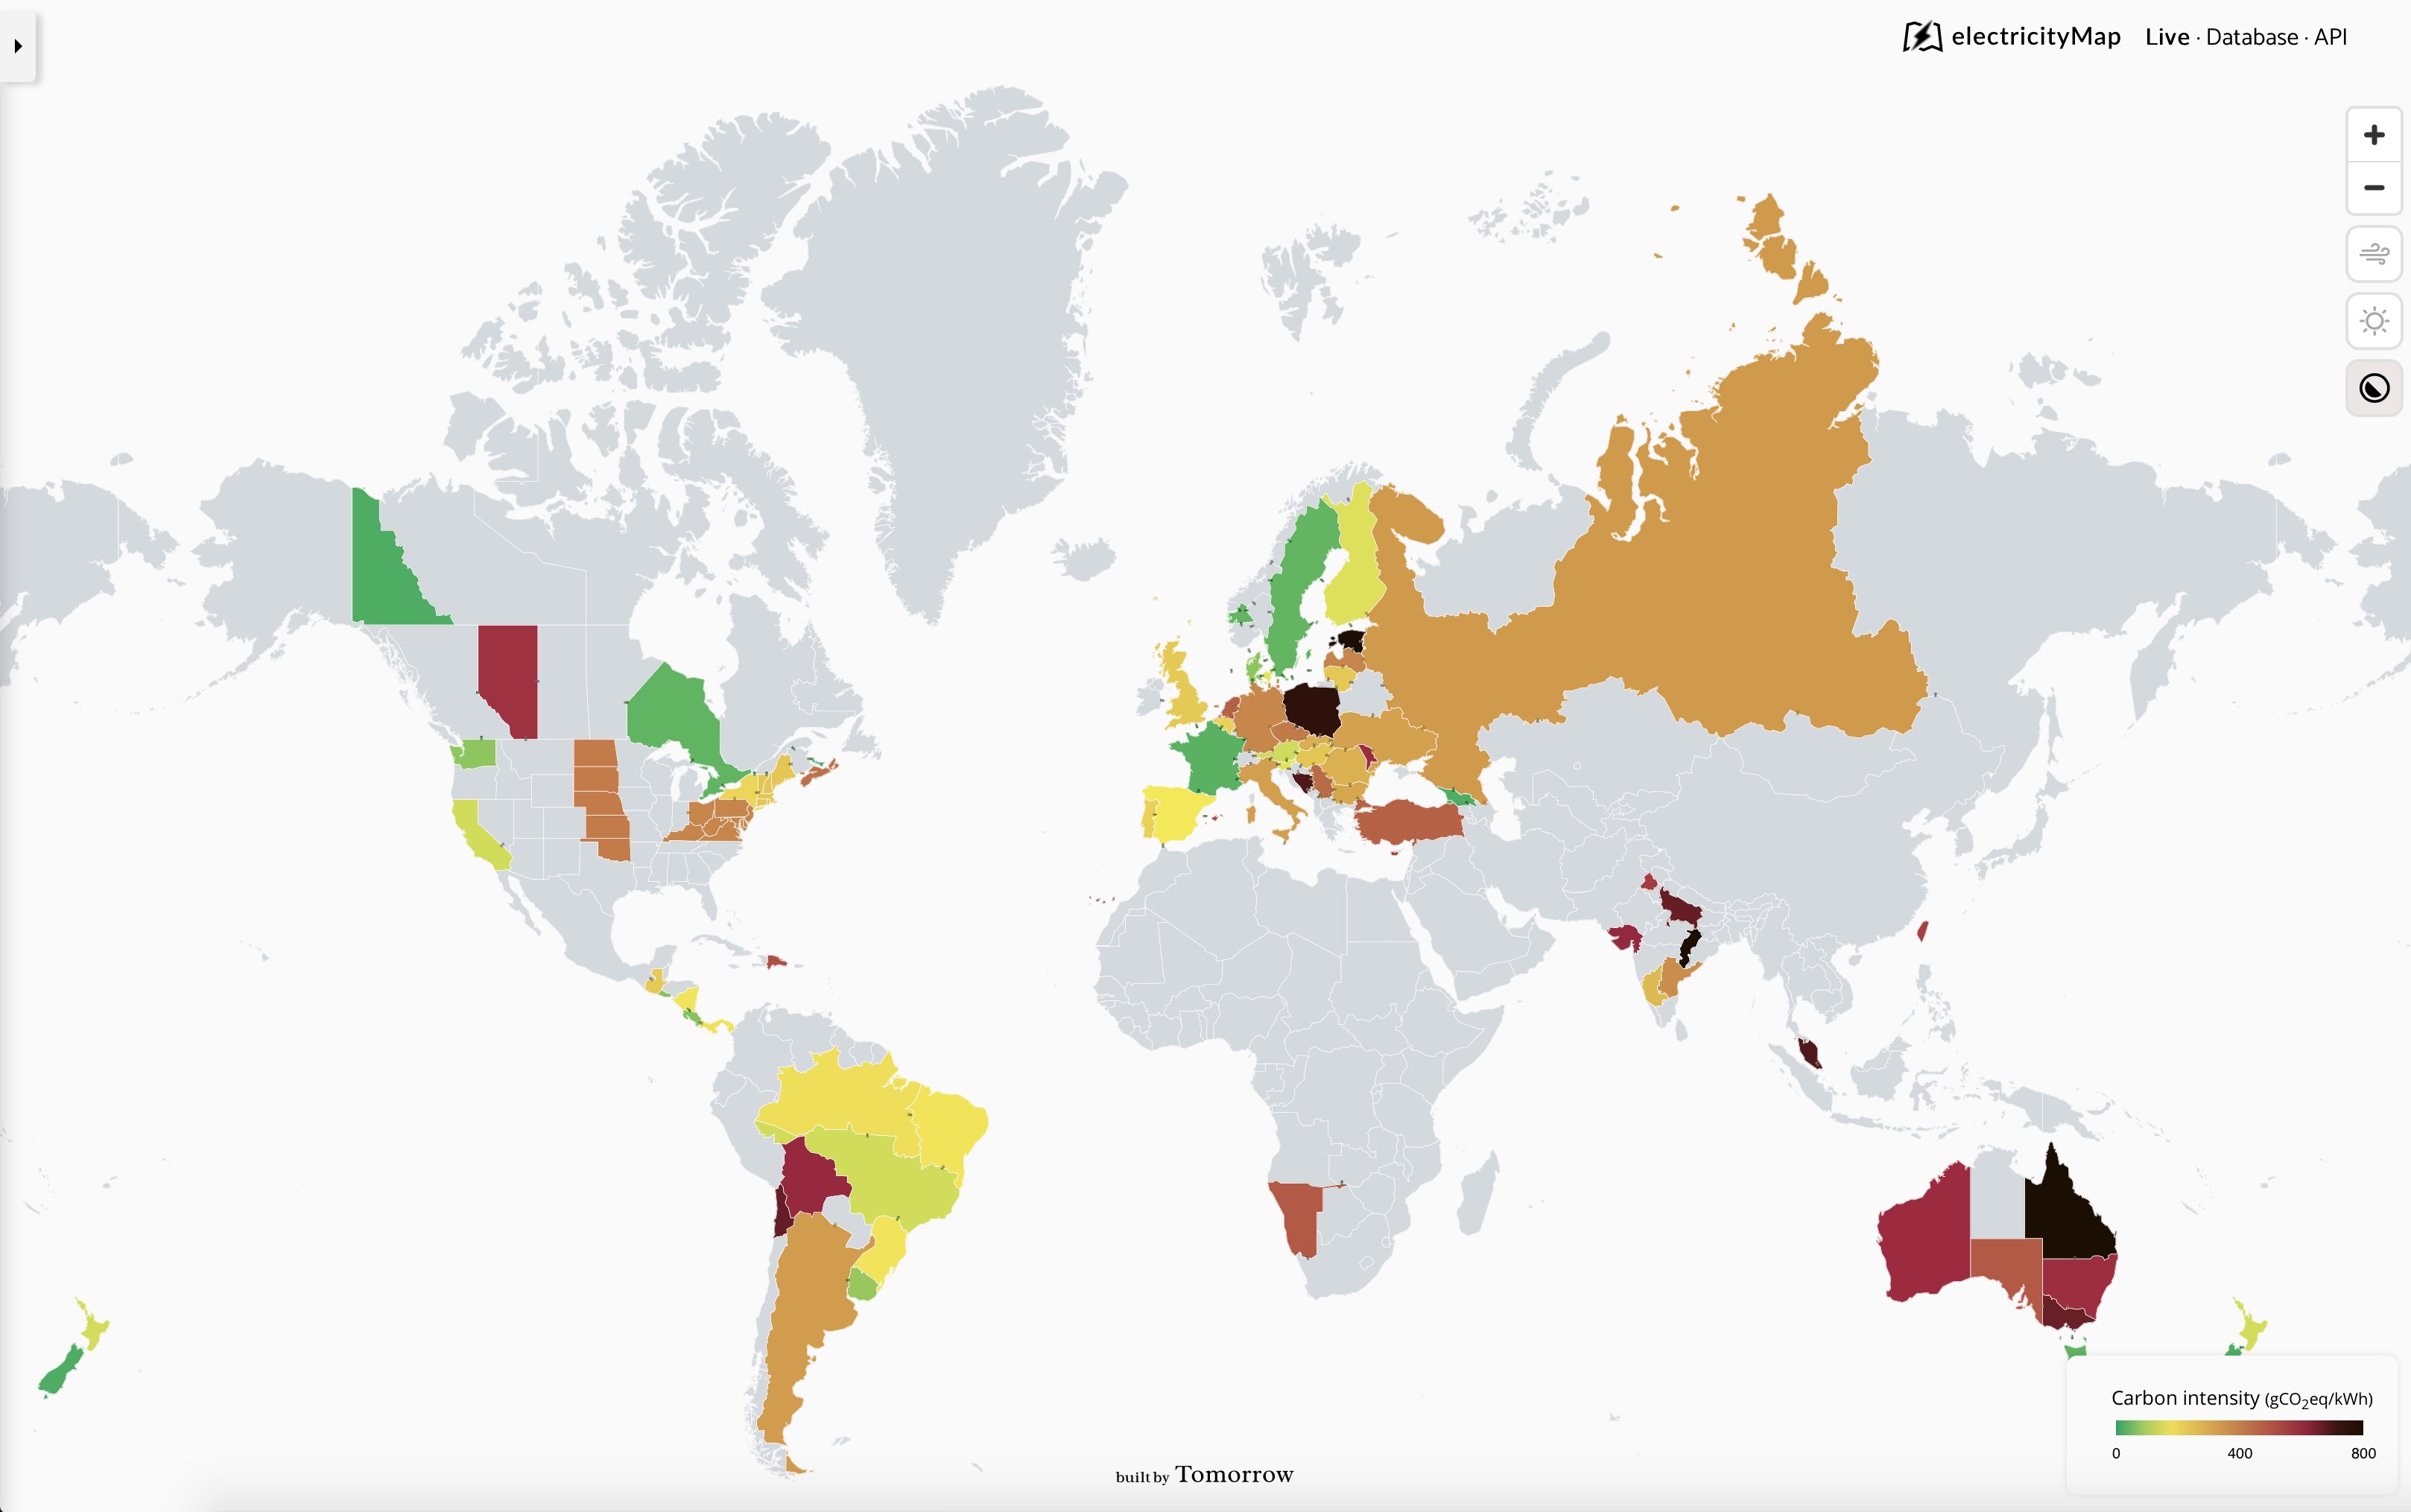
The Co2 Color scale now goes from green to yellow orange and (new) into red/wine before going to black.
Some UI elements have also changed. Topbar was removed, some ui elements shifted. All in all the intention was to declutter the map-view and make it breath more.
ovbm
on 18 Jun 2018
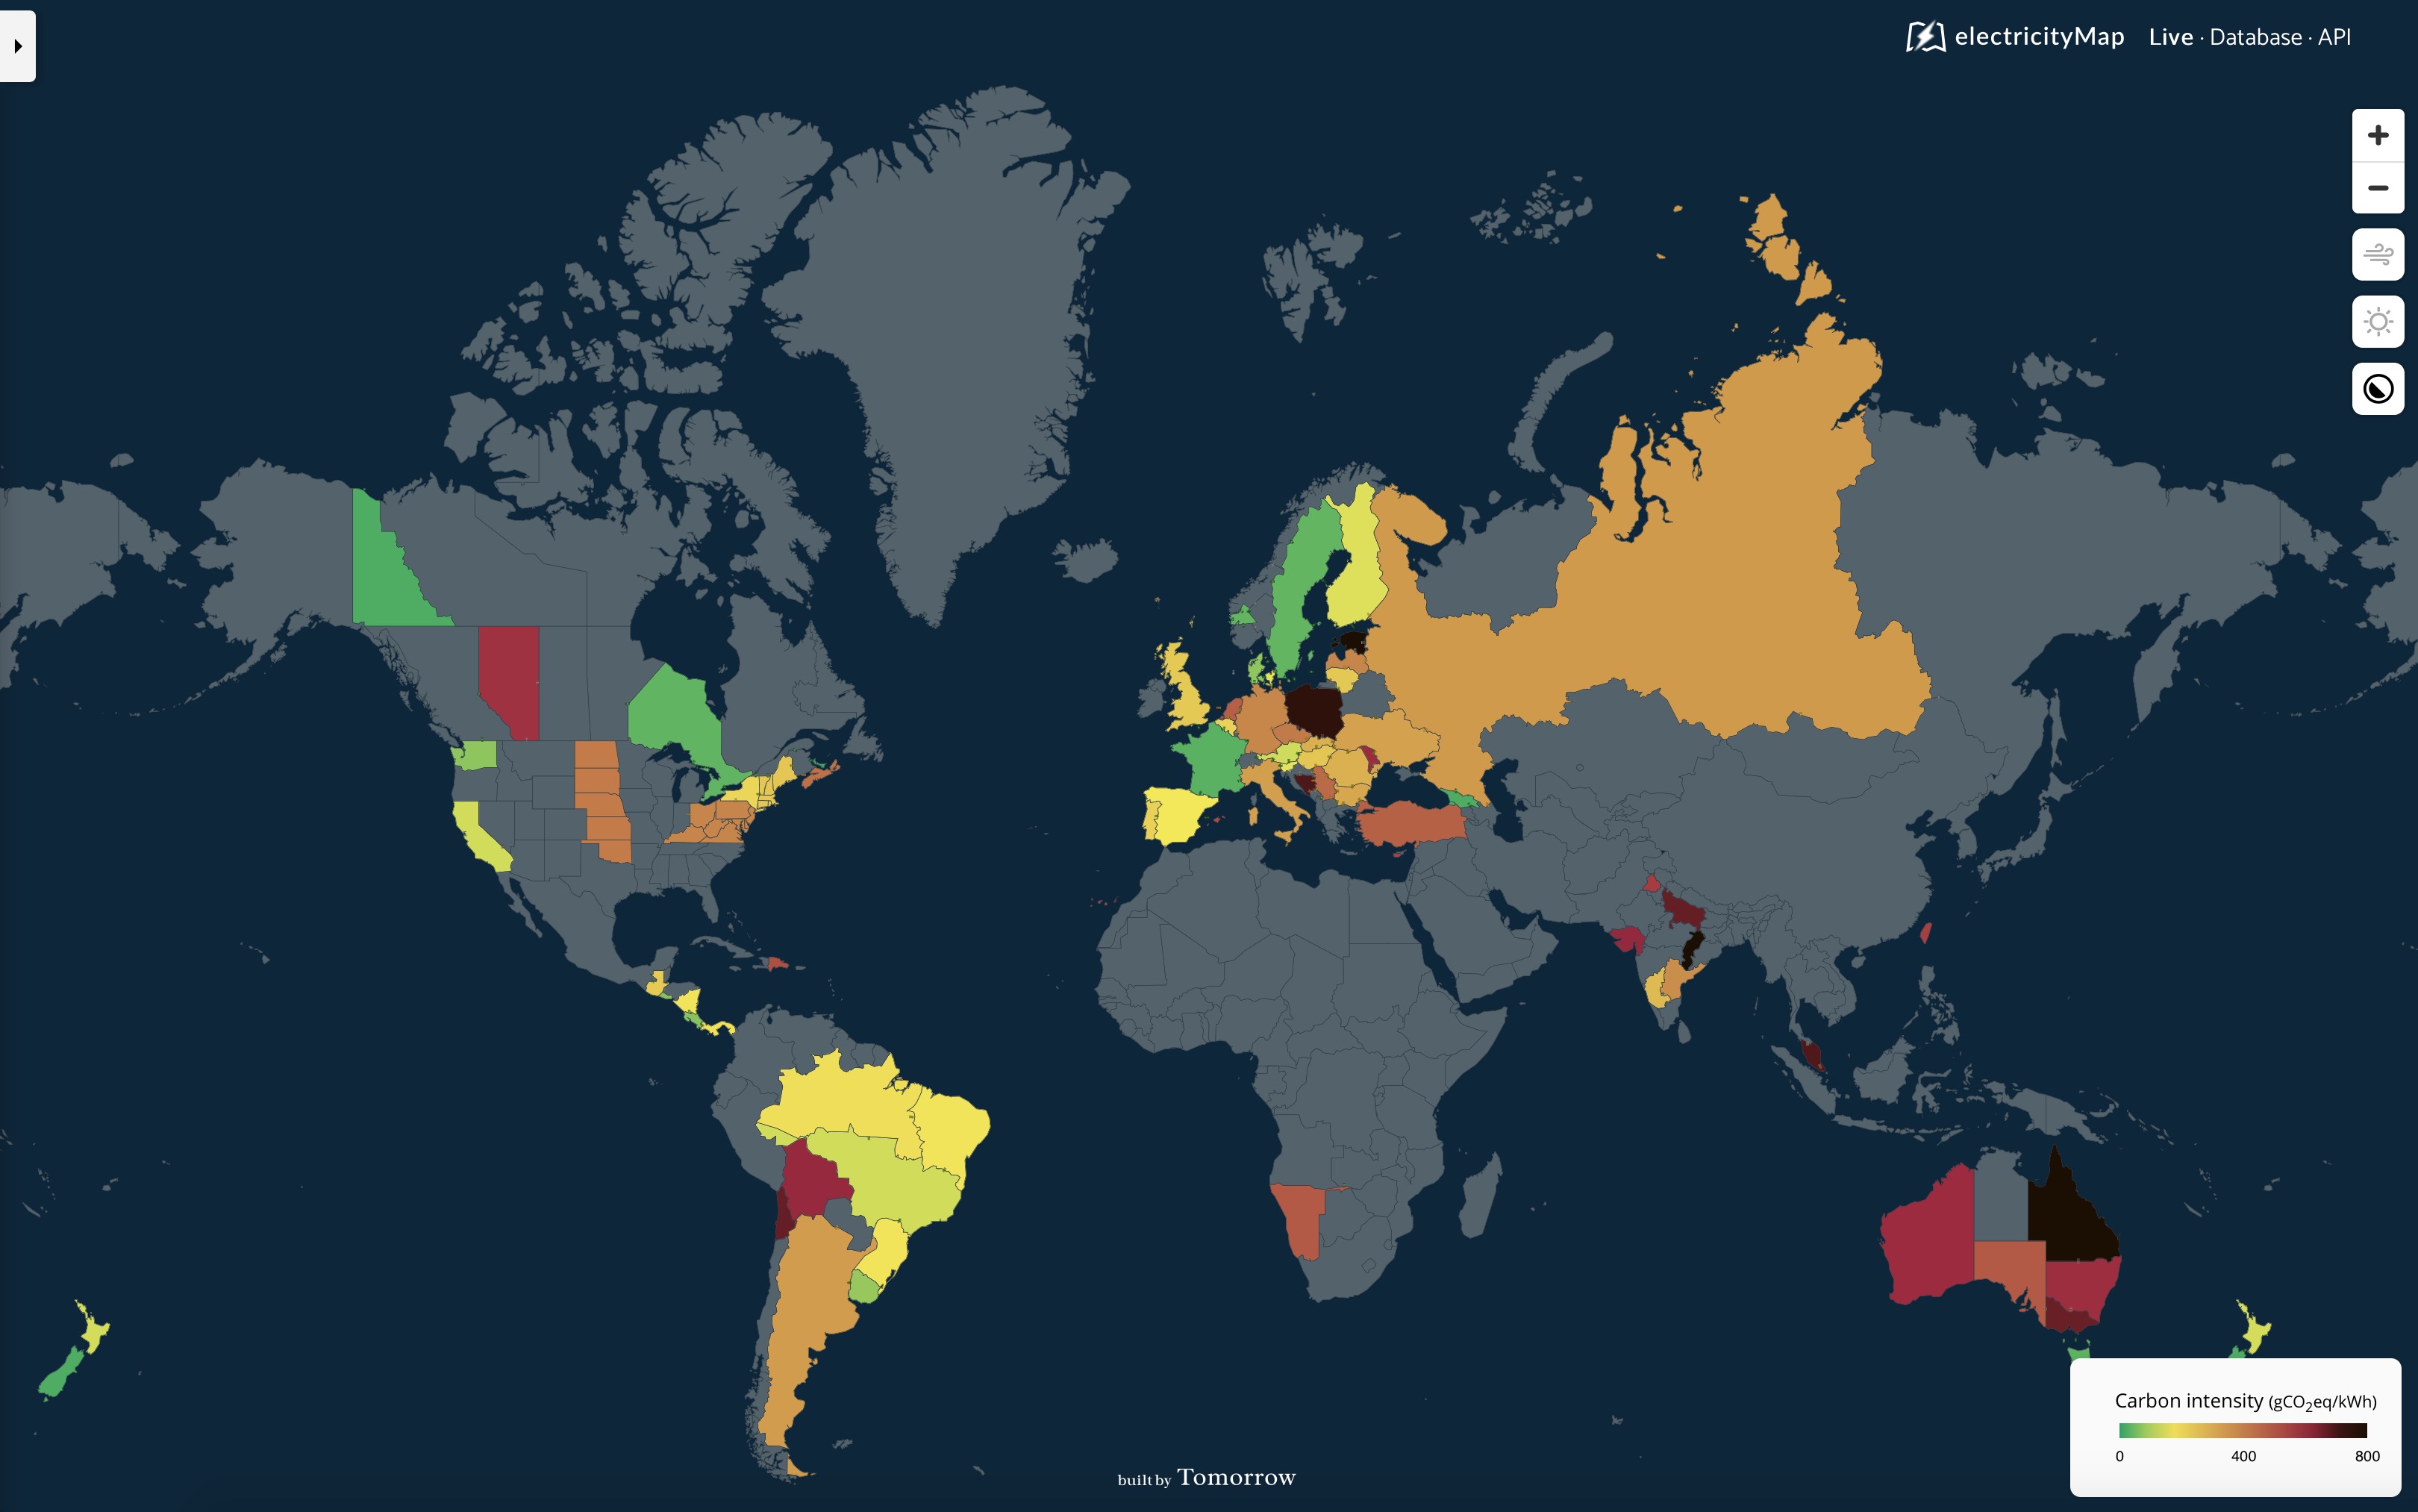
dark mode with the same Co2-coloration, ui changes and darker more blueish ocean color:
ovbm
on 18 Jun 2018
imho,
- New Color scale is better
- Bright mode proposed here is a very elegant alternative to the current dark mode
- New dark mode feels darker & geekier. Would fit very well on a poor-quality projector presentation due to contrast between country and sea. But I would maybe miss a bit the old dark mode that was kinda softer. (reposting it so we can compare)
brunolajoie
on 18 Jun 2018
Is the colour scale continuous or fixed transitions? I can't remember how it's done currently.
I really like both the light & dark maps. Big improvements imo.
systemcatch
on 18 Jun 2018
The color scale is continuous both on the current and the new versions. We've made the new scale a bit "harsher", so that only countries with intensities < ~100g are green.
ovbm
on 18 Jun 2018
love the bright colors, I think it should be the default one.
For the dark mode, I'm not sure which of the new or old one I prefer. I think on the new one, the colors are very bright, the yellow countries look radioactives!
As for the general layout, I also think it's a big improvement, it's super clean.
 maxbellec
on 18 Jun 2018
maxbellec
on 18 Jun 2018
A big day today! We merged!
corradio
on 27 Jun 2018
Related issues
corradio
·
5Comments
systemcatch
·
4Comments
 ghost
·
5Comments
ghost
·
5Comments
 jiwidi
·
4Comments
jiwidi
·
4Comments
 pascalheraud
·
4Comments
pascalheraud
·
4Comments
Most helpful comment
A big day today! We merged!